. 2020 Apr;52(4):388-400.
doi: 10.1038/s41588-020-0602-9. Epub 2020 Mar 23.

Three-dimensional chromatin landscapes in T cell acute lymphoblastic leukemia

Affiliations

Three-dimensional chromatin landscapes in T cell acute lymphoblastic leukemia

Andreas Kloetgen et al. Nat Genet. 2020 Apr.

Abstract

Differences in three-dimensional (3D) chromatin architecture can influence the integrity of topologically associating domains (TADs) and rewire specific enhancer-promoter interactions, impacting gene expression and leading to human disease. Here we investigate the 3D chromatin architecture in T cell acute lymphoblastic leukemia (T-ALL) by using primary human leukemia specimens and examine the dynamic responses of this architecture to pharmacological agents. Systematic integration of matched in situ Hi-C, RNA-seq and CTCF ChIP-seq datasets revealed widespread differences in intra-TAD chromatin interactions and TAD boundary insulation in T-ALL. Our studies identify and focus on a TAD 'fusion' event associated with absence of CTCF-mediated insulation, enabling direct interactions between the MYC promoter and a distal super-enhancer. Moreover, our data also demonstrate that small-molecule inhibitors targeting either oncogenic signal transduction or epigenetic regulation can alter specific 3D interactions found in leukemia. Overall, our study highlights the impact, complexity and dynamic nature of 3D chromatin architecture in human acute leukemia.


Conflict of interest statement

Competing Financial Interests

A.T. is a Scientific Advisor to Intelligencia.AI. All other authors declare that they have no competing financial interests.

Figures
Extended Data Fig. 1
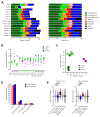
Extended Data Fig. 1. Hi-C quality control and unsupervised analyses.
A) Read alignment statistics for Hi-C datasets, as absolute reads (left) and relative reads (in %, right). “ds.accepted.intra” are all intra-chromosomal reads used for all downstream analyses. B) Genome-wide stratum-adjusted correlation coefficient (SCC) scores for all pair-wise comparisons of the Hi-C datasets. HiCRep was used to calculate chromosome-wide correlation scores, which were averaged across all chromosomes for each pair-wise comparison. The HiCRep smoothing parameter X was set to 1.0. C) Principal Component Analysis (PCA) of the genome-wide compartment scores for each Hi-C dataset. Number samples: T cells n = 3; T-ALL n = 6, ETP-ALL n = 4. D) Compartment shifts between T cells, T-ALL and ETP-ALL. Assignment of A compartment was done using an average c-score > 0.1 in either all T cell, T-ALL or ETP-ALL samples and B compartment with average c-score < -0.1. Significance for differences between pairwise comparisons of T cells, T-ALL and ETP-ALL was determined using a two-sided t test between c-scores, and compartment shifts were determined using P value < 0.1. E) Integration of gene expression associated with compartment shifts for comparisons of T cell vs T-ALL (left) or T-ALL vs ETP-ALL (right) using RNA-seq (FPKM > 1). For each gene within the respective compartment bin, log2 fold-change between T cells and T-ALL (left) or between T-ALL and ETP-ALL (right) is shown. Significant differences are calculated using an unpaired one-sided t test comparing genes from A to A compartments (i.e. active compartment) with genes from A to B or B to A compartment shifts, following the hypothesis of a positive correlation between expression and compartment association.
Extended Data Fig. 2
Extended Data Fig. 2. Genomic loci displaying differential intra-TAD activity in T-ALL.
A) Hi-C interaction heatmaps (first row) showing the IKZF2 locus (black circle). Second row shows heatmaps of log2 fold-change interactions compared to T cell 1. B) H3K27ac ChIP-seq tracks for IKZF2 locus in T cells and CUTLL1, NOTCH1 ChIP-seq tracks for CUTLL1. Tracks represent fold-enrichment over input where applicable and counts-per-million reads otherwise. Number replicates: T cells H3K27ac n = 2; CUTLL1 H3K27ac n = 2; CUTLL1 NOTCH1 n = 1. C) Quantifications for intra-TAD activity (left; as highlighted in A)) and expression of IKZF2 (right). Statistical evaluation for intra-TAD activity was performed using paired two-sided t test of average per interaction-bin for IKZF2 TAD between T cells (n = 3) and T-ALL (n = 6), followed by multiple testing correction. Log2 FPKM of IKZF2 expression for T cells (n = 13) and T-ALL (n = 6) samples; statistical evaluation was performed using edgeR followed by multiple testing correction. D) Hi-C interaction heatmaps (first row) showing the CYLD locus (black circle). Second row shows heatmaps of log2 fold-change interactions when compared to T-cell 1. E) H3K27ac ChIP-seq tracks for CYLD locus in T cells and CUTLL1, NOTCH1 ChIP-seq tracks for CUTLL1. Tracks represent fold-enrichment over input where applicable and counts-per-million reads otherwise. Number replicates: T cells H3K27ac n = 2; CUTLL1 H3K27ac n = 2; CUTLL1 NOTCH1 n = 1. F) Quantifications for intra-TAD activity (left; as highlighted in D)) and expression of CYLD (right). Statistical evaluation for intra-TAD activity was performed using paired two-sided t test of average per interaction-bin for CYLD TAD between T cells (n = 3) and T-ALL (n = 6), followed by multiple testing correction (see methods). Log2 FPKM of CYLD expression for T cells (n = 13) and T-ALL (n = 6); statistical evaluation was performed using edgeR followed by multiple testing correction.
Extended Data Fig. 3
Extended Data Fig. 3. Intra-TAD activity cross-comparison of T-ALL sub-types.
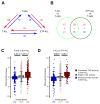
A) Comparisons of intra-TAD activity between T cells, T-ALL and ETP-ALL samples. B) Overlap of differentially active TADs between the two comparisons of T cells vs T-ALL and T cells vs ETP-ALL, visualized as venn diagram. Red and blue colors correspond to differences as highlighted in A). C+D) Integration of RNA-seq (FPKM > 1) within TADs with decreased / increased intra-TAD activity for ETP-ALL vs T cells (C) and ETP-ALL vs T-ALL (D). For each such gene, the log2 fold-change in expression between ETP-ALL and T cells (C) / T-ALL and ETP-ALL (D) taken from RNA-seq is shown. Significant differences are calculated by an unpaired one-sided t test comparing genes from TADs with decreased / increased intra-TAD activity with genes from stable TADs, following the hypothesis of a positive correlation between expression and intra-TAD activity changes.
Extended Data Fig. 4
Extended Data Fig. 4. WGS integration with TAD boundaries altered in T-ALL.
A+B) Overlap of altered TAD boundaries as in Figure 3C and 3D with genomic inversions (A) or insertions/deletions (indels) (B) from WGS of T-ALL 1 (top) and T-ALL 2 (bottom). Overlap was determined by bedtools intersect, using a 1bp overlap for indels and 100kb for individual inversion breakpoints (instead of the entire genomic range affected by the inversion). C) Overlap of individual translocation breakpoints (calculated from T-ALL Hi-C samples as in Supplementary Fig. 1B) with TAD boundaries displaying changes in TAD insulation between T cells and T-ALL. Overlap was determined by bedtools intersect, using a 1bp overlap.
Extended Data Fig. 5
Extended Data Fig. 5. Difference in CTCF insulation in MYC locus is not due to genomic mutation but potentially regulated by open chromatin.
A) CTCF ChIP-qPCR of the CTCF binding site in the lost MYC TAD boundary, shown as fold-enrichment over input. Significant differences compared to T cells were calculated with an unpaired one-sided t test, following the hypothesis of loss of CTCF binding in T-ALL samples as determined from the genome-wide analysis (n = 3 replicates for T cells, T-ALL 1, T-ALL 2, CUTLL1 and Jurkat; n = 2 replicates for T-ALL 3 and T-ALL 4). Error bars indicate s.d.; center value indicates mean. B) Targeted sanger sequencing indicates no mutation in T-ALL in the CTCF binding site at the MYC TAD boundary. Tracks show chromatogram of individual base calls (left). Whole genome sequencing indicates no mutation in T-ALL in the motif of CTCF binding site. Tracks show (mis-)matches compared to reference sequence in all reads covering the respective genomic position (right). C) CTCF ChIP-qPCR before and after treatment with global DNA-demethylation agent 5-azacytidine (n = 2 replicates). D) ATAC-seq quantification for T cells and Jurkat for the genomic area covering loss of CTCF binding in the downstream TAD boundary of MYC. Data was normalized to the average T cell signal, shown in percent (n = 3 replicates). Statistical evaluation was performed using DiffBind with edgeR-method, following multiple testing correction. Error bars indicate s.d.; center value indicates mean.
Extended Data Fig. 6
Extended Data Fig. 6. 4C-Seq validation of MYC super-enhancer interaction in primary T-ALL.
A) 4C-seq analysis using MYC promoter as viewpoint. Positive y-axis shows interactions with the MYC promoter viewpoint as normalized read counts, negative y-axis shows significance of differential interactions between T cells and primary T-ALL samples as log10(P value) derived using edgeR function glmQLFTest. H3K27ac ChIP-seq tracks for T cells and CUTLL1 are represented below as fold-enrichment over input. Number replicates: T cells 4C n = 2; T-ALL 1 4C n = 1; T-ALL 2 4C n = 2; T cells H3K27ac n = 2; CUTLL1 H3K27ac n = 2.
Extended Data Fig. 7
Extended Data Fig. 7. CRISPR-Cas9 deletion of CTCF binding site shows loss of insulation around MYC locus.
A) Schematic of Cas9+Synthetic guide transfection of activated T cells. B) Sequence showing CTCF motif in the insulator region in T cells targeted for CRISPR-based deletion. sgRNA targeting sequence within the CTCF motif is highlighted. Sequencing of sgRNA target site indicates various indels along with frequencies observed for each indel. C) CTCF ChIP-qPCR validation of reduced CTCF binding in edited T cells compared to unedited T cells (n = 2 replicates). D) qPCR comparing MYC expression in edited T cells compared to unedited T cells (n = 3 replicates). Statistical significance was determined using unpaired two-sided t test. Error bars indicate s.d.; center value indicates mean. E) 4C-seq analysis using MYC promoter as viewpoint in edited and unedited T cells. Positive y-axis shows interactions with the viewpoint as normalized read counts, negative y-axis shows significance of differential interactions between the two samples as log10(P value) calculated with edgeR function glmQLFTest. Tracks below show CTCF ChIP-seq in CUTLL1 and H3K27ac ChIP-seq in naïve T cells and CUTLL1 as fold-enrichment over input. Number replicates: T cells WT 4C n = 2; T cells Edited 4C n = 2; T cells CTCF n = 2; T cells H3K27ac n = 2; CUTLL1 H3K27ac n = 2.
Extended Data Fig. 8
Extended Data Fig. 8. Genome-wide Hi-C analysis in T-ALL following γSI shows no intra-TAD activity differences, but individual promoter-enhancer loops are disrupted.
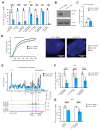
A) Volcano plot showing differential intra-TAD activity between CUTLL1 DMSO vs CUTLL1 γSI (average activity > 0.58 / < -0.58 and with FDR < 0.05). Statistical evaluation was performed using paired two-sided t test between all per bin-interactions between DMSO and γSI (n = 2 replicates). B) Representation of TAD boundary alteration events (red dots; none identified). Plots depict pair-wise comparisons for TAD boundary losses of adjacent CUTLL1 (untreated, left) TADs and for TAD boundary gains of adjacent CUTLL1 (γSI treated, right) TADs. Dotted line represents outlier threshold as in Figure 3 C) and D). C) Virtual 4C of H3K27ac HiChIP in CUTLL1, using MYC promoter as viewpoint (chr8: 128,747,680), showing edgeR-normalized CPM. H3K27ac ChIP-seq track for MYC locus shown as fold-enrichment over input. Detected significant loops as arc-representation (below) from mango pipeline utilizing two-sided binomial test per matrix-diagonal followed by multiple testing correction 63 (FDR<0.1; CPM>5). Number replicates: CUTLL1 H3K27ac HiChIP n = 1; CUTLL1 H3K27ac ChIP-seq n = 2. D) H3K27ac signal (enrichment over input) (left), chromatin interaction of the highest peak by 4C-seq (center) for the interaction of LUNAR1 promoter with its upstream enhancer and LUNAR1 expression (right). All quantifications are normalized to the respective average T cell signal, shown in percent. Significance of differences was calculated using diffBind with edgeR-method (for H3K27ac ChIP-seq, FDR) and edgeR (for 4C-seq interactions and GRO-seq as P value and FDR respectively). Error bars indicate s.d.; center value indicates mean. Number replicates: CUTLL1 DMSO H3K27ac n = 2; CUTLL1 γSI H3K27ac n = 2; CUTLL1 DMSO 4C n = 2; CUTLL1 γSI 4C n = 2; CUTLL1 DMSO GRO-seq n = 2; CUTLL1 γSI GRO-seq n = 2. E) H3K27ac signal (left), chromatin interaction of the highest peak by 4C-seq (center) for the interaction of APCDD1 enhancer with the downstream APCDD1 promoter and APCDD1 expression (right). All quantifications are normalized to the respective average T cell signal, shown in percent. Significance of differences was calculated using diffBind with edgeR-method (for H3K27ac ChIP-seq, FDR) and edgeR (for 4C-seq interactions and GRO-seq as P value and FDR respectively). Error bars indicate s.d.; center value indicates mean. Number replicates: CUTLL1 DMSO H3K27ac n = 2; CUTLL1 γSI H3K27ac n = 2; CUTLL1 DMSO 4C n = 2; CUTLL1 γSI 4C n = 2; CUTLL1 DMSO GRO-seq n = 2; CUTLL1 γSI GRO-seq n = 2. F) Schematic of γSI sensitive and insensitive enhancer. G) Peak width of stable (black; n = 111) or decreased H3K27ac signal (green, n = 76) as defined in Figure 5A. Significant difference between the distributions is estimated by a two-sided Wilcoxon test. Number replicates: CUTLL1 DMSO H3K27ac n = 2; CUTLL1 γSI H3K27ac n = 2.
Extended Data Fig. 9
Extended Data Fig. 9. Treatment with γSI does not alter all NOTCH1 dynamic enhancers.
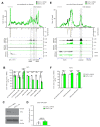
A) 4C-seq using MYC promoter as viewpoint. Positive y-axis shows interactions with viewpoint as normalized read counts, negative y-axis shows significance of differential interactions as log10(P value) calculated using edgeR function glmQLFTest (CUTLL1 DMSO n = 5; CUTLL1 γSI n = 3). Tracks below show H3K27ac, NOTCH1 ChIP-seq and GRO-seq (positive strand only) as fold-enrichment where applicable, and counts-per-million reads otherwise. B) Quantification of H3K27ac signal (enrichment over input), chromatin interactions by 4C-seq for the interactions of MYC promoter and MYC expression Interaction changes are measured by centering the 40kb bin on highest peaks within N-Me/NDME, CEE or BDME/BENC elements. MYC expression was measured by qPCR. All quantifications are normalized to CUTLL1 DMSO, shown in percent. Error bars indicate s.d.; center value indicates mean. Significance is shown as false-discovery rate (FDR) for H3K72ac signal change (R package DiffBind with edgeR-method), P value for chromatin interaction change (edgeR function glmQLFTest) or one-tailored t test for qPCR changes. C) Cropped western blot images immunoblotted with MYC antibody. Unprocessed western blots can be found as Source Data. Experiment was repeated twice with similar results. D) CTCF ChIP-qPCR of lost MYC boundary upon γSI in CUTLL1 (n = 3). Error bars indicate s.d.; center value indicates mean. Significance was calculated using unpaired two-sided t test. E) 4C-seq analysis using IKZF2 promoter as viewpoint after γSI treatment. Positive y-axis shows normalized read counts, negative y-axis shows significance of differential interactions as log10(P value) calculated using edgeR function glmQLFTest (CUTLL1 DMSO n = 3 ; CUTLL1 γSI n = 3). Tracks below show H3K27ac, NOTCH1 ChIP-seq and GRO-seq (negative strand only) as fold-enrichment over input where applicable, and counts-per-million reads otherwise. F) H3K27ac signal is specific for enhancer highlighted in D). Interaction changes are measured by centering the 40kb bin on the highest enhancer peak. IKZF2 expression after γSI treatment was measured by GRO-seq. All quantifications are normalized to the average T cell signal, shown in percent. Error bars indicate s.d.; center value indicates mean. Significance is shown as false-discovery rate (FDR) for H3K72ac signal (R package DiffBind with edgeR-method), P value for chromatin interaction (edgeR function glmQLFTest) or one-tailored t test for qPCR expression.
Extended Data Fig. 10
Extended Data Fig. 10. Treatment of T-ALL with THZ1 reduces also γSI insensitive promoter-enhancer interactions.
A) H3K27ac signal is specific for N-Me/NDME, CEE and BDME/BENC. Interaction changes are measured by centering the 40kb bin on highest peaks within N-Me/NDME, CEE or BDME/BENC elements. MYC expression after THZ1 treatment was measured by qPCR. All quantifications are normalized to the average CUTLL1 DMSO signal, shown in percent. Error bars indicate s.d.; center value indicates mean. Significance is shown as false-discovery rate (FDR) for H3K72ac signal (R package DiffBind with edgeR-method), P value for chromatin interaction (edgeR function glmQLFTest) or two-sided t test for qPCR expression. B) Cropped western blot images immunoblotted with MYC antibody. Unprocessed western blots can be found as Source Data. Experiment was repeated twice with similar results. C) CTCF ChIP-qPCR, shown as enrichment over input, of CTCF site in lost boundary in MYC locus (n = 3). Error bars indicate s.d.; center value indicates mean. Significance was calculated using unpaired two-sided t test. D) Inter-probe distance between MYC promoter and MYC-CCE measured by DNA-FISH analysis. Statistical difference between distributions of probe distances was calculated using two-sample one-sided Kolmogorov Smirnov test. Error bars indicate s.d.; center value indicates median. Probe-pairs CUTLL1 DMSO = 2001. Probe-pairs CUTLL1 THZ1 = 1308. Median distance CUTLL1 DMSO = 264.28μm. Median distance CUTLL1 THZ1 = 321.69μm. E) 4C-seq using MYC promoter as viewpoint in Jurkat cells. Positive y-axis shows normalized interaction strength with the viewpoint, negative y-axis shows significance of differential interactions as log10(P value) calculated using edgeR function glmQLFTest (n = 3). F) Interaction changes are measured by centering the 40kb bin on N-Me/NDME, CEE or the BDME/BENC. Error bars indicate s.d.; center value indicates mean. Significance is shown as P value for chromatin interaction changes (edgeR function glmQLFTest). G) Quantification of changes in H3K27ac signal (enrichment over input) and chromatin interactions of IKZF2 enhancer in CUTLL1. All quantifications are normalized to the average CUTLL1 DMSO signal, shown in percent. Error bars indicate s.d.; center value indicates mean. Significance is shown as false-discovery rate (FDR) for H3K72ac signal change (R package DiffBind with edgeR-method), P value for chromatin interaction change (edgeR function glmQLFTest).
Fig. 1
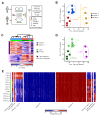
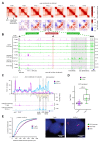
Fig. 1. In Situ Hi-C analysis identifies genome-wide 3D chromatin differences between normal T cells and T-ALL subtypes.
A) Schematic showing the overall study design. B) Principal Component Analysis (PCA) of “hic-ratio” insulation scores for each Hi-C dataset (n = 13) identified three distinct clusters. Clustering was performed using R package Mclust, with EII and VII models showing an optimal separation using three clusters. C) Heatmap representation of RNA-seq results for clusters 2 and 3 separated by T-ALL and ETP-ALL gene signature (rows). Gene signature was derived from RNA-seq results from ,,. Heatmap shows row z-score of FPKM normalized read-counts using edgeR function rpkm. D) Principal Component Analysis (PCA) of the “hic-ratio” insulation scores as in B) (n = 13), colored by cell type assignment with the help of RNA-seq. E) Compartment analysis using the c-score tool on all Hi-C datasets (n = 13). Different categories of disease-specific / common compartment switches were identified using unpaired two-sided t test on c-scores between T-ALL, ETP-ALL and T cells (P value < 0.1).
Fig. 2
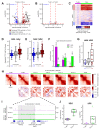
Fig. 2. Intra-TAD activity changes affect downstream effectors of T-ALL pathogenesis
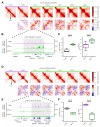
A) Volcano plot showing differential intra-TAD activity for comparisons of T cells versus canonical T-ALL (all TADs n = 1027). Statistical evaluation was performed using paired two-sided t test pairing each interaction-bin per TAD between averages of T cells and canonical T-ALL, followed by multiple testing correction. B) Volcano plot of the same analysis as in A) between two independent T cell Hi-C samples (all TADs n = 1,027). C) Heatmap showing average per-sample intra-TAD activity in T-ALL samples and T cells normalized by the average intra-TAD activity across all three T cell samples. Rows are showing differentially active / stable TADs as highlighted in A). D) Integration of CTCF binding with TAD boundary categories from A). All CTCF bindings from surrounding TAD boundaries are aggregated, and log2 fold-change of CTCF signals between T-ALL and T cell is shown. Significant differences are calculated using an unpaired one-sided t test comparing decreased / increased intra-TAD activity with stable TADs E) Integration of RNA-seq (FPKM > 1) within TADs with decreased / increased intra-TAD activity. For each gene, log2 fold-change between T cells and T-ALL from RNA-seq is shown. Significant differences are calculated using an unpaired one-sided t test comparing genes from TADs with decreased / increased intra-TAD activity with genes from stable TADs. F) Super-enhancer integration with differentially active TADs. Enrichment score was calculated as observed overlap between super-enhancers and differentially active / stable TADs over expected background. Statistical enrichment was calculated using two-sided Fisher’s exact test. G) Number of dynamic NOTCH1-binding sites per 1 Mb within TADs of decreased, stable or increased TAD activity as defined in A). Significant differences of increased/decreased categories versus stable TADs was performed using an unpaired two-sided t test. H) Hi-C interaction heatmaps (first row) showing the APCDD1 containing TAD. Second row shows heatmaps of per-bin log2 fold-change interactions when compared to T cell 1. I) H3K27ac and NOTCH1 ChIP-seq tracks for the APCDD1 locus, shown as fold-enrichment over input. Number replicates: T cells H3K27ac n = 2; CUTLL1 H3K27ac n = 2; CUTLL1 NOTCH1 n = 1. J) Quantifications for intra-TAD activity (left; as highlighted in G)) and expression of APCDD1 (right). Statistical evaluation for intra-TAD activity was performed using paired two-sided t test of average per interaction-bin for APCDD1 TAD between averages of T cells (n = 3) and T-ALL (n = 6), followed by multiple testing correction. APCDD1 expression was determined by RNA-seq and shown as log2 FPKM for T cells (n = 13) and T-ALL (n = 6) samples; normalization and statistical evaluation was performed using edgeR followed by multiple testing correction.
Fig. 3
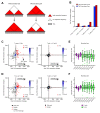
Fig. 3. TAD boundary insulation analysis reveals changes in insulation of neighboring TADs.
A) Schematic describing TAD boundary insulation alteration events. B) Total numbers of TAD boundary gains / losses identified between T-ALL and T cells. C+D) Representation of TAD insulation alteration events (red dots) among all pairs of adjacent TADs (black dots; n = 2,160 for boundary loss; n = 2,772 for boundary gain). Plots depict comparisons for TAD boundary losses of adjacent T cell TADs within T-ALL samples (C left), or between T cell samples 1 and 3 (C right). Plots in D) depict comparisons for TAD boundary gains of adjacent T-ALL TADs when compared to T cell samples (D left), or between T cell samples 1 and 3 (D right). Encircled adjacent TADs demarcate outliers of increased / decreased insulation accompanied by at least one increased / decreased CTCF binding, respectively. Significant changes in CTCF binding were calculated using the R package DiffBind with edgeR-method and filtered for FDR < 0.1 and log2 fold-change > 1 / < -1. E+F) All TAD boundary alterations (boundary loss (E), boundary gain (F)) from comparisons in C) and D) between T-ALL and T cells were used to estimate heterogeneity. Hic-ratio insulation scores for each boundary and sample were compared vs. the average hic-ratio insulation score of all T cell samples. Boundary losses (n = 81) come with a decrease in insulation scores on average, while boundary gains (n = 86) come with increase in insulation scores across all T-ALLs on average when compared to the average hic-ratio insulation score of all T cell samples.
Fig. 4
Fig. 4. CTCF-mediated TAD insulation defines accessibility of MYC promoter/super-enhancer looping
A) Hi-C interaction heatmaps (first row) showing the MYC locus. Second row shows heatmaps of per-bin log2 fold-change interactions when compared to T cell 1. B) CTCF and H3K27ac ChIP-seq tracks for the MYC locus. CTCF orientation is shown for canonical CTCF binding motifs derived from PWMScan (database JASPAR CORE vertebrates; filtered by P value < 1 × 10⁻⁵; n = 143,164 total CTCF binding motifs). ChIP-seq and ATAC-seq tracks show fold-enrichment over input where applicable, counts-per-million reads otherwise. Number replicates: T cells CTCF n = 2; T-ALL 1 CTCF n = 2; T-ALL 3 CTCF n = 1; CUTLL1 CTCF n = 5; Jurkat CTCF n = 2; T cells H3K27ac n = 2; CUTLL1 H3K27ac n = 2; CUTLL1 NOTCH1 n = 1; T cells ATAC-seq n = 6; Jurkat ATAC-seq n = 3. C) 4C-seq using MYC promoter as viewpoint. Positive y-axis shows interactions with the MYC promoter viewpoint as normalized read counts, negative y-axis shows significance of differential interactions between T cells and CUTLL1 as log10(P value) derived using edgeR function glmQLFTest. Tracks below show H3K27ac ChIP-seq tracks for T cells and CUTLL1 as fold-enrichment over input. Number replicates: T cells 4C n = 2; CUTLL1 4C n = 5; T cells H3K27ac n = 2; CUTLL1 H3K27ac n = 2. D) MYC expression shown as log2 FPKM for T cells (n = 13) and T-ALL (n = 6). Statistical evaluation was performed using two-sided edgeR analysis with glmQLFTest followed by multiple testing correction. E) Distance between MYC promoter and center enhancer element (MYC-CCE) measured by DNA-FISH analysis (left). Statistical difference between distributions of probe distances was calculated using two-sample one-sided Kolmogorov-Smirnov test following the hypothesis of increased probe-distance in T cells when compared to T-ALL. Error bars indicate s.d.; center value indicates median. Probe-pairs T cells = 993; Probe-pairs CUTLL1 = 2,001. Median distance T cells = 412.84 μm. Median distance CUTLL1 = 264.28 μm.
Fig. 5
Fig. 5. NOTCH1 inhibition affects promoter-enhancer looping specifically of NOTCH1-dependent enhancers
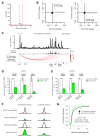
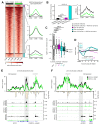
A) H3K27ac occupancy in CUTLL1 with and without NOTCH1-inhibitor γSI. Groups consist of stable (middle, black, n = 2,949), increased (upper, pink, n = 125) and reduced non-promoter H3K27ac signal (lower, light-blue, n = 243). Heatmap shows the H3K27ac signal as fold-enrichment over input and line plots depict quantification of H3K27ac signal, both created with DeepTools . Differential analysis was performed with the R package DiffBind with edgeR-method and differential peaks were selected using FDR < 0.05, log2 fold-change > 1.0 or < -1.0 (number replicates: CUTLL1 DMSO n = 4; CUTLL1 γSI n = 2). B) Overlap of constant, increased and reduced H3K27ac peaks with previously defined NOTCH1-dynamic sites . Quantification of H3K27ac signal shown as fold-enrichment over input (right panel) for peaks with reduced H3K27ac signal and dynamic NOTCH1 binding (n = 76). Statistical evaluation was performed using two-sided Fisher test against all non-coding H3K27ac peaks overlapping dynamic NOTCH1 binding. C) Changes in chromatin interactions upon γSI between non-promoter H3K27ac peaks defined in A) and B) and connected gene promoters are shown as log2 fold-change of averaged normalized interaction scores (average of n = 2 biological replicates). Each dot represents a promoter-enhancer interaction defined by H3K27ac HiChIP in CUTLL1. Significance of shifts of gene expression compared to enhancer-promoter loops of stable enhancers is calculated using an unpaired one-sided t test, following the hypothesis of a positive correlation between enhancer activity and promoter-looping. D) Gene expression upon γSI for all genes defined in C) are shown as log2 fold-change of FPKM calculated from GRO-seq data. Significance of differences compared to genes associated with stable H3K27ac signal is calculated using an unpaired one-sided t test, following the hypothesis of a positive correlation between promoter-enhancer looping and gene expression. E+F) 4C-seq using LUNAR1 promoter (E) or APCDD1 enhancer (F) as viewpoints. Positive y-axis shows interactions with the viewpoint as normalized read counts, negative y-axis shows significance of differential interactions between untreated and γSI treated CUTLL1 as log10(P value) calculated using edgeR function glmQLFTest. Tracks below show H3K27ac and NOTCH1 ChIP-seq and GRO-seq (positive strand only) as fold-enrichment over input where applicable, counts-per-million otherwise. Number replicates: CUTLL1 DMSO 4C LUNAR1 n = 2; CUTLL1 γSI 4C LUNAR1 n = 2; CUTLL1 DMSO 4C APCDD1 n = 2; CUTLL1 γSI 4C APCDD1 n = 2; CUTLL1 DMSO H3K27ac n = 2; CUTLL1 γSI H3K7ac n = 2; CUTLL1 DMSO NOTCH1 n = 1; CUTLL1 γSI NOTCH1 n = 1; CUTLL1 DMSO GRO-seq n = 2; CUTLL1 γSI GRO-seq n = 2.
Fig. 6
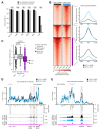
Fig. 6. CDK7 inhibition concomitantly reduces H3K27ac levels and associated promoter-enhancer looping
A) LOLA analysis for public ChIP-seq data in CUTLL1/Jurkat from the LOLA database with γSI-insensitive and γSI-sensitive enhancers. Statistical differences in overlap between γSI-insensitive and sensitive enhancers with ChIP-seq peaks were calculated using a two-sided Fisher exact test. B) H3K27ac occupancy in CUTLL1. Groups consist of stable (middle, white, n = 1,396), increased (upper, grey, n = 2,246) and reduced non-promoter H3K27ac signal (lower, pink, n = 3248). Heatmap shows the H3K27ac signal as fold-enrichment over input and line plots depict quantification of H3K27ac signal. Differential analysis was performed with the R package DiffBind with edgeR-method and differential peaks were selected using FDR < 0.05, log2 fold-change > 1.0 or < -1.0 (Number replicates: CUTLL1 DMSO n = 4; CUTLL1 n = 2). C) Changes in Hi-C interactions between non-promoter H3K27ac peaks defined in B) and connected gene promoters (defined using CUTLL1 H3K27ac HiChIP) are shown as log2 fold-change (average of n = 2 replicates). Each dot represents a promoter-enhancer interaction. Significance of shifts compared to enhancer-promoter interactions associated with stable enhancers is calculated by an unpaired one-sided t test. D+E) 4C-seq using MYC (D) or IKZF2 promoter (E) as viewpoint. Positive y-axis shows interactions with the viewpoint as normalized read counts, negative y-axis shows significance of differential interactions as log10(P value) calculated using edgeR function glmQLFTest. Tracks below show H3K27ac and CDK7 ChIP-seq track, and represent fold-enrichment over input where applicable and counts-per-million reads otherwise. Number replicates: CUTLL1 DMSO 4C MYC n = 3; CUTLL1 THZ1 4C MYC n = 3; CUTLL1 DMSO 4C IKZF2 n = 3; CUTLL1 THZ1 4C IKZF2 n = 3; CUTLL1 DMSO H3K27ac n = 2; CUTLL1 THZ1 H3K27ac n = 2; Jurkat CDK7 n = 1.

Similar articles

Cited by

References

    1. Lupiáñez Darío G, et al. Disruptions of Topological Chromatin Domains Cause Pathogenic Rewiring of Gene-Enhancer Interactions. Cell. 161:1012–1025. - PMC - PubMed
    1. Flavahan WA, et al. Insulator dysfunction and oncogene activation in IDH mutant gliomas. Nature. 2016;529:110–4. - PMC - PubMed
    1. Spielmann M, Lupianez DG, Mundlos S. Structural variation in the 3D genome. Nat Rev Genet. 2018 - PubMed
    1. Dekker J, Mirny L. The 3D Genome as Moderator of Chromosomal Communication. Cell. 2016;164:1110–1121. - PMC - PubMed
    1. Lieberman-Aiden E, et al. Comprehensive mapping of long-range interactions reveals folding principles of the human genome. Science. 2009;326 - PMC - PubMed

Publication types