. 2020 Apr;23(4):500-509.
doi: 10.1038/s41593-020-0602-1. Epub 2020 Mar 16.

Astrocyte layers in the mammalian cerebral cortex revealed by a single-cell in situ transcriptomic map

Affiliations

Astrocyte layers in the mammalian cerebral cortex revealed by a single-cell in situ transcriptomic map

Omer Ali Bayraktar et al. Nat Neurosci. 2020 Apr.

Abstract

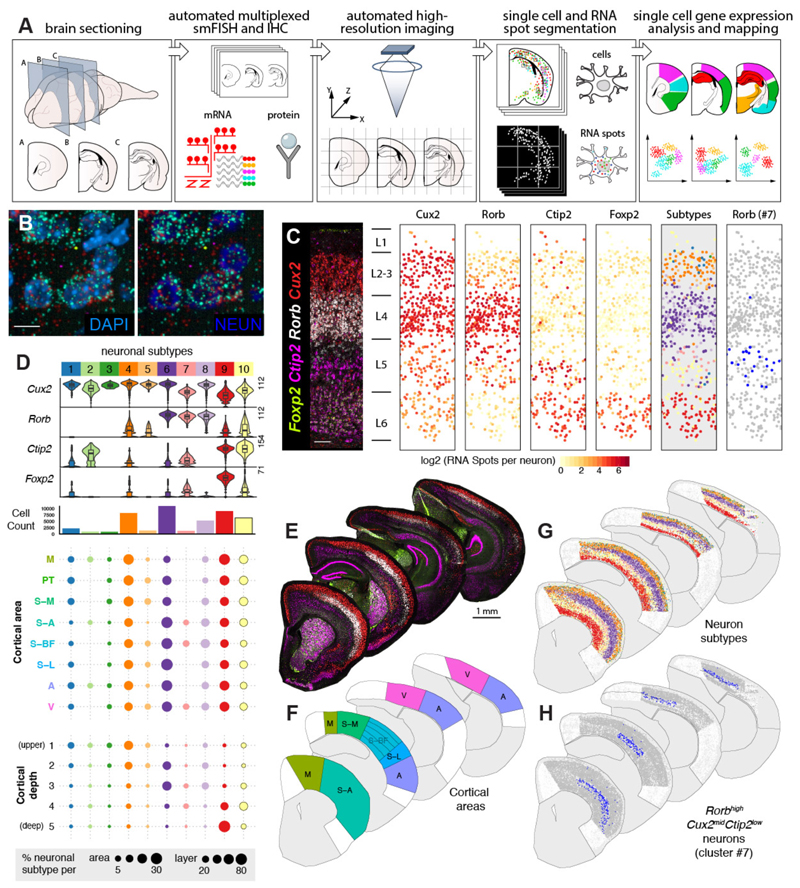
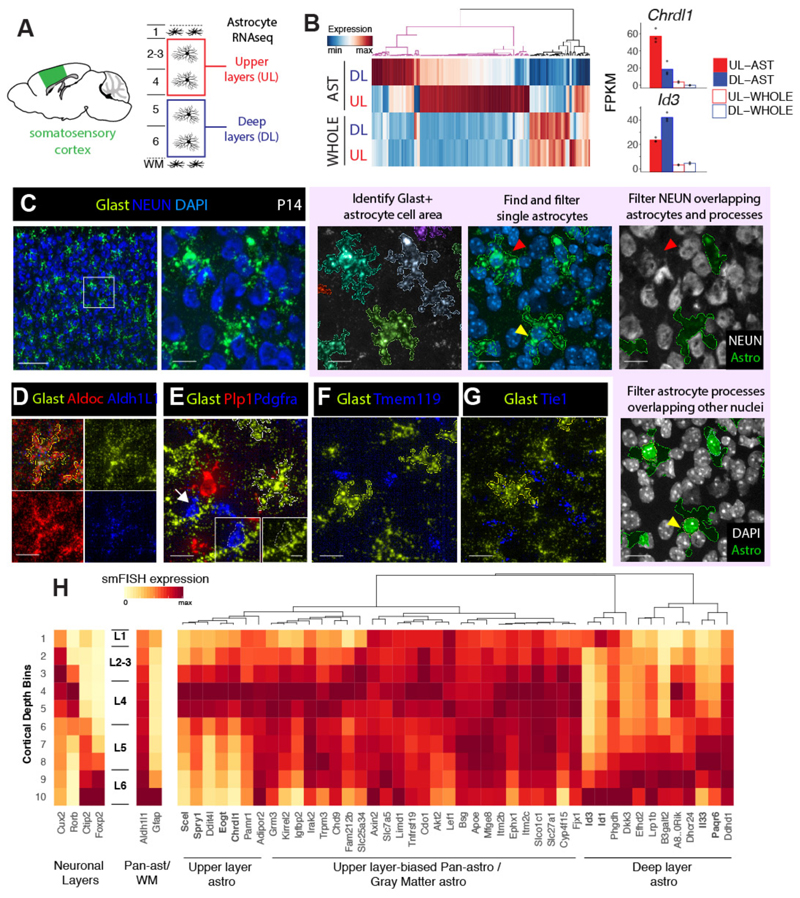
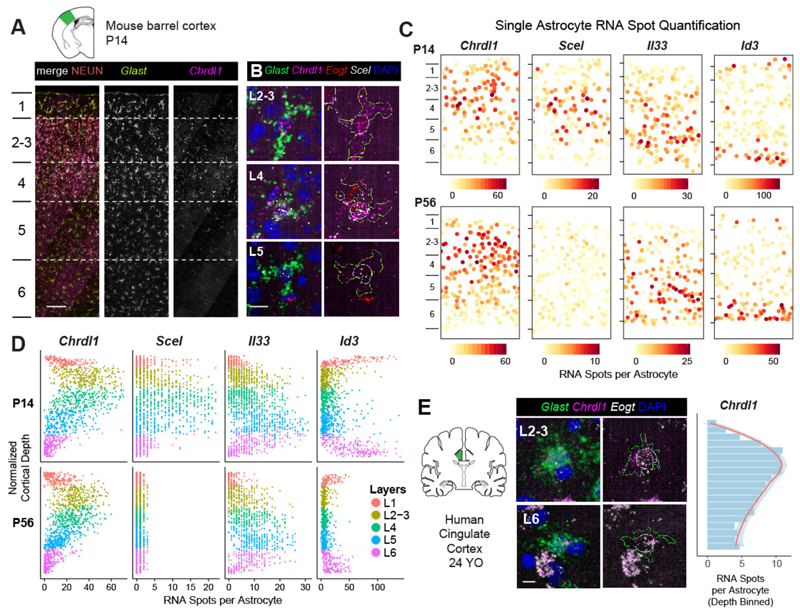
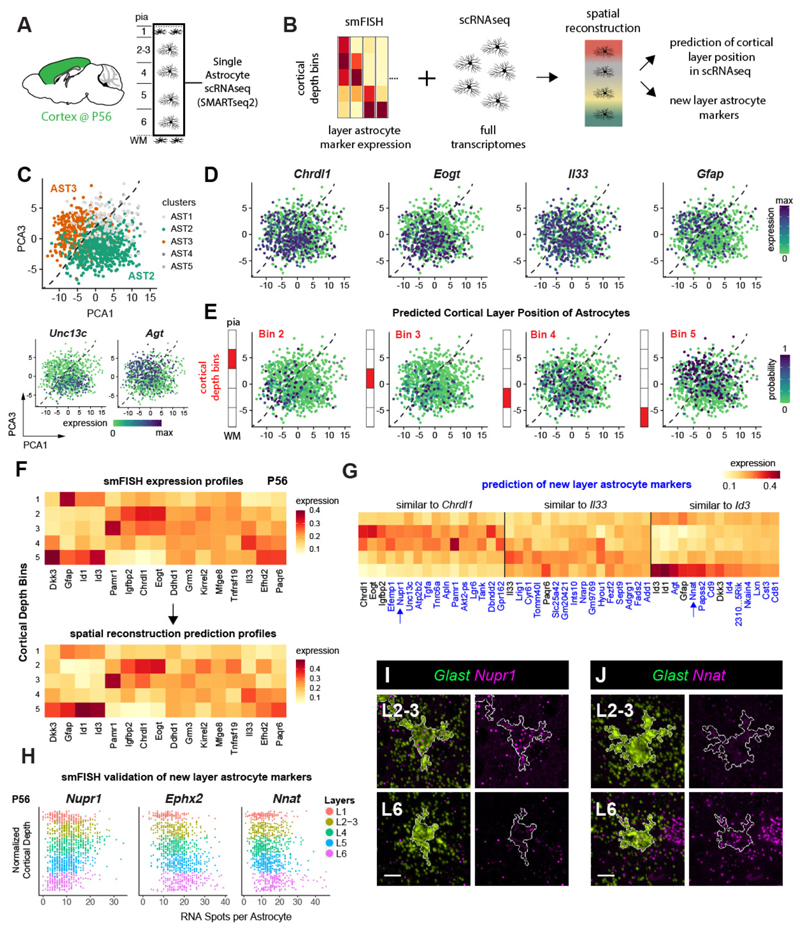
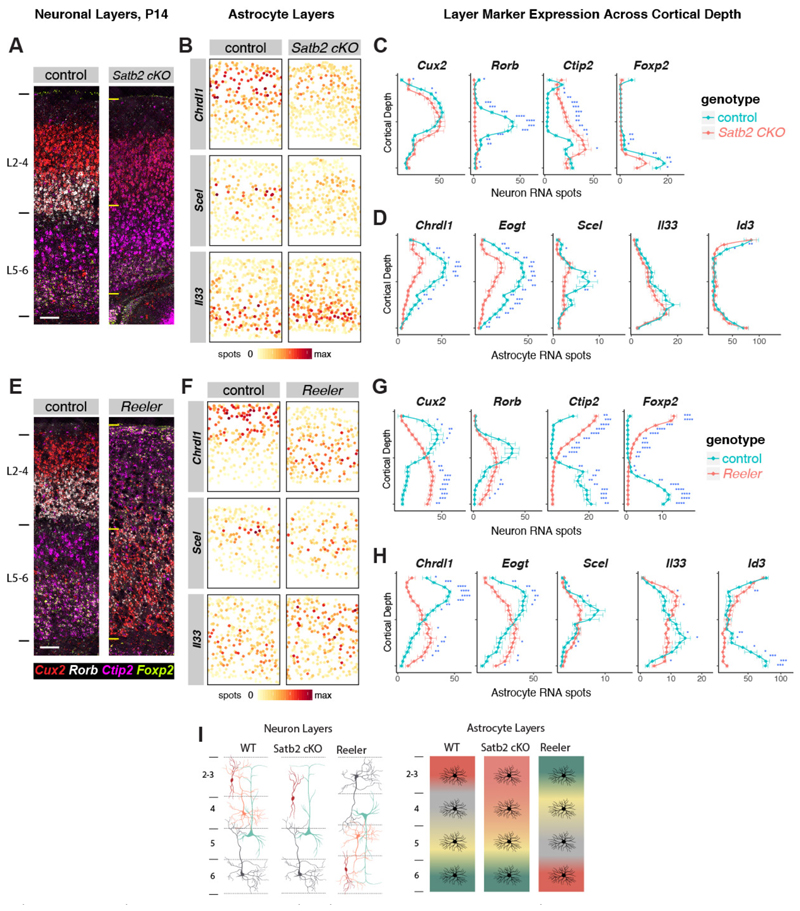
Although the cerebral cortex is organized into six excitatory neuronal layers, it is unclear whether glial cells show distinct layering. In the present study, we developed a high-content pipeline, the large-area spatial transcriptomic (LaST) map, which can quantify single-cell gene expression in situ. Screening 46 candidate genes for astrocyte diversity across the mouse cortex, we identified superficial, mid and deep astrocyte identities in gradient layer patterns that were distinct from those of neurons. Astrocyte layer features, established in the early postnatal cortex, mostly persisted in adult mouse and human cortex. Single-cell RNA sequencing and spatial reconstruction analysis further confirmed the presence of astrocyte layers in the adult cortex. Satb2 and Reeler mutations that shifted neuronal post-mitotic development were sufficient to alter glial layering, indicating an instructive role for neuronal cues. Finally, astrocyte layer patterns diverged between mouse cortical regions. These findings indicate that excitatory neurons and astrocytes are organized into distinct lineage-associated laminae.


Conflict of interest statement

Competing financial interests

The authors declare no competing financial interests.

Figures

Figure 1
Figure 1. LaST map pipeline for mapping cortical neuronal subtypes in situ.
A) Design of automated spatial transcriptomic pipeline. B) High resolution imaging of large tissue areas. Shown are 40X z-projection images of Rorb + L4 neurons in the P14 mouse barrel cortex. C) Automated mapping of layer neuron marker expression and layer neuron subtypes in the mouse barrel cortex. Automatically identified single neurons are plotted as solid circles and colored according to expression (middle panels) or subtype classification (right panels). D) Identification of neuronal subtypes based on unbiased classification of single cell level smFISH data. tSNE and hierarchical clustering of 46,888 cortical neurons yielded 10 subpopulations. (Top) Violin plots show single cell expression profiles of clusters, highest RNA spot count per cell are shown on the left. (Middle) Histograms showing total number of cells per cluster. (Bottom) Spatial distribution of clusters across cortical areas and five normalized cortical depth bins, shown as percentage of total neurons in given area/depth bin (bottom). E-H) Single cell mapping of cortical neuron subtypes: (E) Low magnification images of P14 hemisections from four different anatomical levels, (F) broad cortical areas included in the analysis, (G) maps of 10 major neuronal populations, and (H) spatial distribution of area-restricted L5 Rorb high Cux2 mid Bcl11b low neurons. n = 1 mouse, 10 tissue sections independently imaged. Scalebars: (B) 10 µm, (C) 100 µm, (E) 1 mm. Abbreviations: M, motor, S-A, anterior- somatosensory, S-M, medial-somatosensory, S-BF, somatosensory barrel, S-L, somatosensory-lateral, PT, parietal, A, auditory, V, visual.
Figure 2
Figure 2. Novel layer expression differences amongst cortical gray matter astrocytes revealed via RNAseq and LaSTmap.
A) Diagram showing somatosensory cortical areas and layers used for laminar gray matter astrocyte RNAseq expression profiling. B) Novel molecular heterogeneity of layer astrocytes identified by RNAseq. 159 differentially expressed genes between upper and deep layer gray matter astrocytes (FDR<0.05 and expression threshold of FPKM>5) were detected. Bar plots show mean expression (n=3 mice for astrocytes, 2 mice for whole cortex). C) Identification of astrocyte gene expression with Glast (Slc1a3) smFISH. The astrocyte cell area is segmented from the Glast signal and nuclei are segmented from DAPI. Single astrocytes are selected using morphological and intensity filters, overlapping neurons and non-astrocyte nuclei are excluded. D-G) Glast is a specific marker of astrocytes. Solid outlines indicate the cell areas of identified single astrocytes. H) Screening candidate layer astrocyte genes with LaSTmap identifies laminar expression patterns in situ. Tile heatmaps show average single cell gene expression binned across cortical depth in the P14 somatosensory cortex (n =2 pooled biological replicates across multiple tissue sections). Upper and deep layer genes with astrocyte-specific expression are marked in bold. n = 2 mice independently assayed, 3 tissue sections imaged per replicate. Scalebars: (C, left panel) 100 µm, (C, other panels) 25 µm, (D-G) 25 µm, (E, inset) 10 µm.
Figure 3
Figure 3. Astrocytes show broad expression gradients across cortical depth and diverge from neuronal layers.
A-B) Upper layer astrocyte enrichment of Chrdl1, Scel and Eogt. Images show the mouse barrel cortex at P14 (A) and close-ups of astrocytes across layers (B). Astrocyte cell areas are marked with yellow outlines and nuclei are marked with white outlines. C) Astrocytes are organized into superficial, mid and deep layers across the cortical gray matter. Single astrocyte expression maps in the barrel cortex at P14 (top panels) and P56 (bottom panels). Astrocytes are plotted as solid circles and colored quantitively for RNA spot counts per gene per cell. D) Single astrocyte quantification of layer astrocyte markers across cortical depth in the barrel cortex at P14 and P56. E) Upper layer astrocyte enrichment of Chrdl1 expression in the adult human cingulate cortex. Quantification of depth binned average single astrocyte expression shown on the right. n=1 mouse per timepoint, 3 tissue sections imaged independently per gene panel (A-D) and 3 human brains independently assayed, 1-2 sections imaged per case (E). Scalebars: (A) 100 µm, (B, E) 10 µm.
Figure 4
Figure 4. Spatial reconstruction of astrocyte layers from single cell transcriptome data.
A-B) Diagrams showing cortical areas and layers used for single astrocyte RNAseq expression profiling (A) and strategy for spatial gene expression reconstruction (B). C) Astrocyte clusters in scRNA-seq data visualized using PCA plots (PC1: 3% PC2: 0.77%. of variance). Dashed lines indicate the border between the major clusters AST2 and AST3 (colors, top). Bottom plots show the expression of cluster markers (log2 Smart-seq2 read counts). n = 2 independent experiments. D) Astrocyte layer markers express in subpopulations of astrocytes in scRNA-seq data but not in a cluster-specific manner. PCA plots are shown. E) Predicted astrocyte layering across scRNA-seq data as a new axis of heterogeneity. PCA plots (X-axis is PC 1, Y-axis is PC 3) indicate the probability of cell assignment (color) to the cortical depth bins as diagrammed. F) The smFISH reference of 16 layer astrocyte markers used for the reconstruction (top) and the predicted output of the reconstruction(bottom). Expression scaled to sum to 1 across bins (Y-axis). G) New candidate layer astrocyte genes predicted by the spatial reconstruction model. The expression pattern of top 10 new layer astrocyte genes (X-axis) that are most similar to Chrdl1, Il33 and Id3 are shown. Expression scaled to sum to 1 across bins (Y-axis). H-J) Validation of three new candidate layer astrocyte genes using LaSTmap smFISH. Single astrocyte quantification across cortical depth in the barrel cortex at P56 (n=3 pooled tissue sections from one replicate per timepoint) (H). Close-up images of astrocytes. White outlines mark astrocyte cell areas (I,J). n=2 mice independently assayed, 3 sections imaged. Scalebars: (I,J) 10 µm.
Figure 5
Figure 5. Evidence that post-mitotic neuronal cues establish astrocyte layer identities.
A-D) Satb2 cKO mice show defects in upper layer neuron and astrocyte identity. A) Images showing aberrant upper neuronal layers in the Satb2 cKO barrel cortex at P14. B) Single astrocyte maps of layer astrocyte marker gene expression. C-D) Quantification of cortical depth binned layer neuronal (C) and astrocyte (D) marker expression in cKO vs control. E-H) Reeler mice show inversion of neuronal and astrocyte layers. E) Images showing neuronal layer inversion in the Reln-/- barrel cortex at P14. F) Single astrocyte maps of layer astrocyte marker gene expression. G-H) Quantification of cortical depth binned layer neuronal (G) and astrocyte (H) marker expression in cKO vs control. I) Diagrams depicting layer neuron and astrocyte changes in Satb2 cKO and Reln-/- mice. n= 3 mice per genotype independently assayed, 5 tissue sections from each replicate imaged. Scalebars: 100 µm. All data represent mean ± s.d. : Two-tailed Student’s t-tests were used with *P < 0.05,**P < 0.01, ***P < 0.001.
Figure 6
Figure 6. Astrocyte arealization across the cortex.
A-C) Single cell mapping of astrocyte gene expression across cortical areas. Maps show the (A) P14 cortical areas used in the analysis, (B) single astrocyte expression of Scel and (C) Chrdl1 across the dorsoventral and rostrocaudal extent of the cortex. Astrocytes are plotted as solid circles and colored quantitively for RNA spot counts per gene per cell. Arrowheads indicate the restriction of Scel expression to sensory areas. Abbreviations as in Fig 1. D) Astrocyte layers are distinct across cortical areas. Smoothened tile plots showing the quantification of neuronal Rorb expression and astrocyte expression of Scel, Chrdl and Il33 across the cortical areas and layers E) Diagrams showing the divergent layer heterogeneity of astrocytes. Our study identifies superficial (sAS), mid (mAS) and deep (dAS) layer astrocyte subtypes through cortical gray matter in the postnatal cortex and confirms white matter like (wlAS) properties of L6 astrocytes. F) 3D model showing astrocyte area and layer heterogeneity. Astrocyte layering is regionally specialized across the dorsoventral and rostrocaudal extent of the cortex. n = 1 mouse, 10 tissue sections independently imaged.

Similar articles

Cited by

References

    1. Molyneaux BJ, Arlotta P, Menezes JRL, Macklis JD. Neuronal subtype specification in the cerebral cortex. Nat Rev Neurosci. 2007 Jun;8(6):427–37. - PubMed
    1. Freeman MR, Rowitch DH. Evolving concepts of gliogenesis: a look way back and ahead to the next 25 years. Neuron. 2013 Oct 30;80(3):613–23. - PMC - PubMed
    1. Doyle JP, Dougherty JD, Heiman M, Schmidt EF, Stevens TR, Ma G, et al. Application of a Translational Profiling Approach for the Comparative Analysis of CNS Cell Types. Cell. 2008 Nov;135(4):749–62. - PMC - PubMed
    1. Chai H, Diaz-Castro B, Shigetomi E, Monte E, Octeau JC, Yu X, et al. Neural Circuit- Specialized Astrocytes: Transcriptomic, Proteomic, Morphological, and Functional Evidence. Neuron. 2017 Jul - PMC - PubMed
    1. John Lin C-C, Yu K, Hatcher A, Huang T-W, Lee HK, Carlson J, et al. Identification of diverse astrocyte populations and their malignant analogs. Nat Neurosci. 2017 Feb 6; - PMC - PubMed

Publication types