. 2020 Apr;23(4):533-543.
doi: 10.1038/s41593-020-0592-z. Epub 2020 Mar 16.

Kcnn2 blockade reverses learning deficits in a mouse model of fetal alcohol spectrum disorders

Affiliations

Kcnn2 blockade reverses learning deficits in a mouse model of fetal alcohol spectrum disorders

Shahid Mohammad et al. Nat Neurosci. 2020 Apr.

Abstract

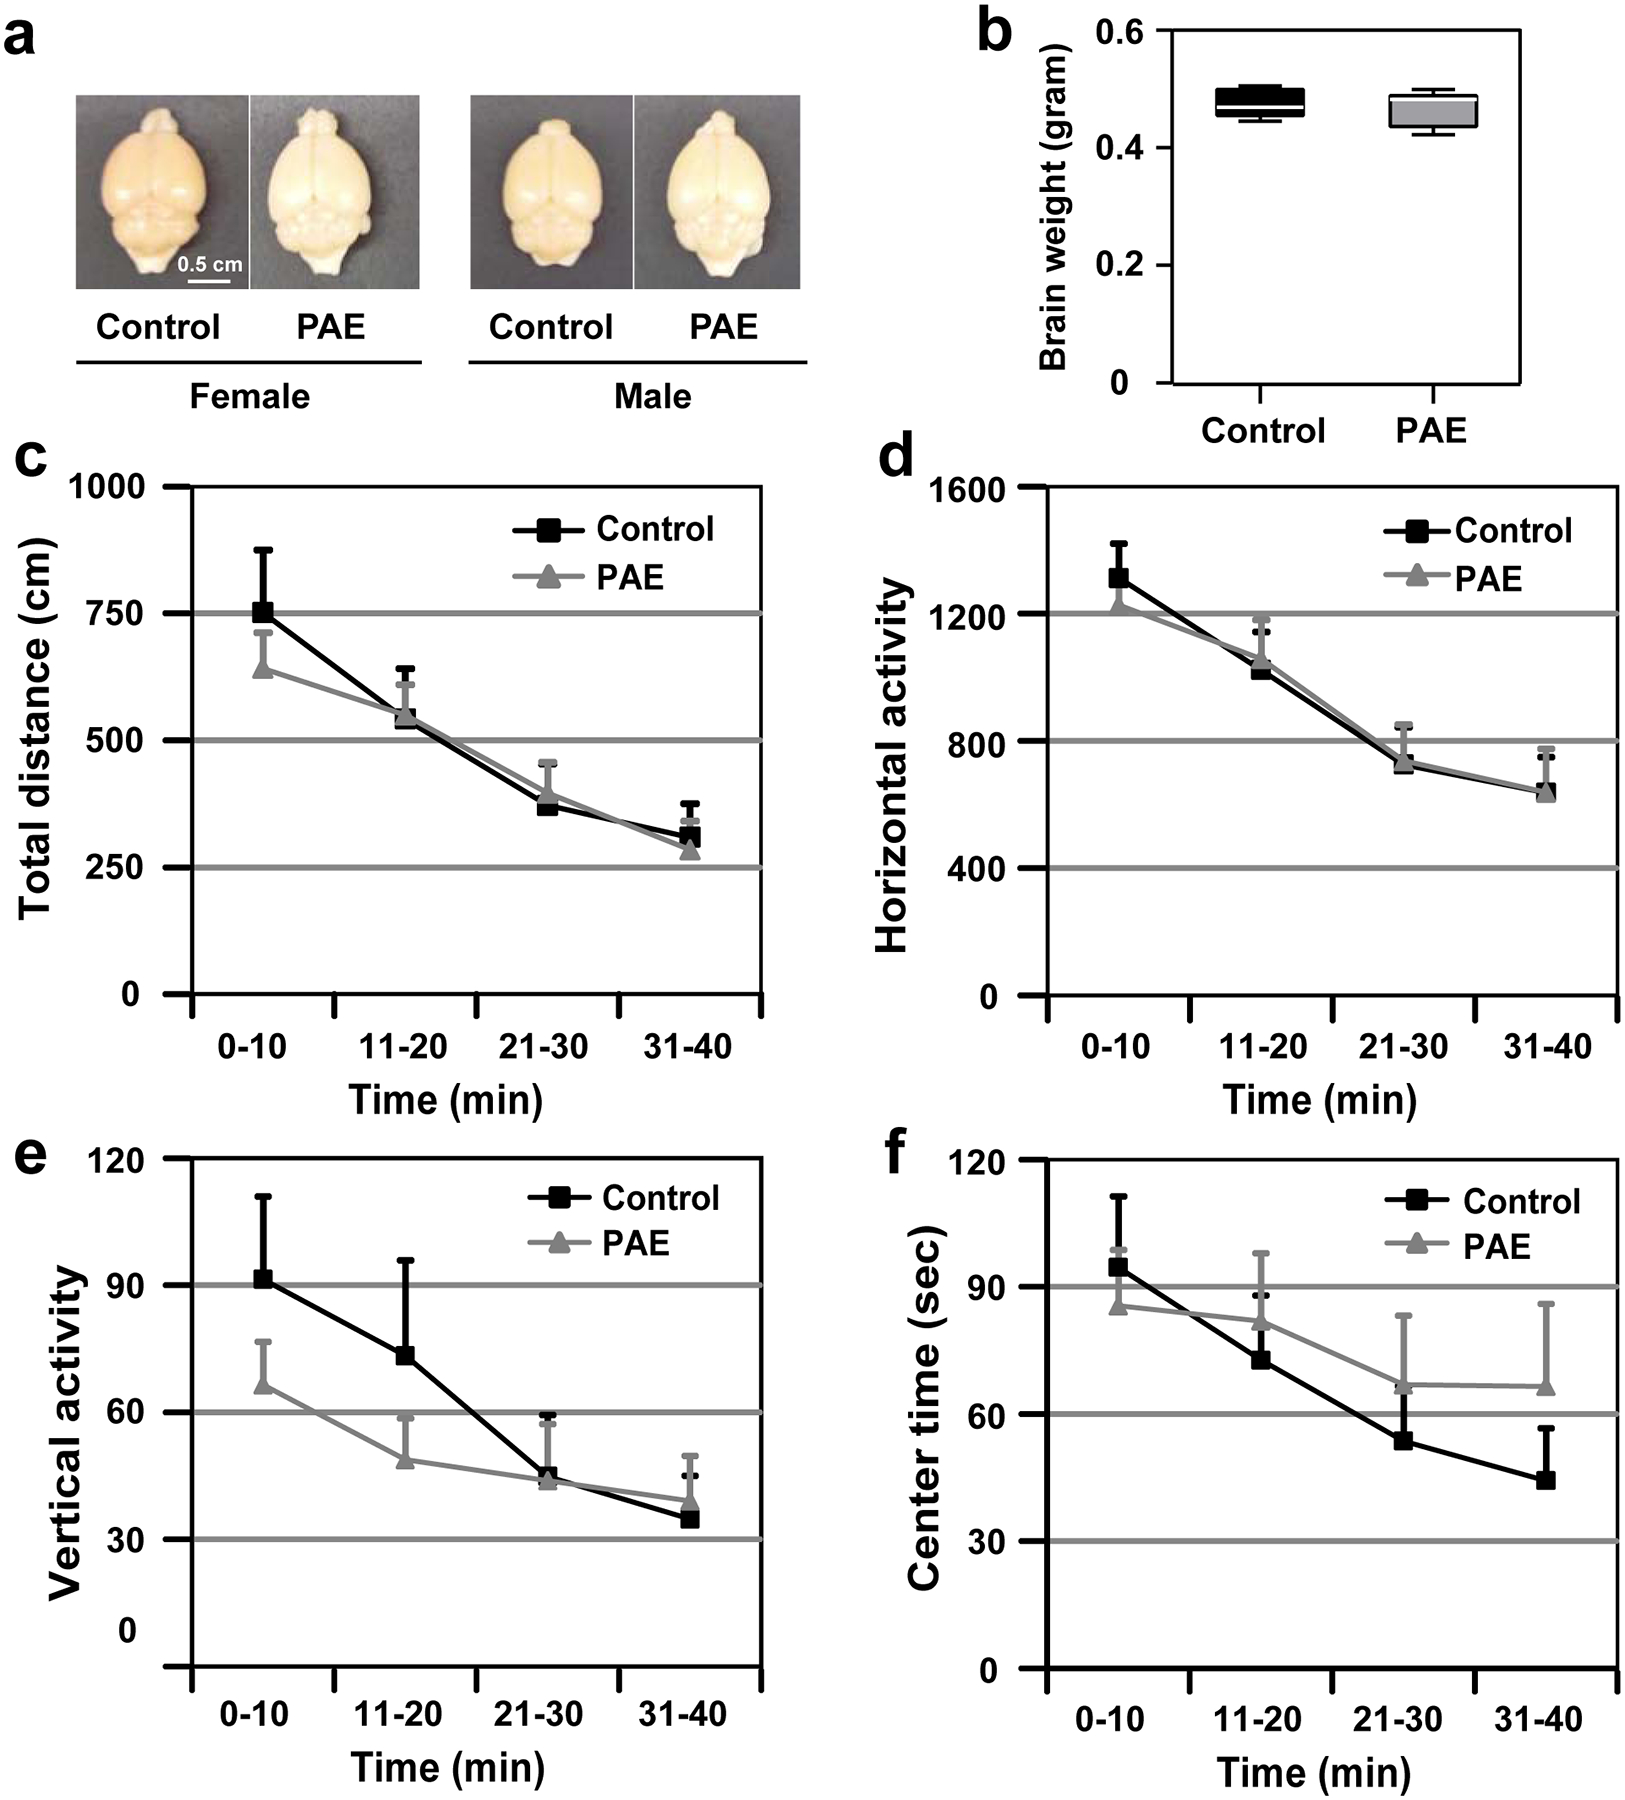
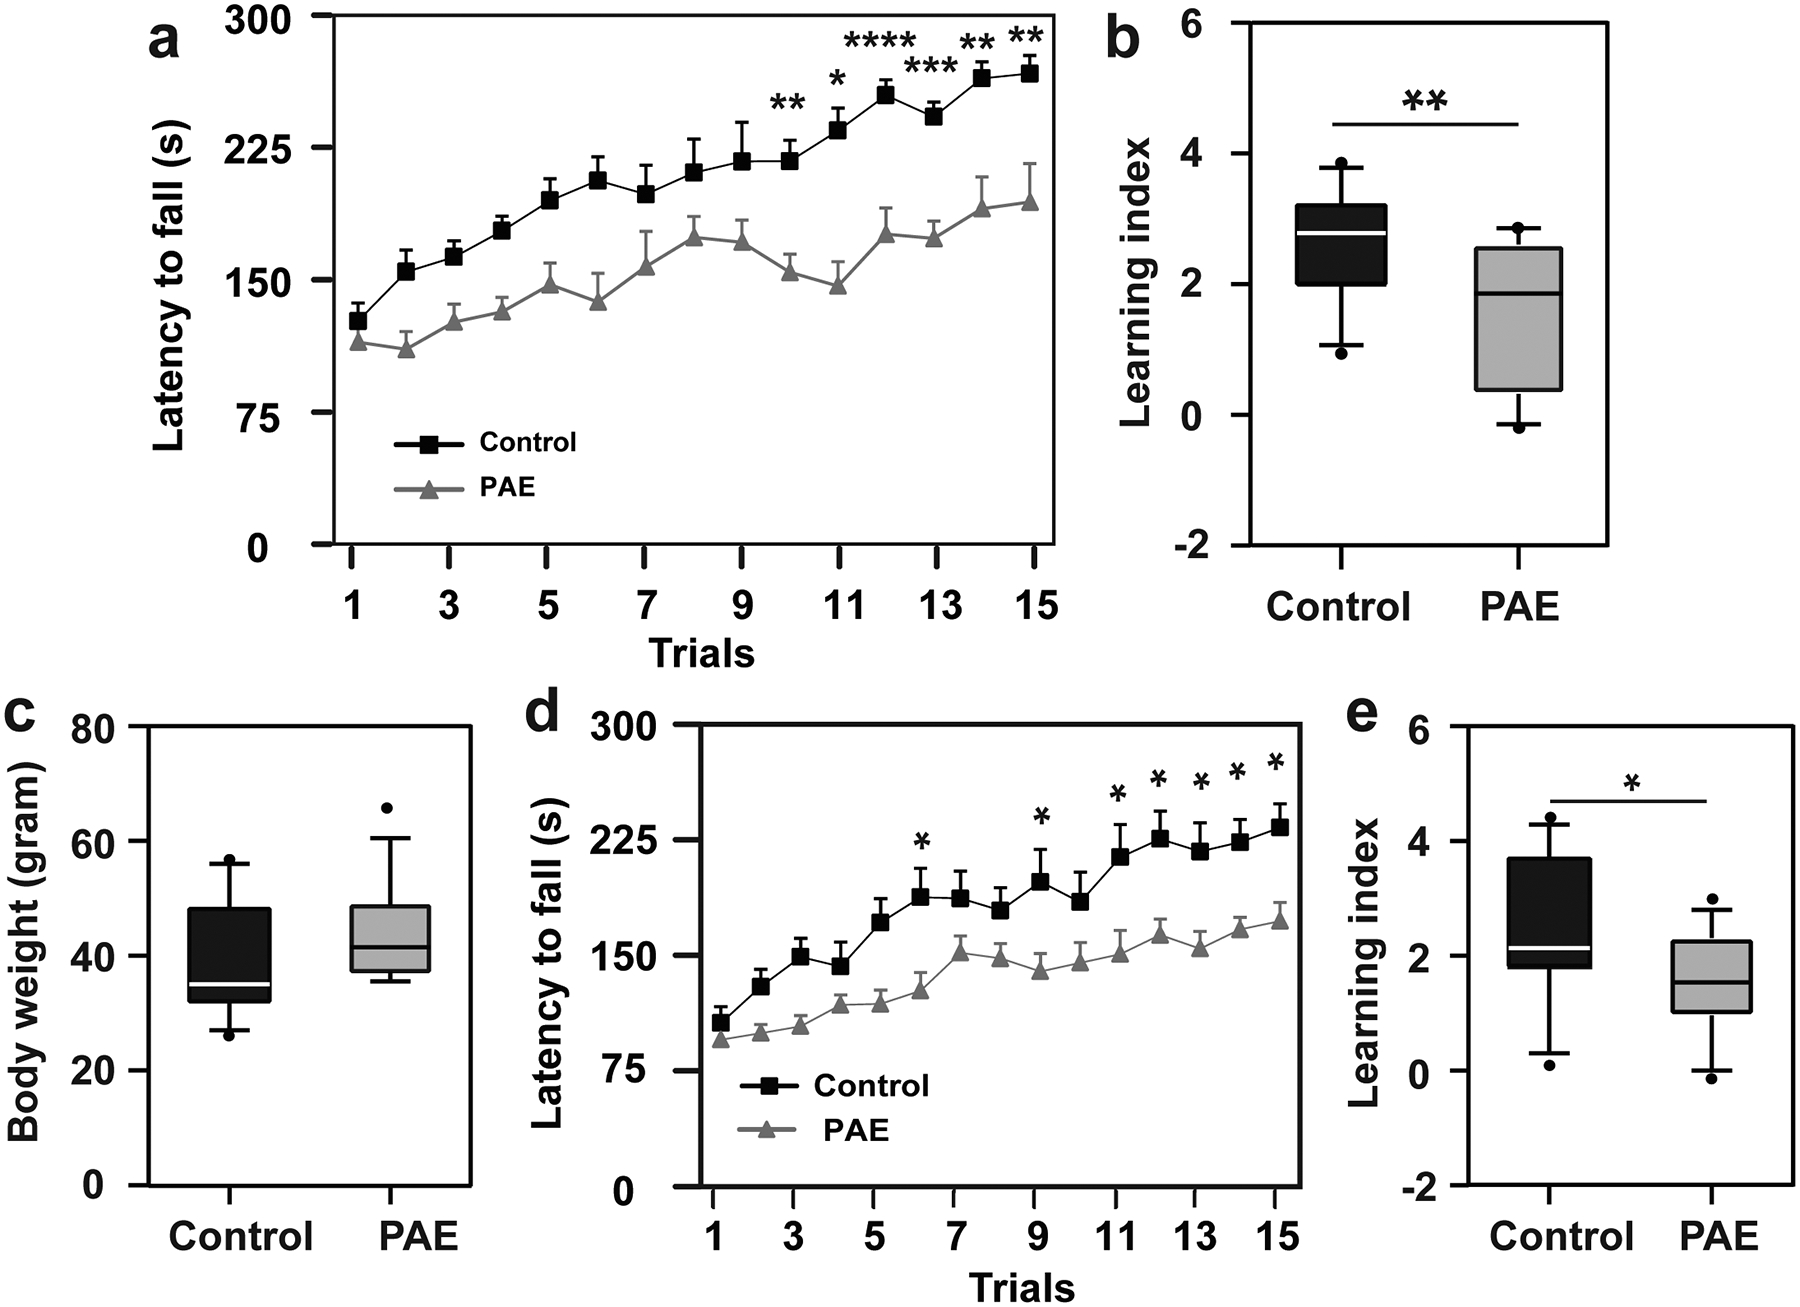
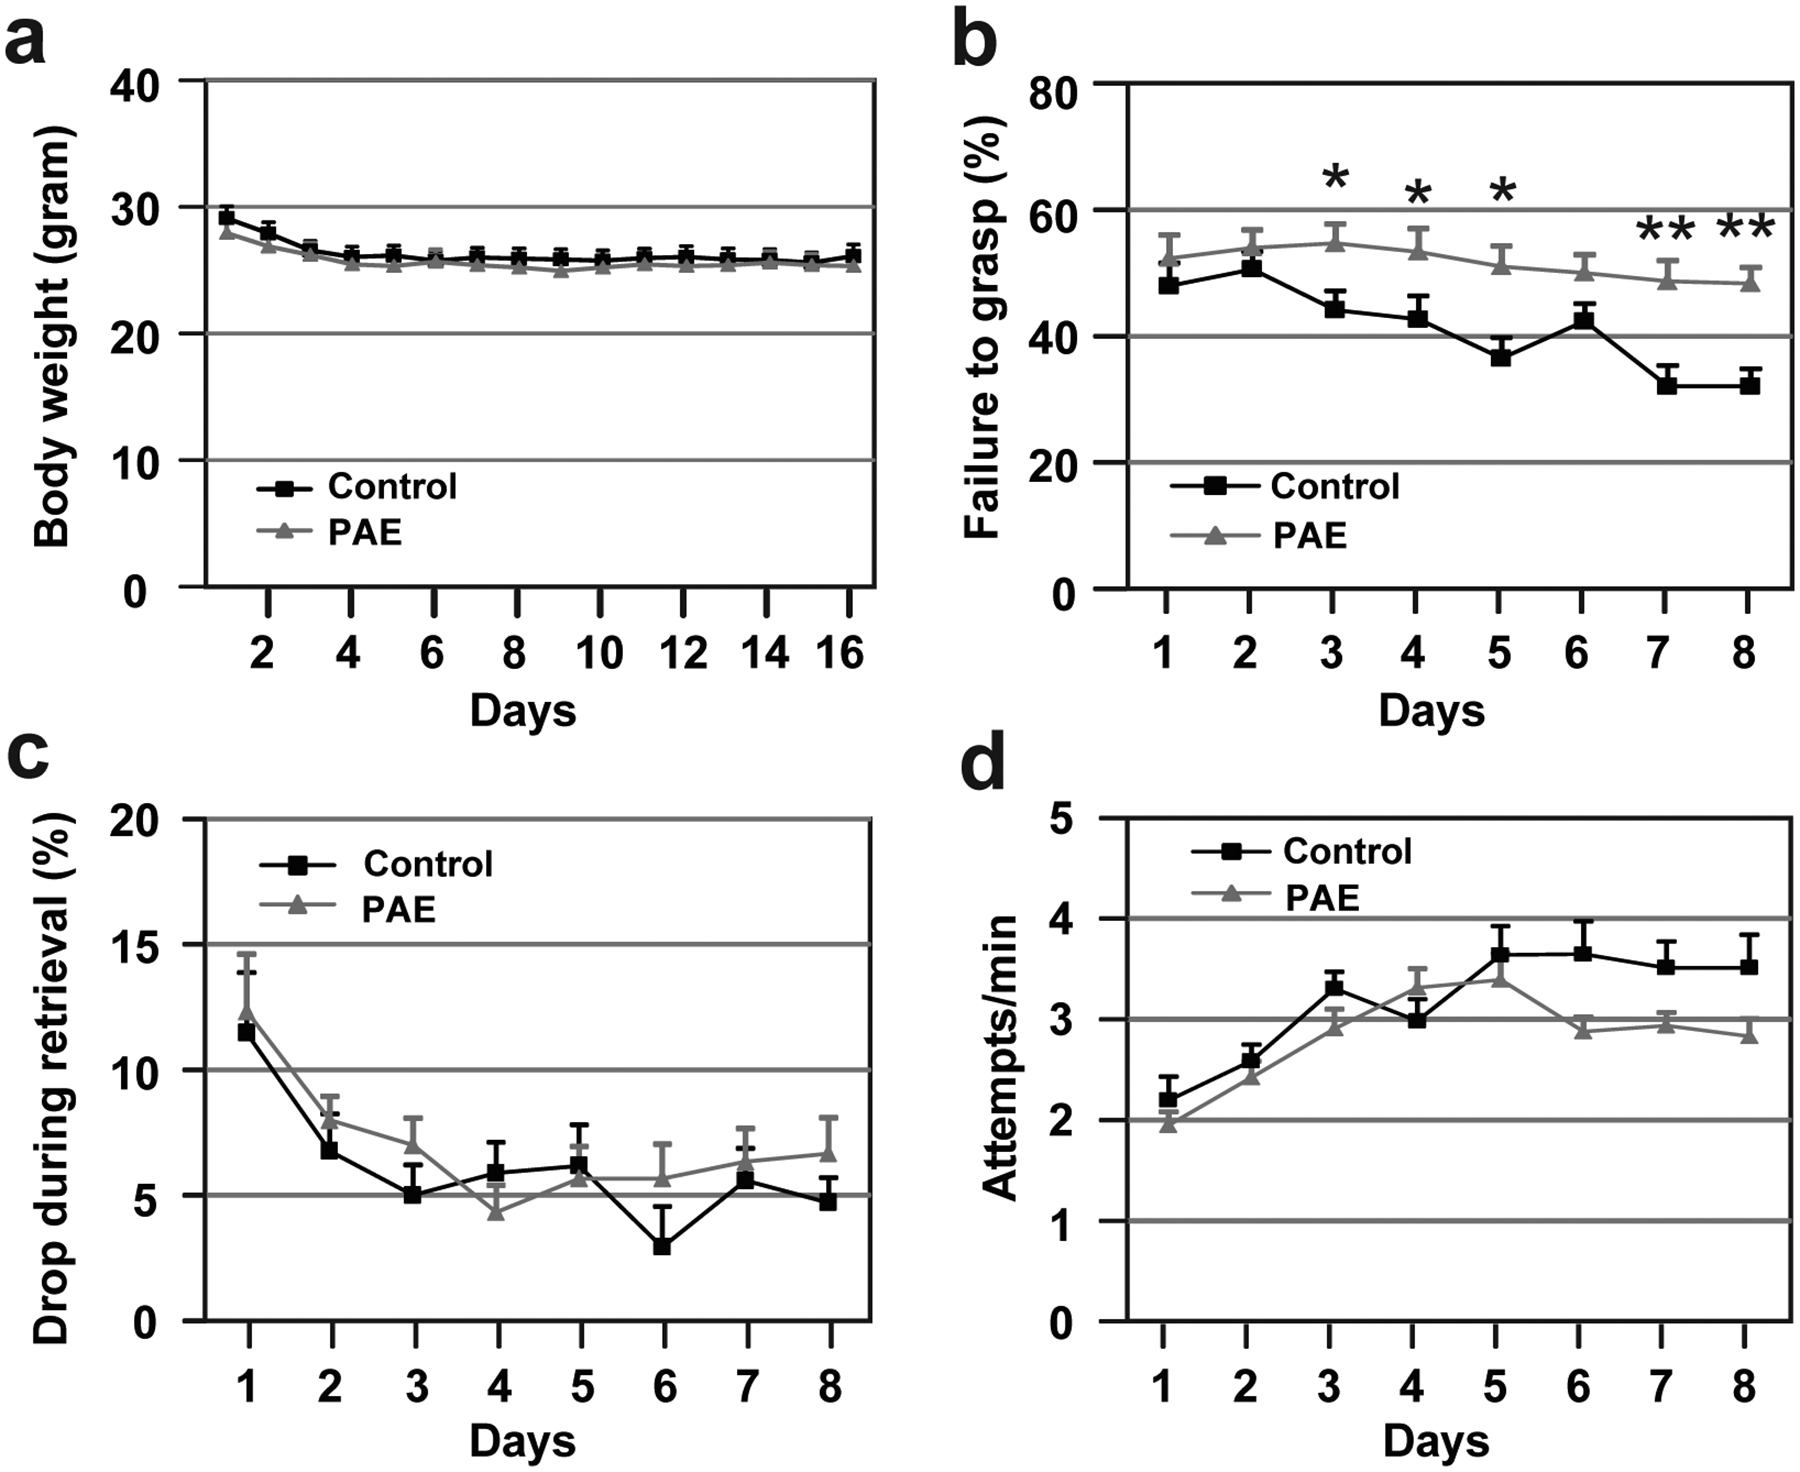
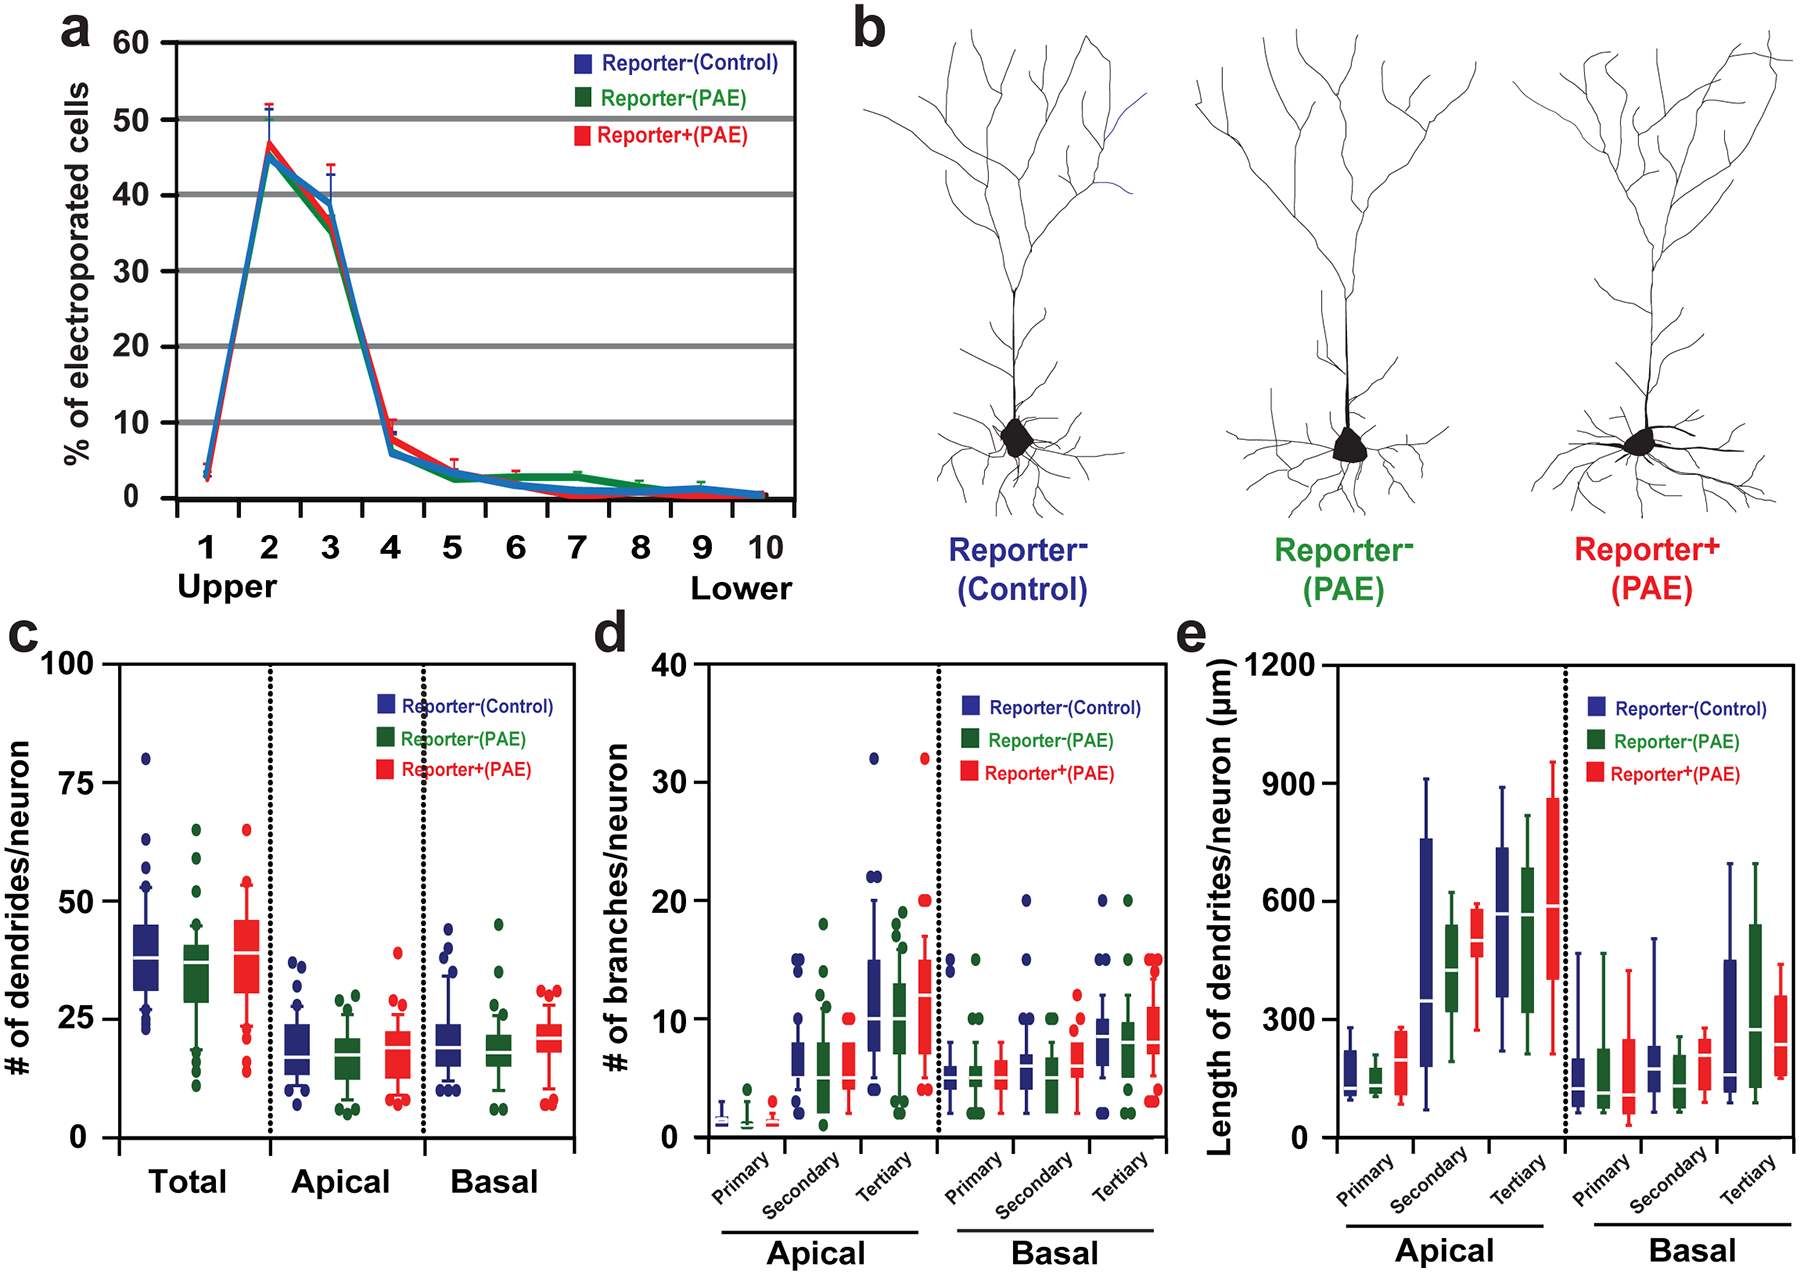
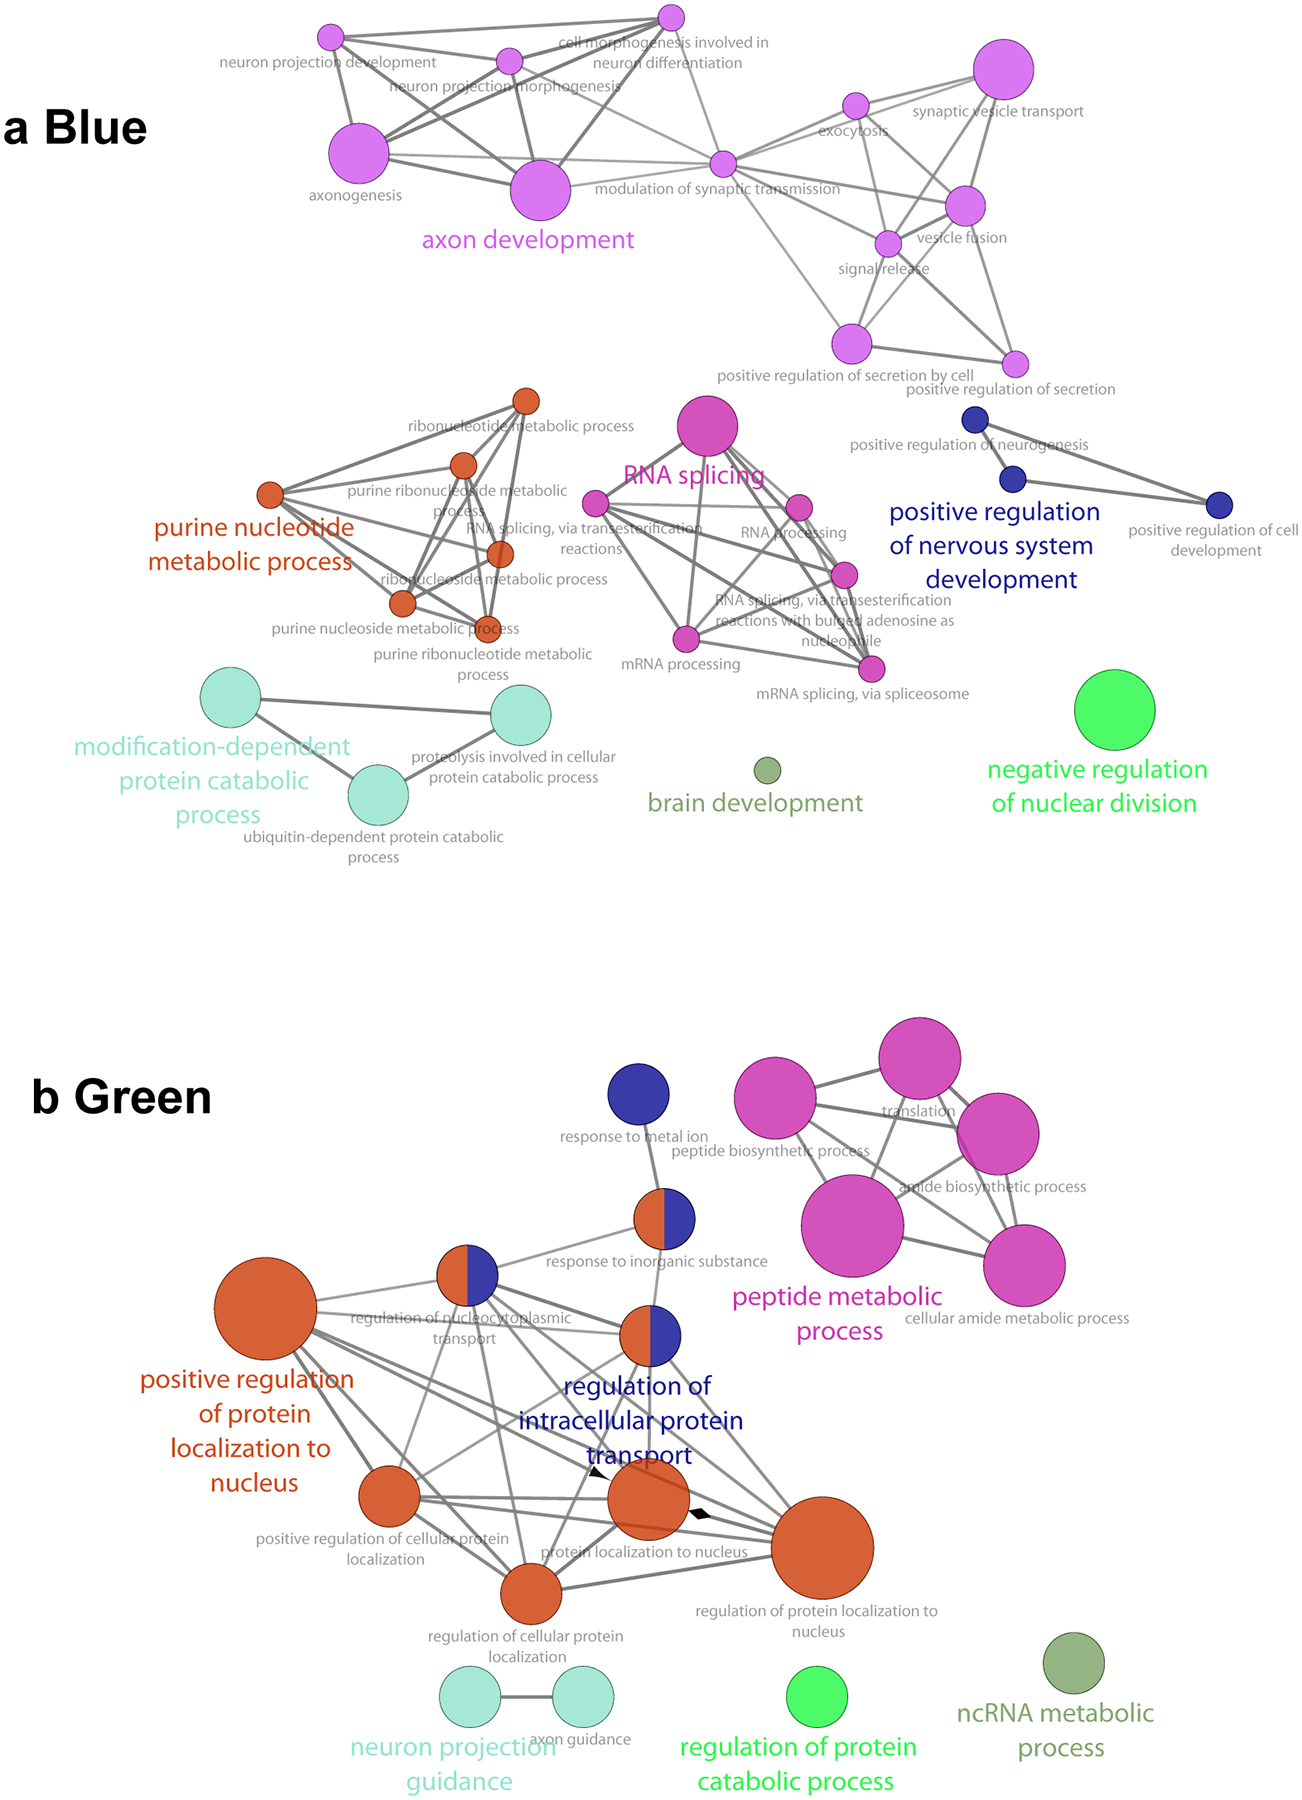
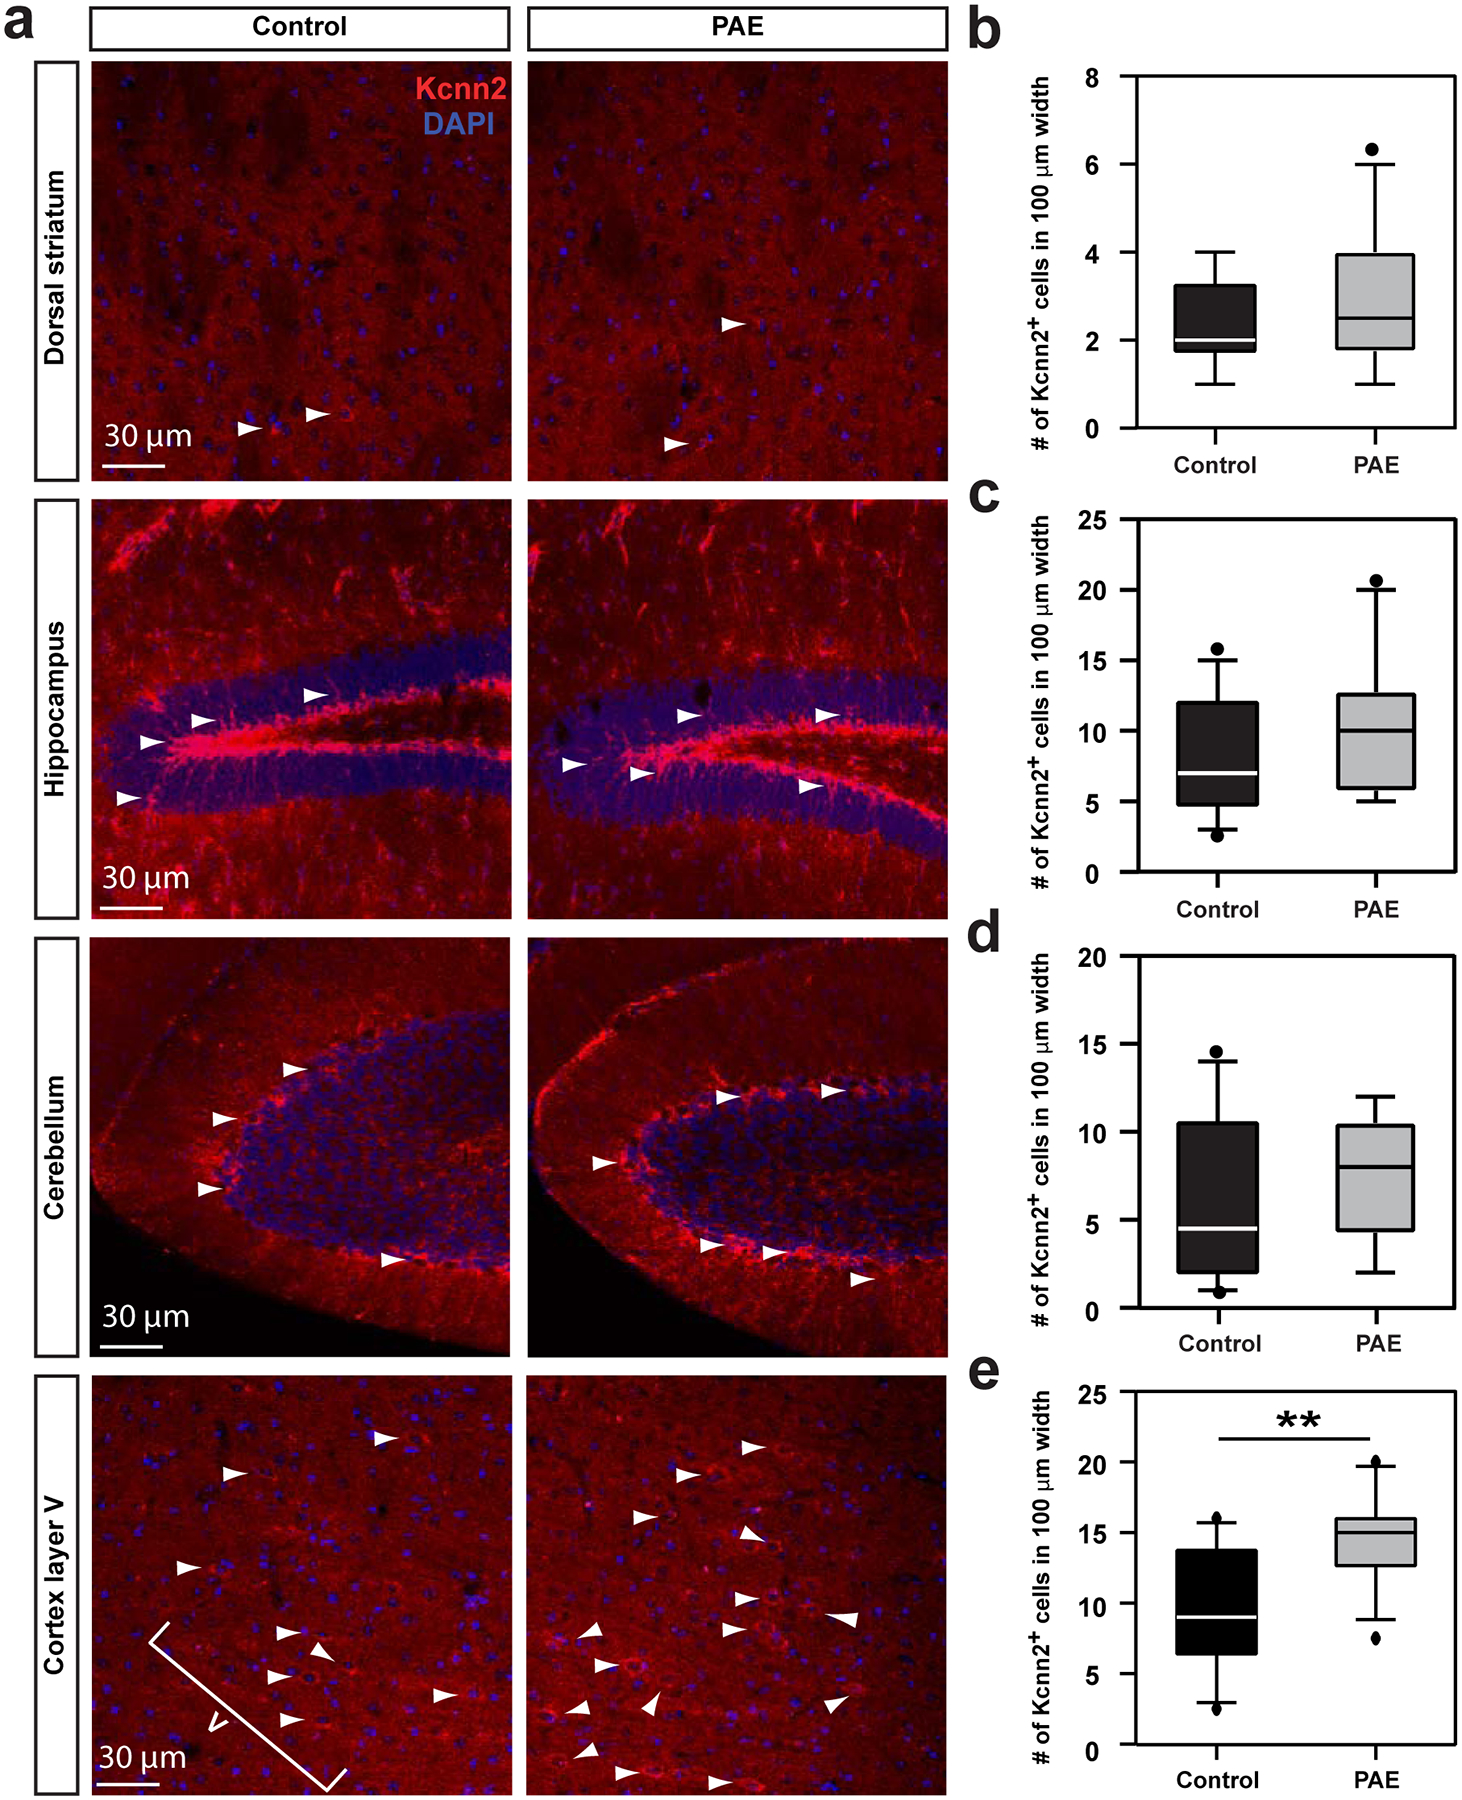
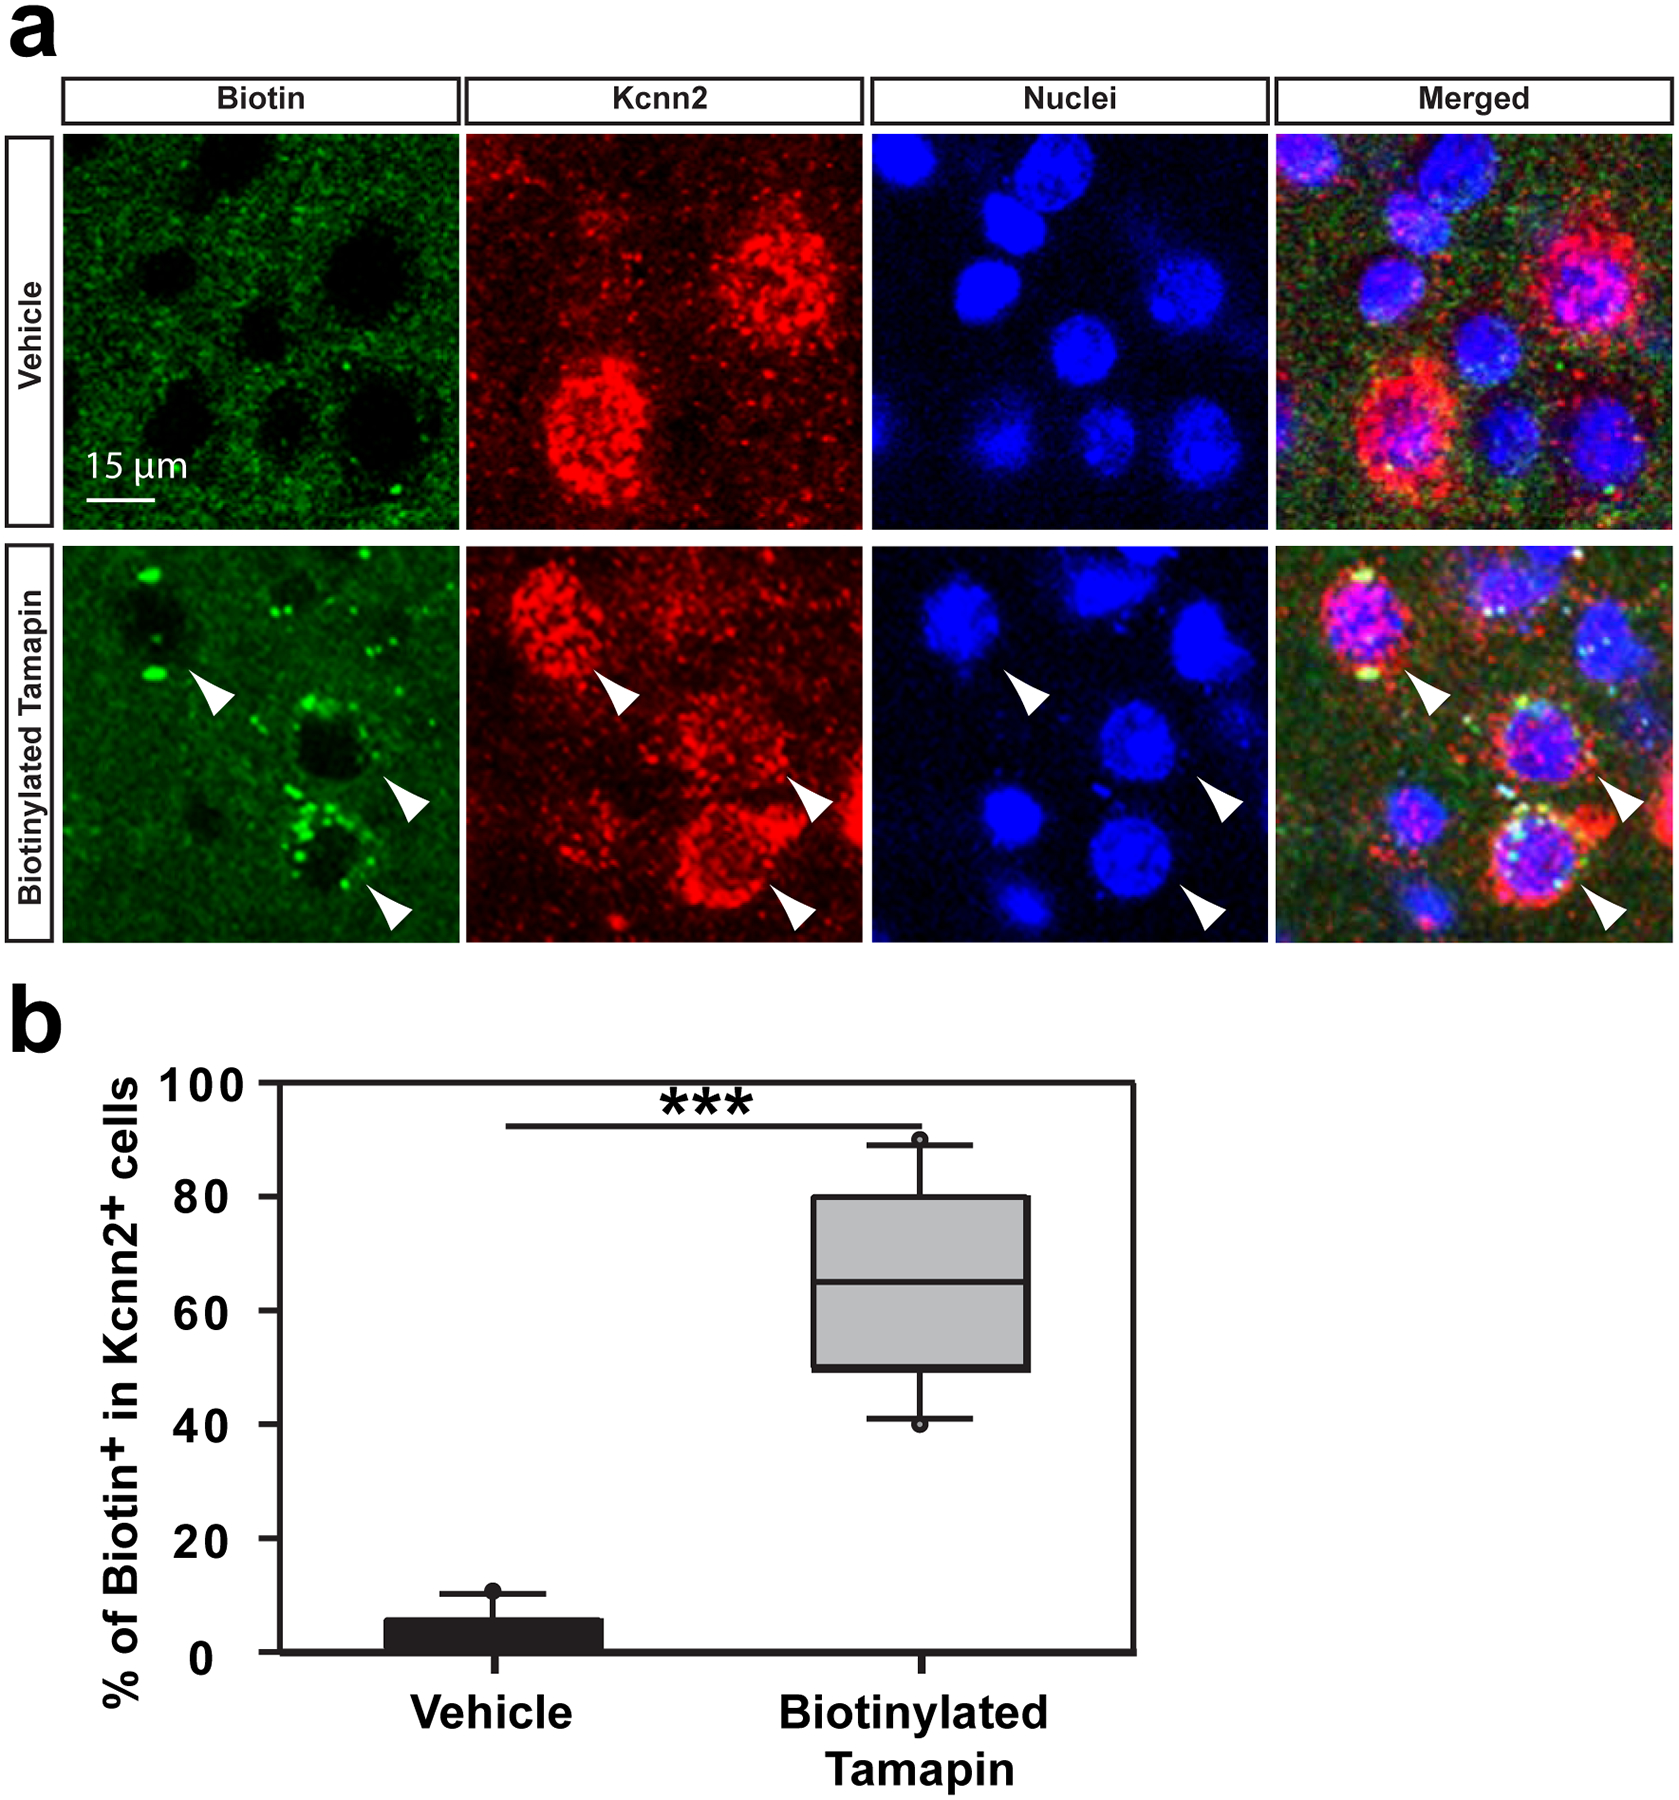
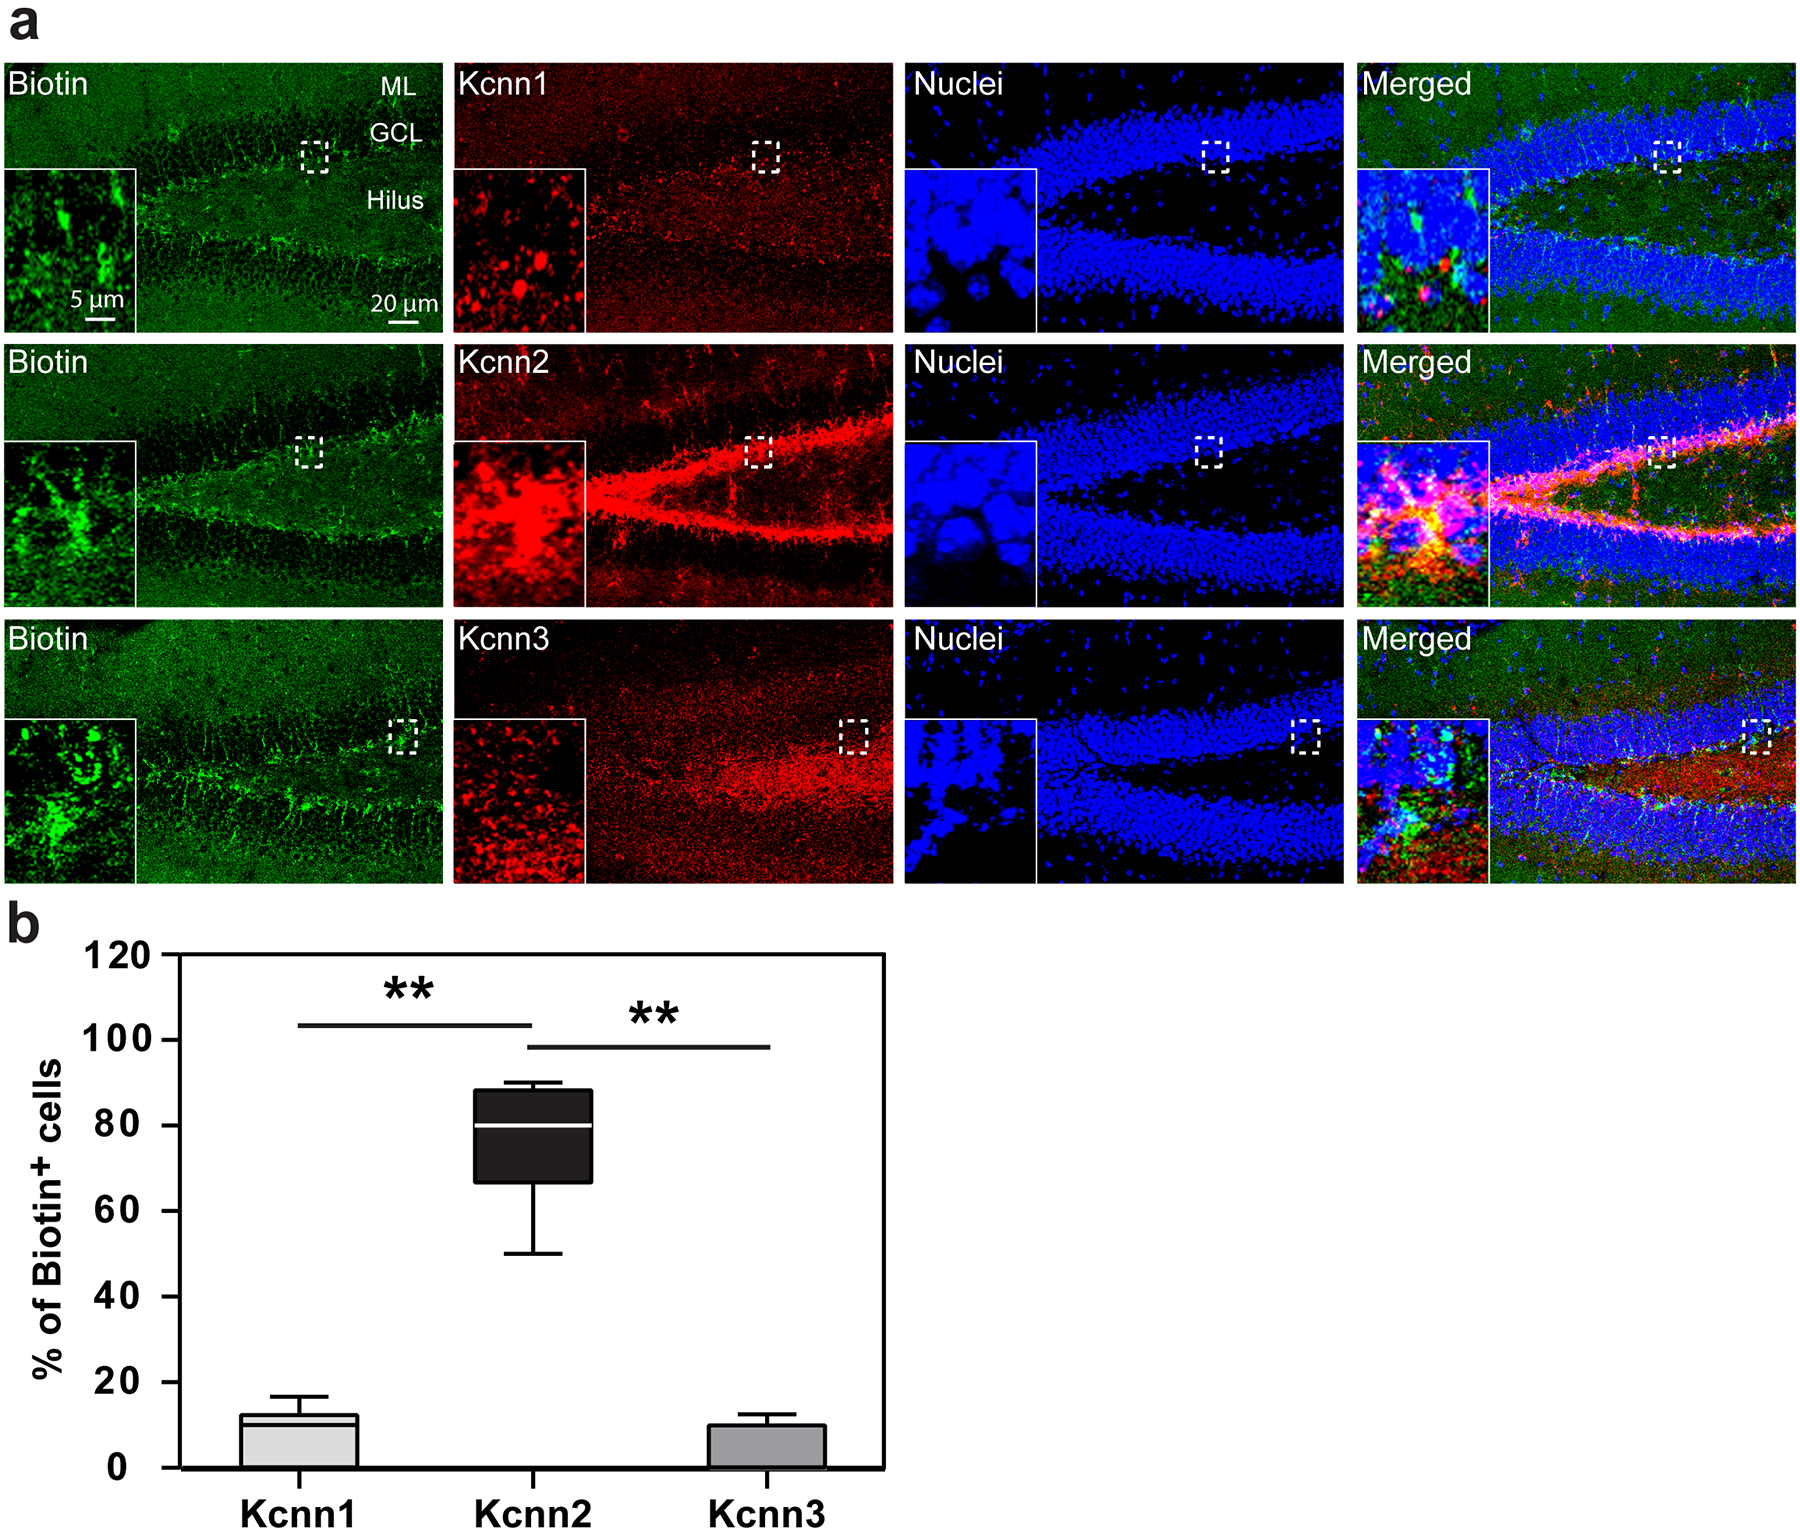
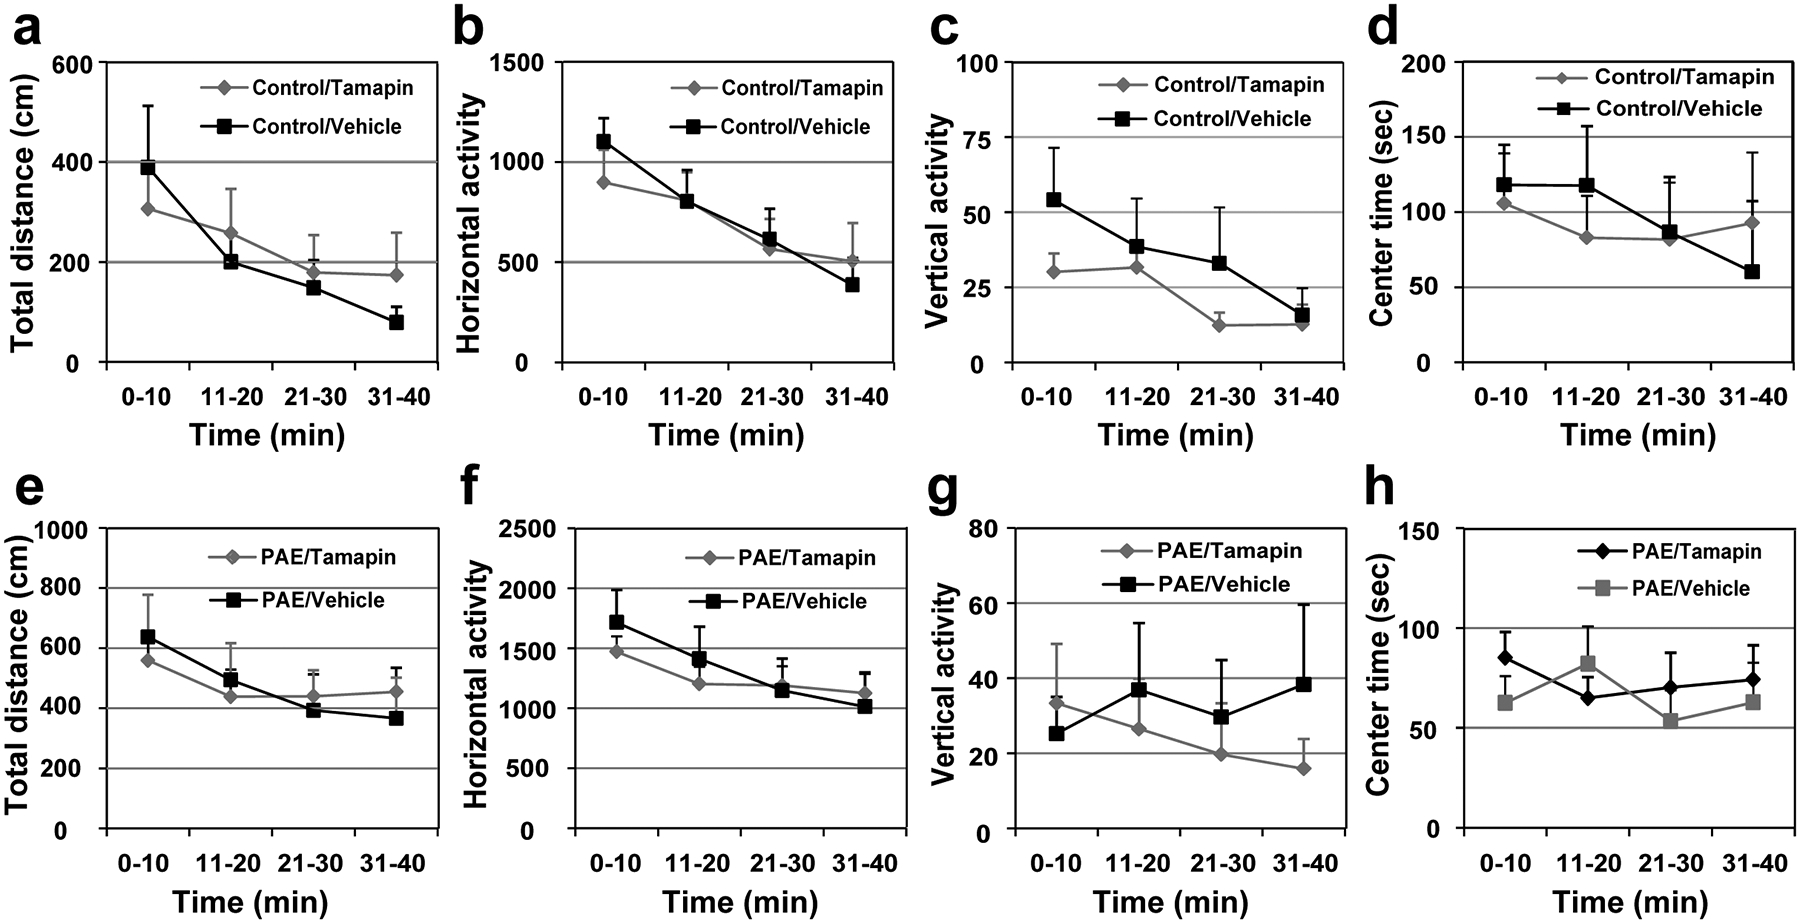
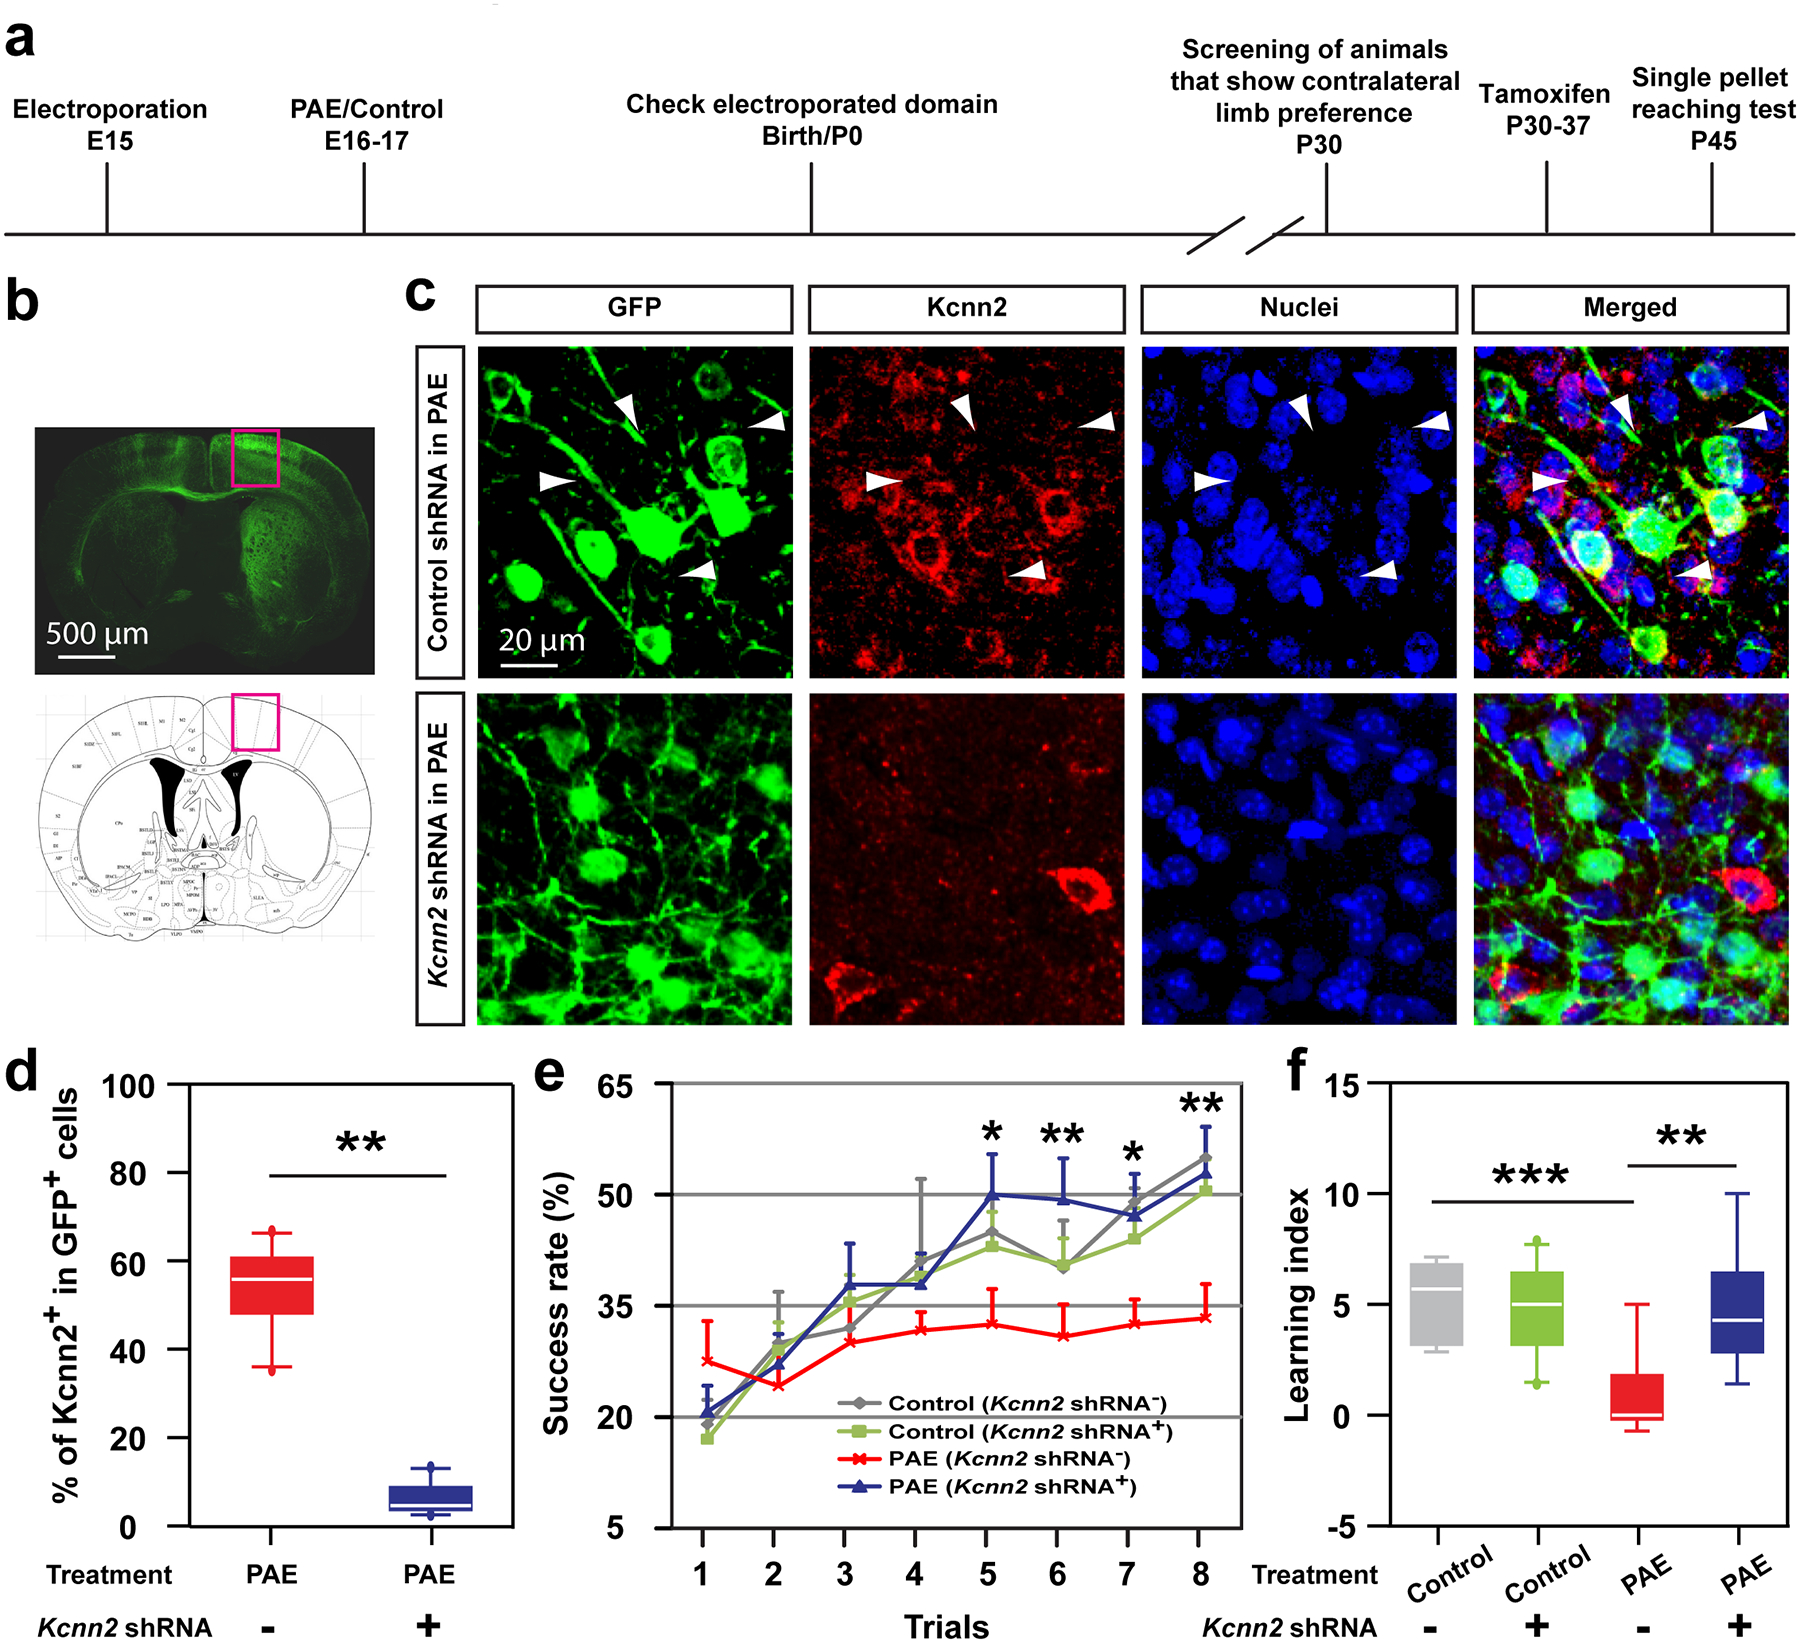
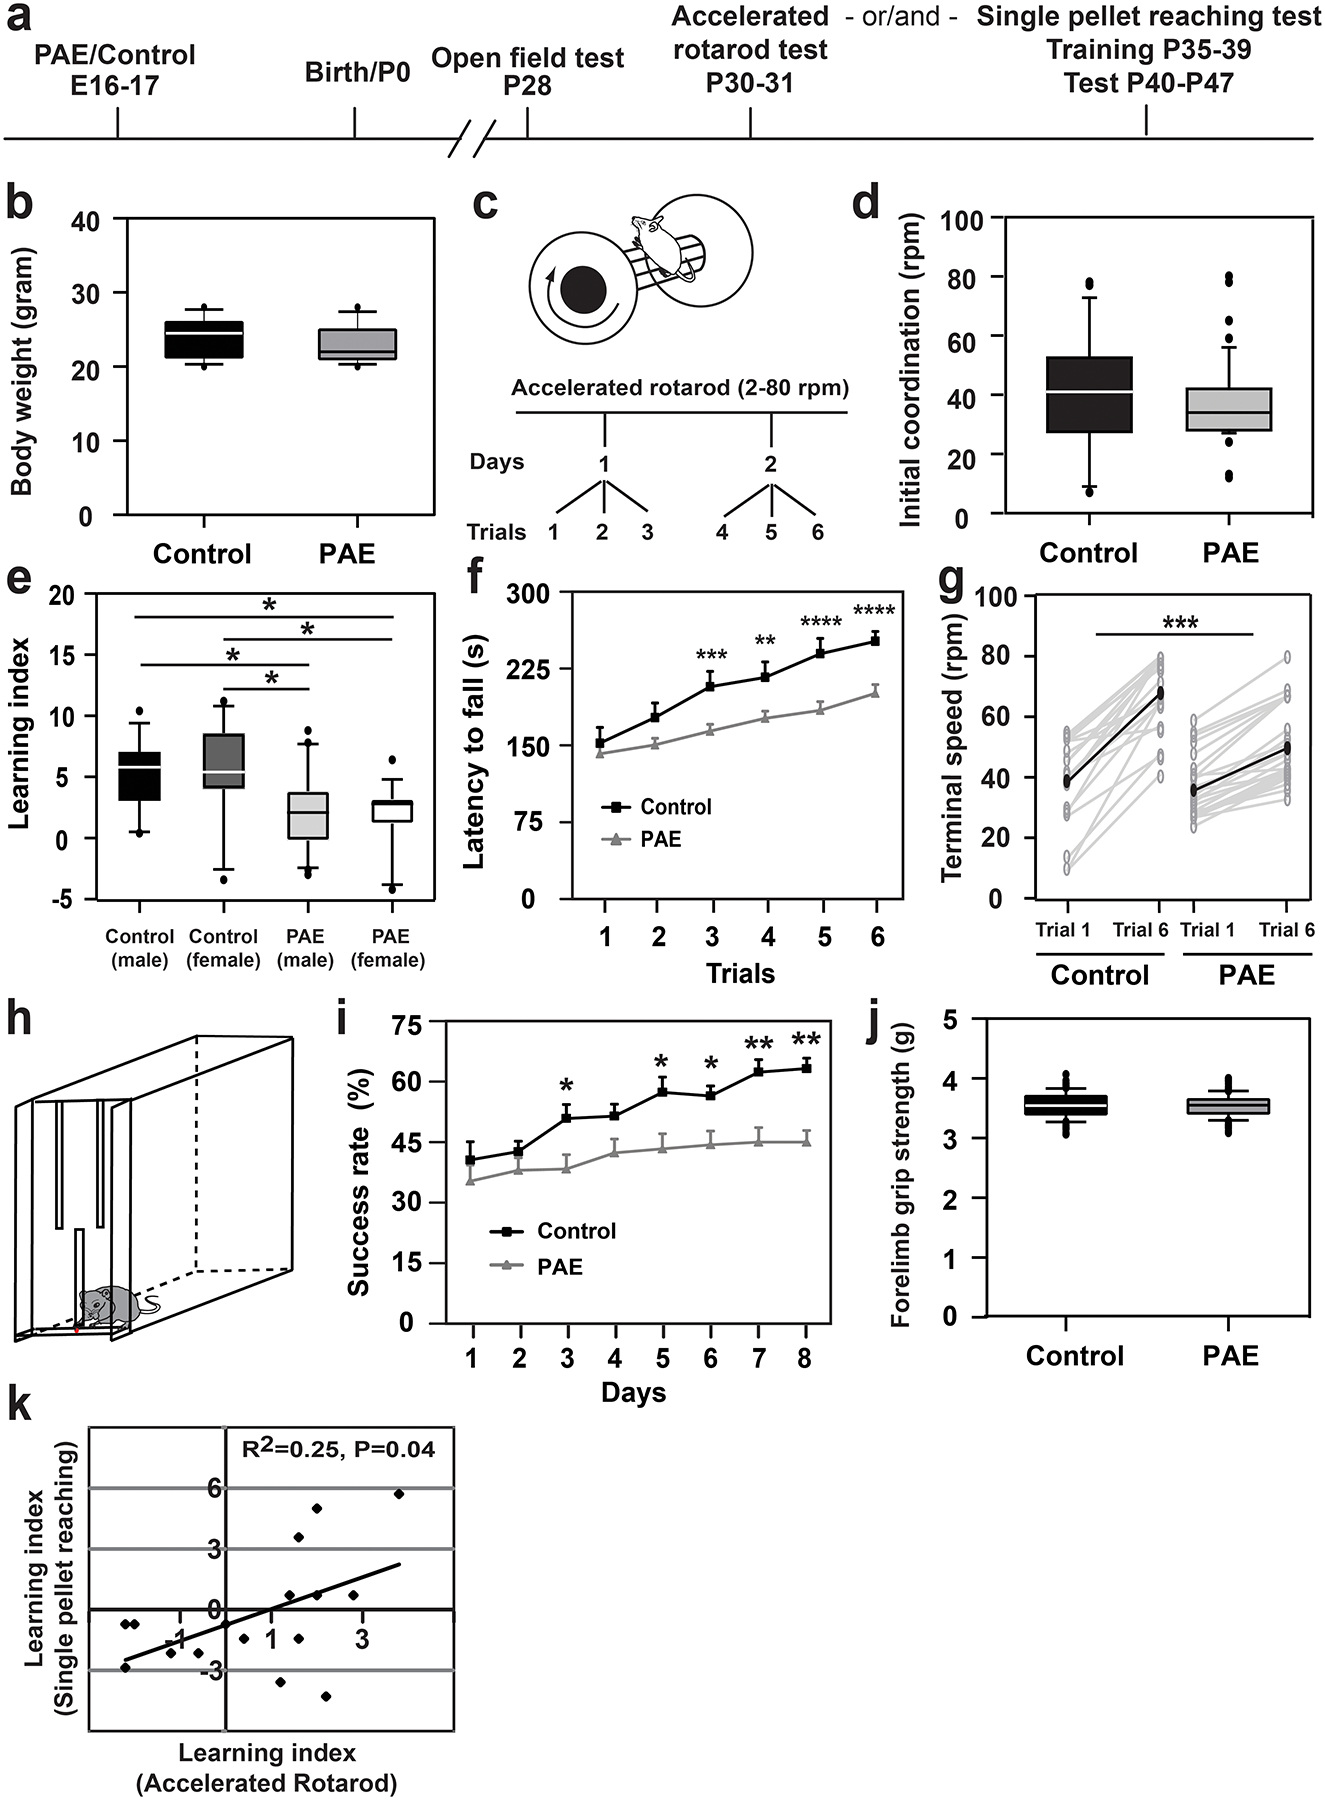
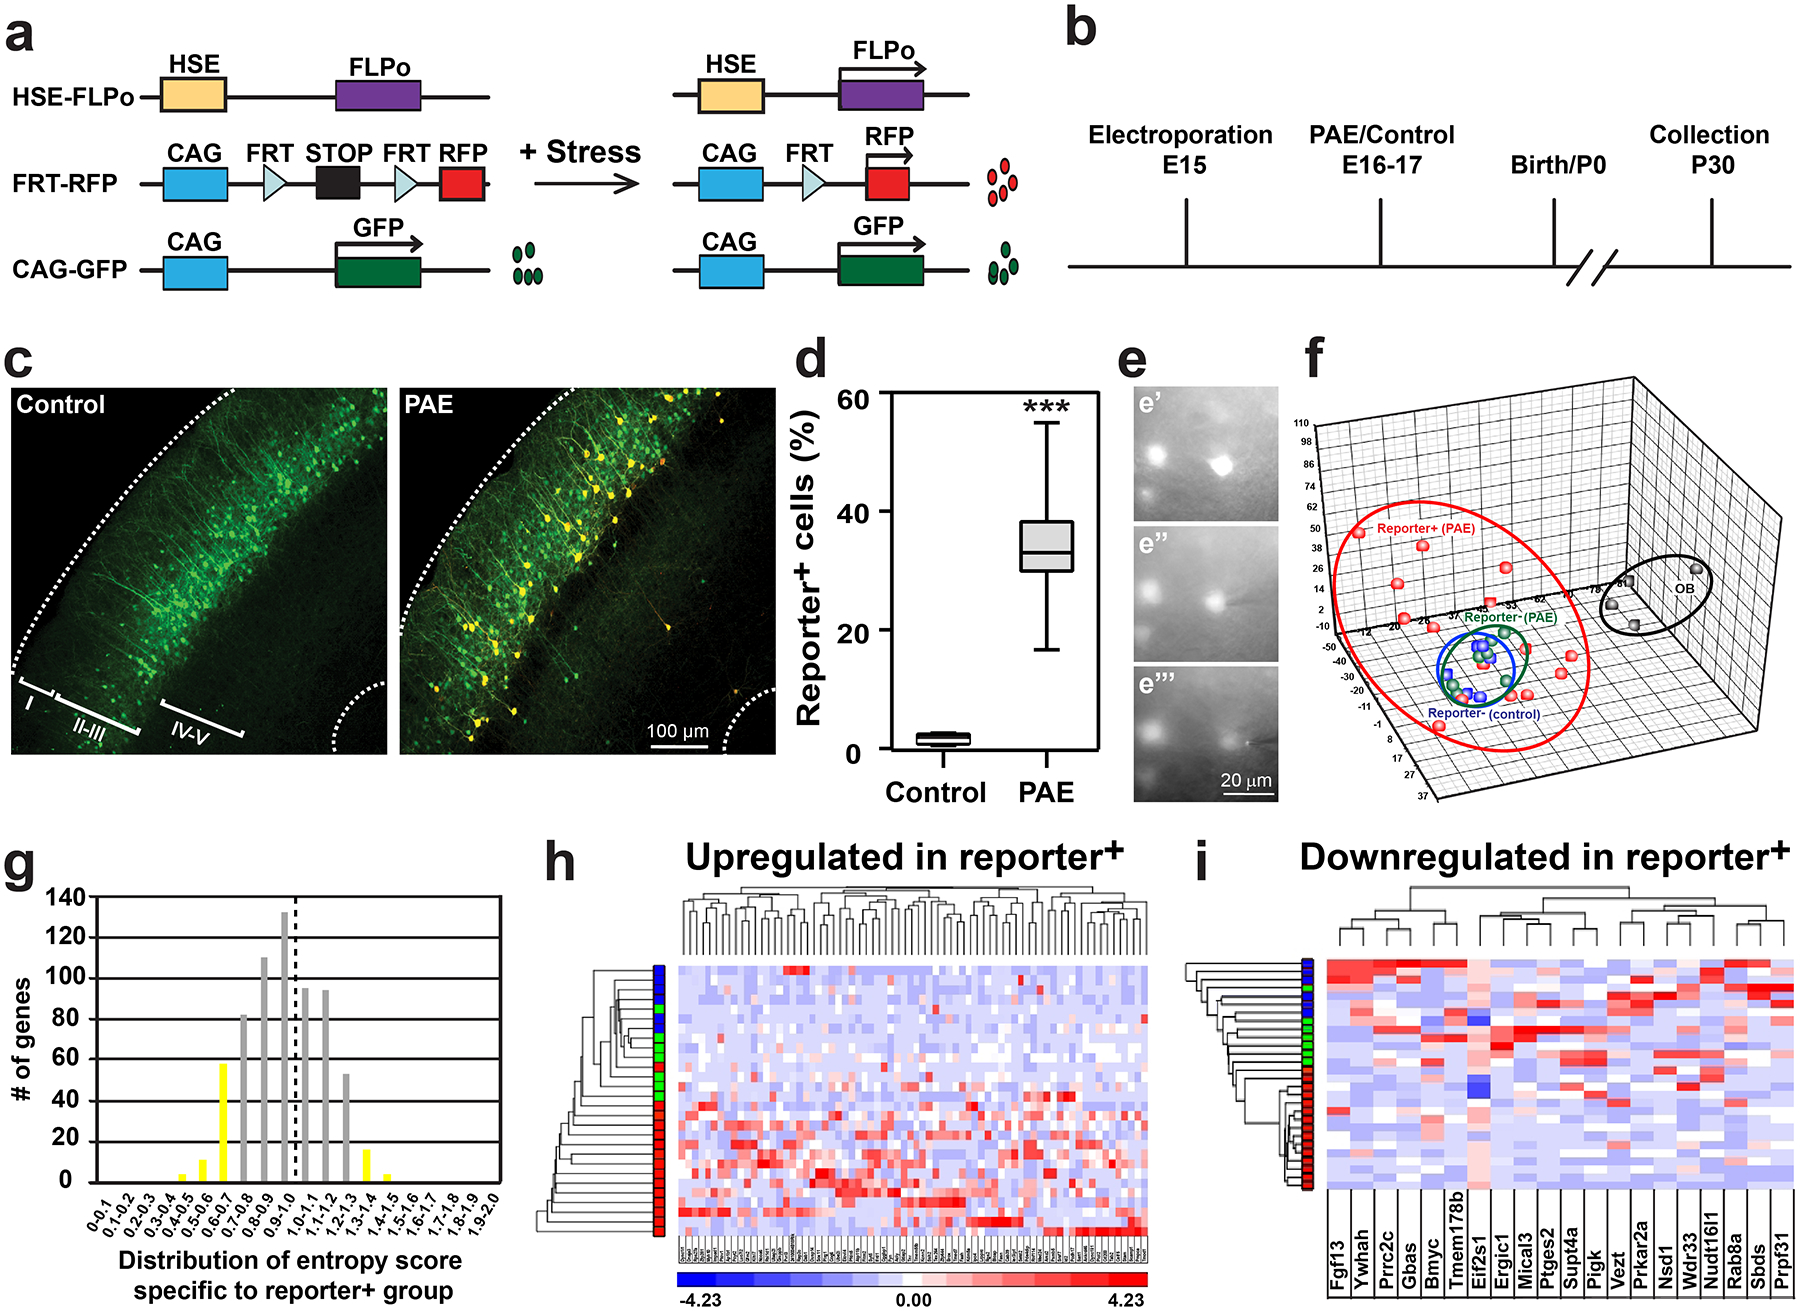
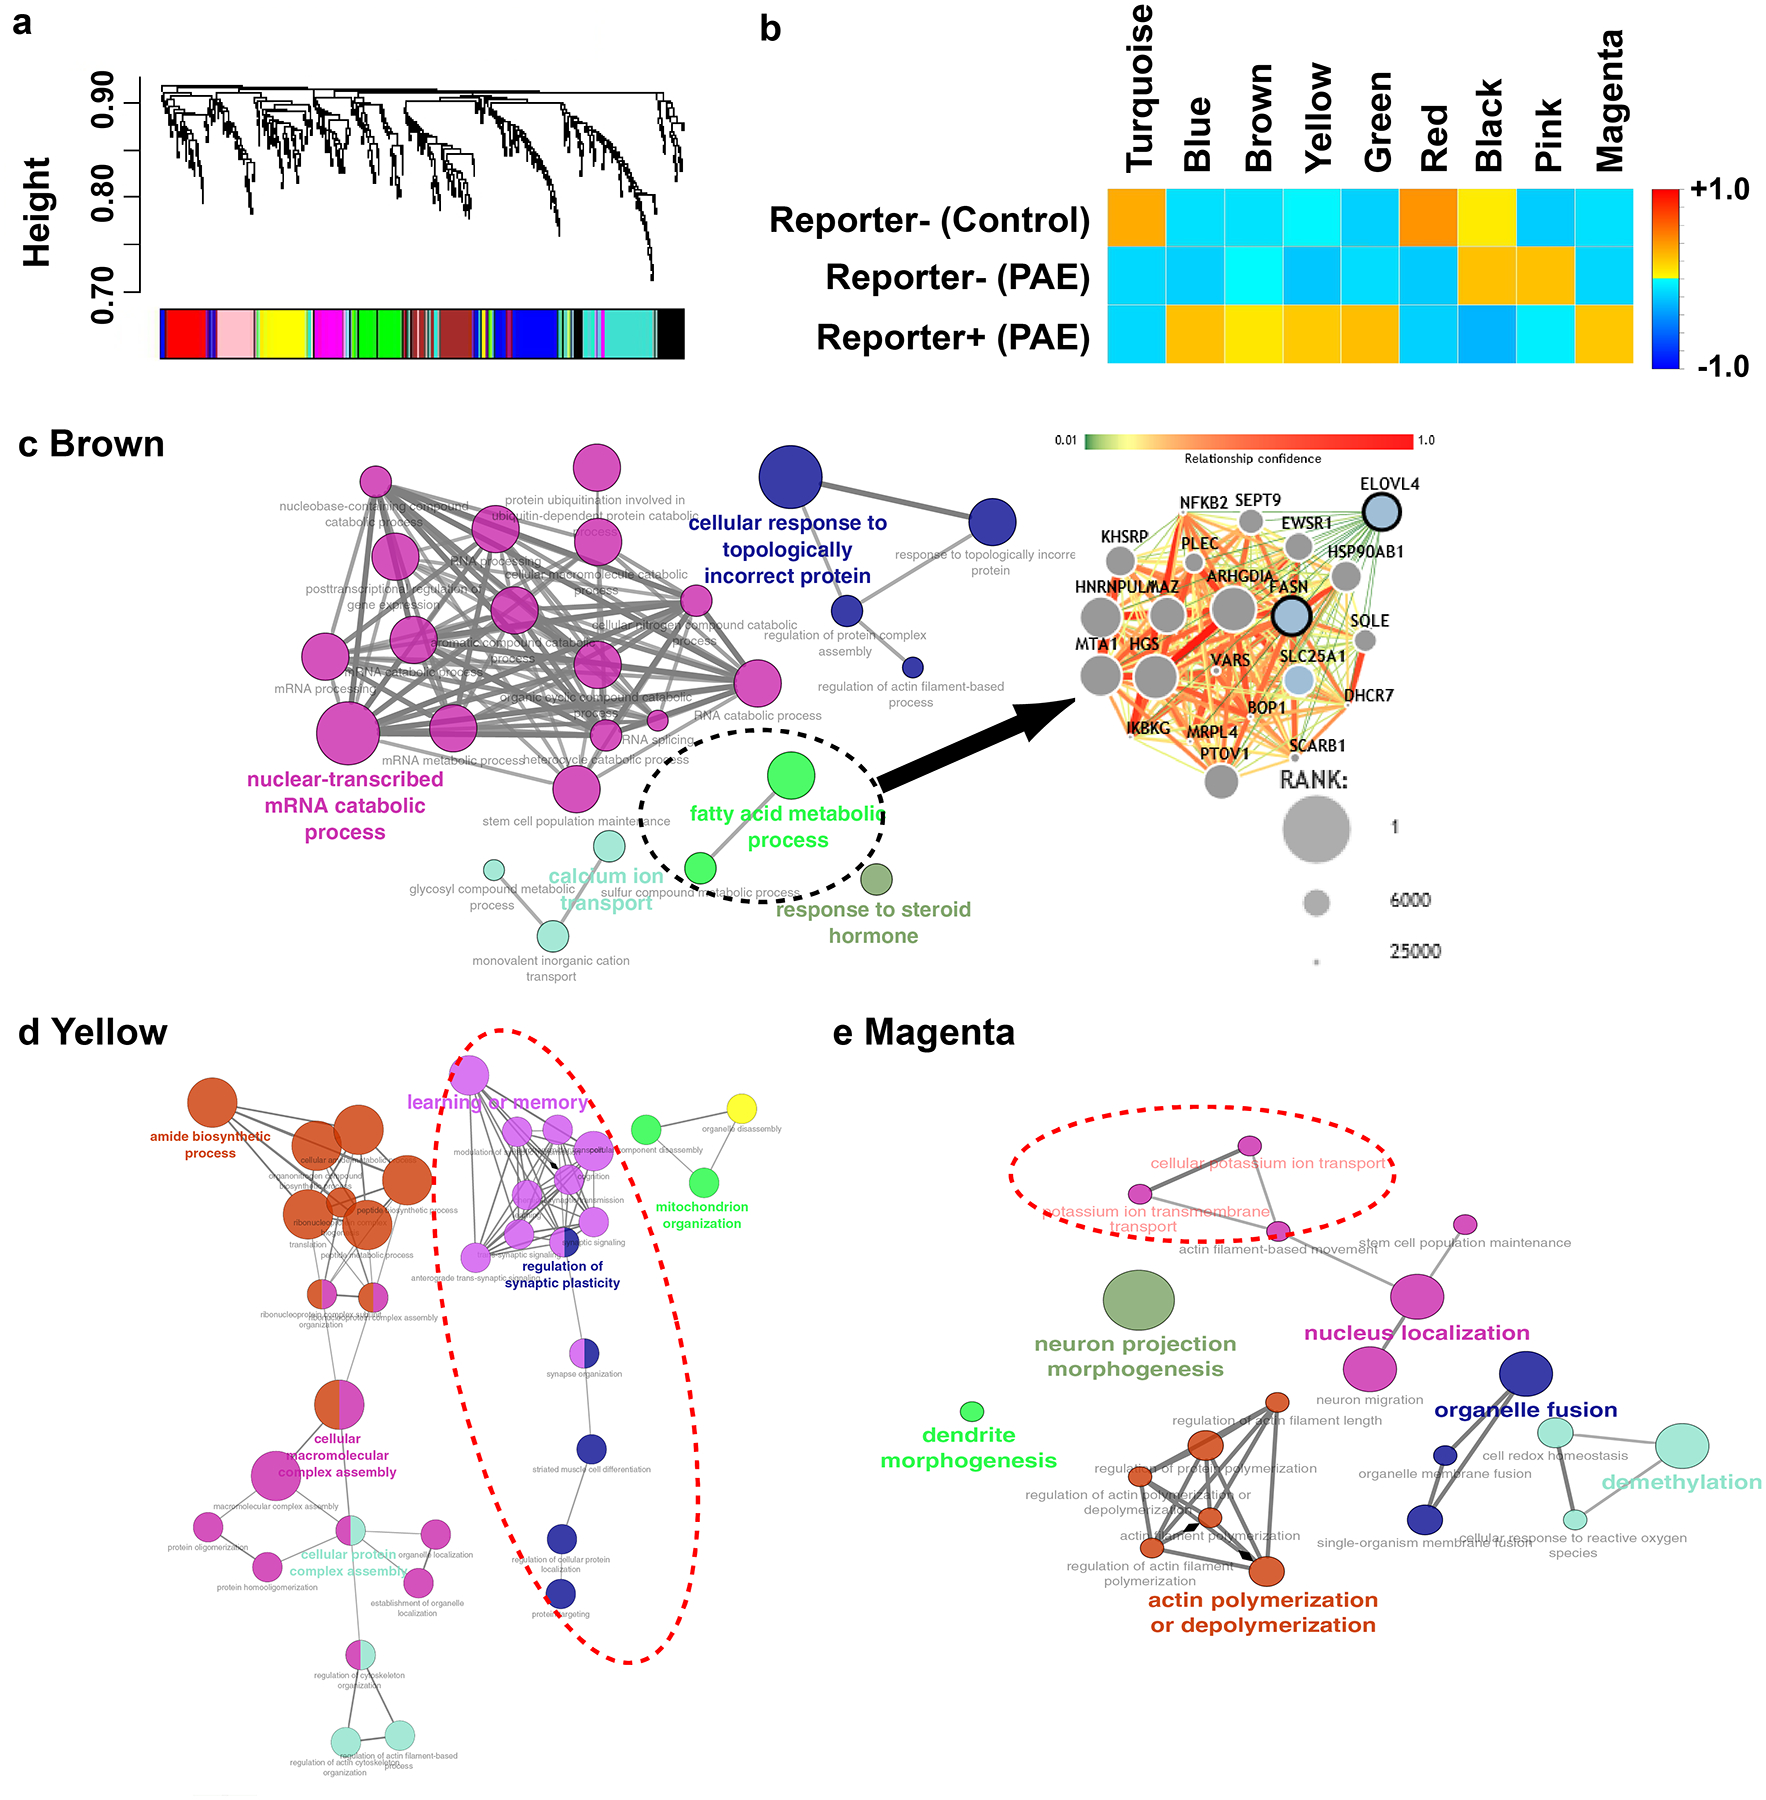
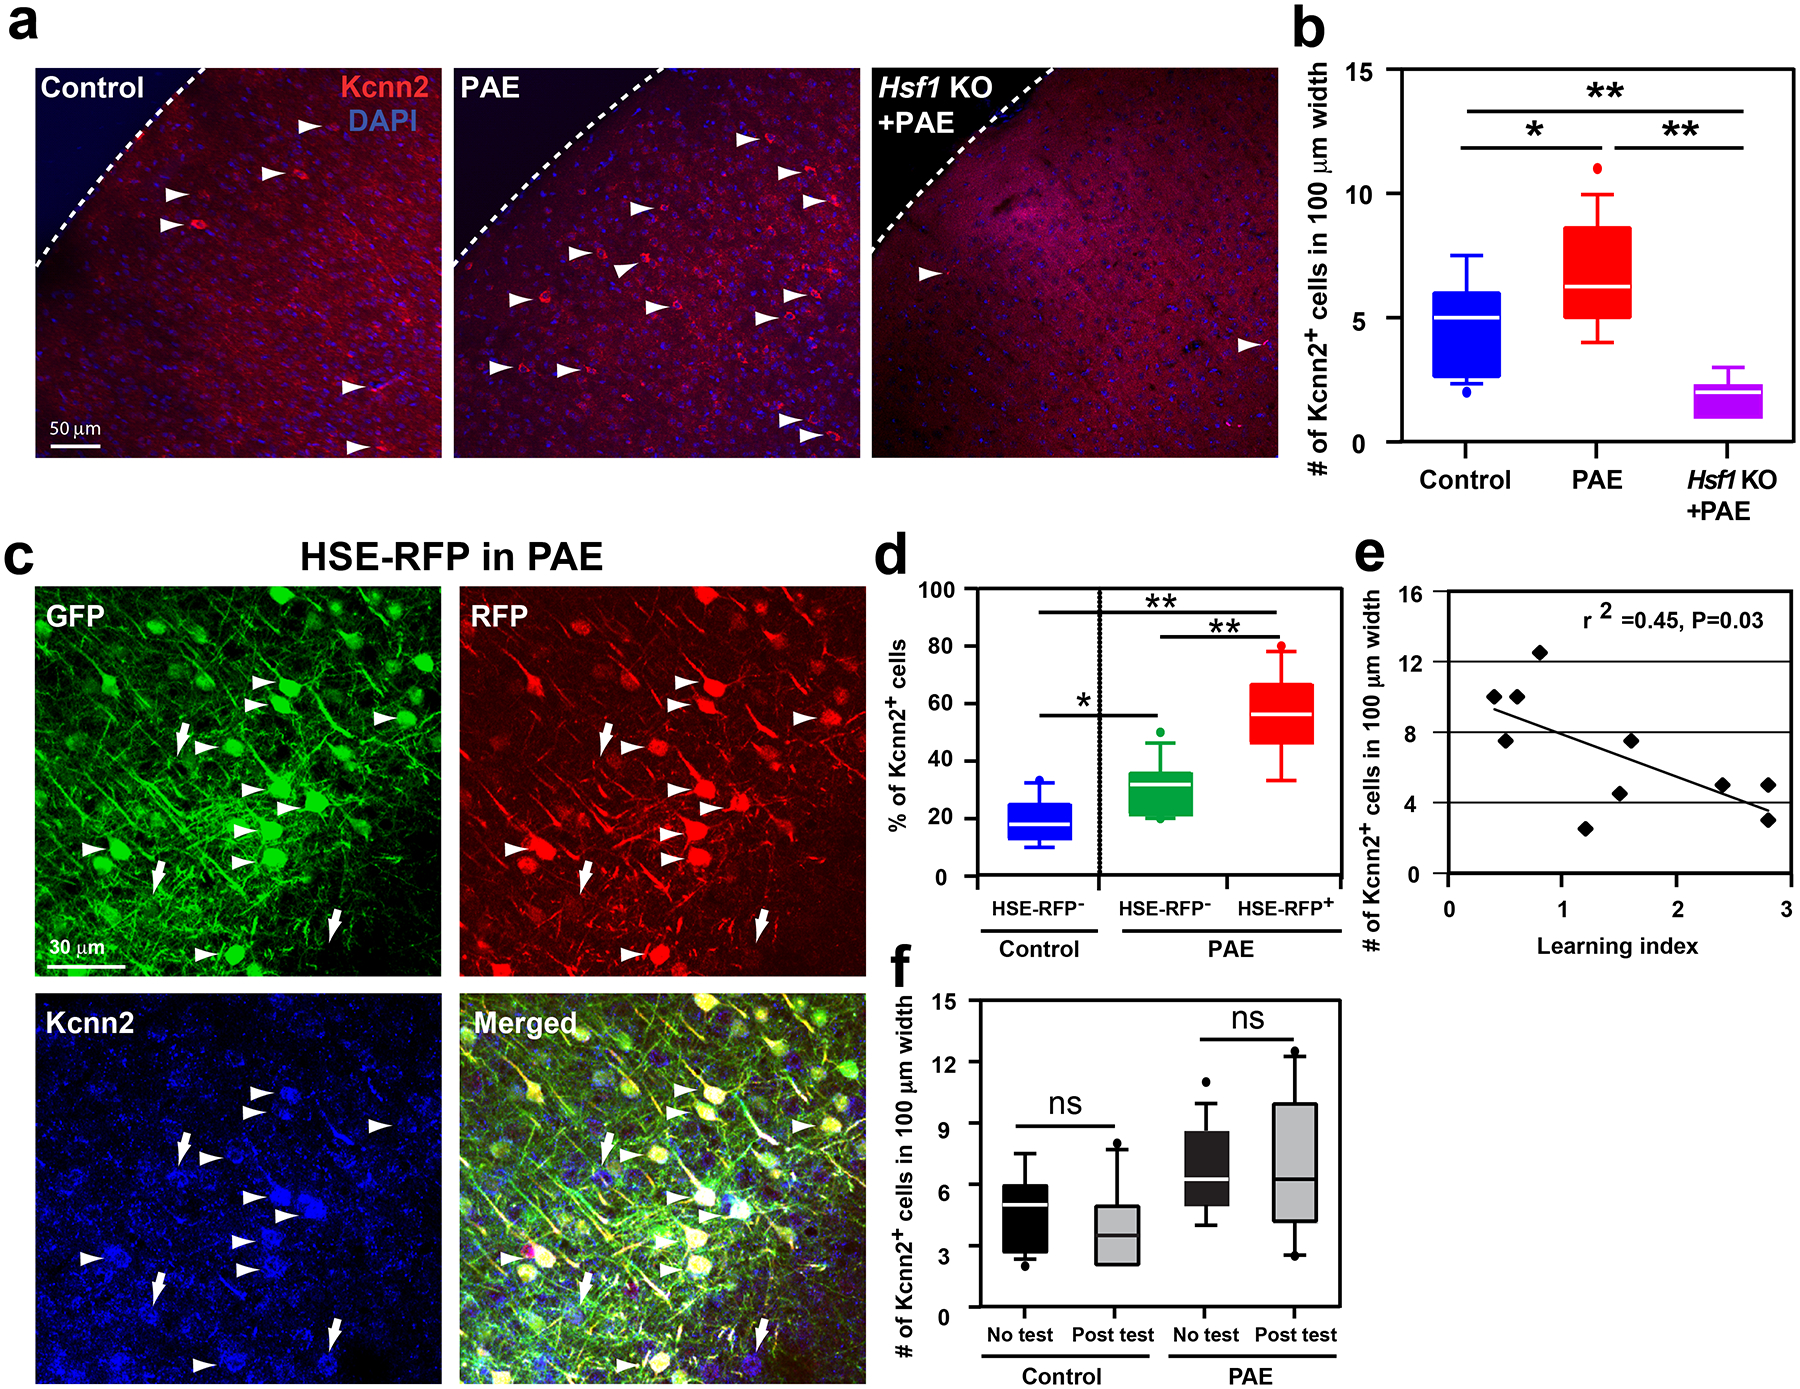
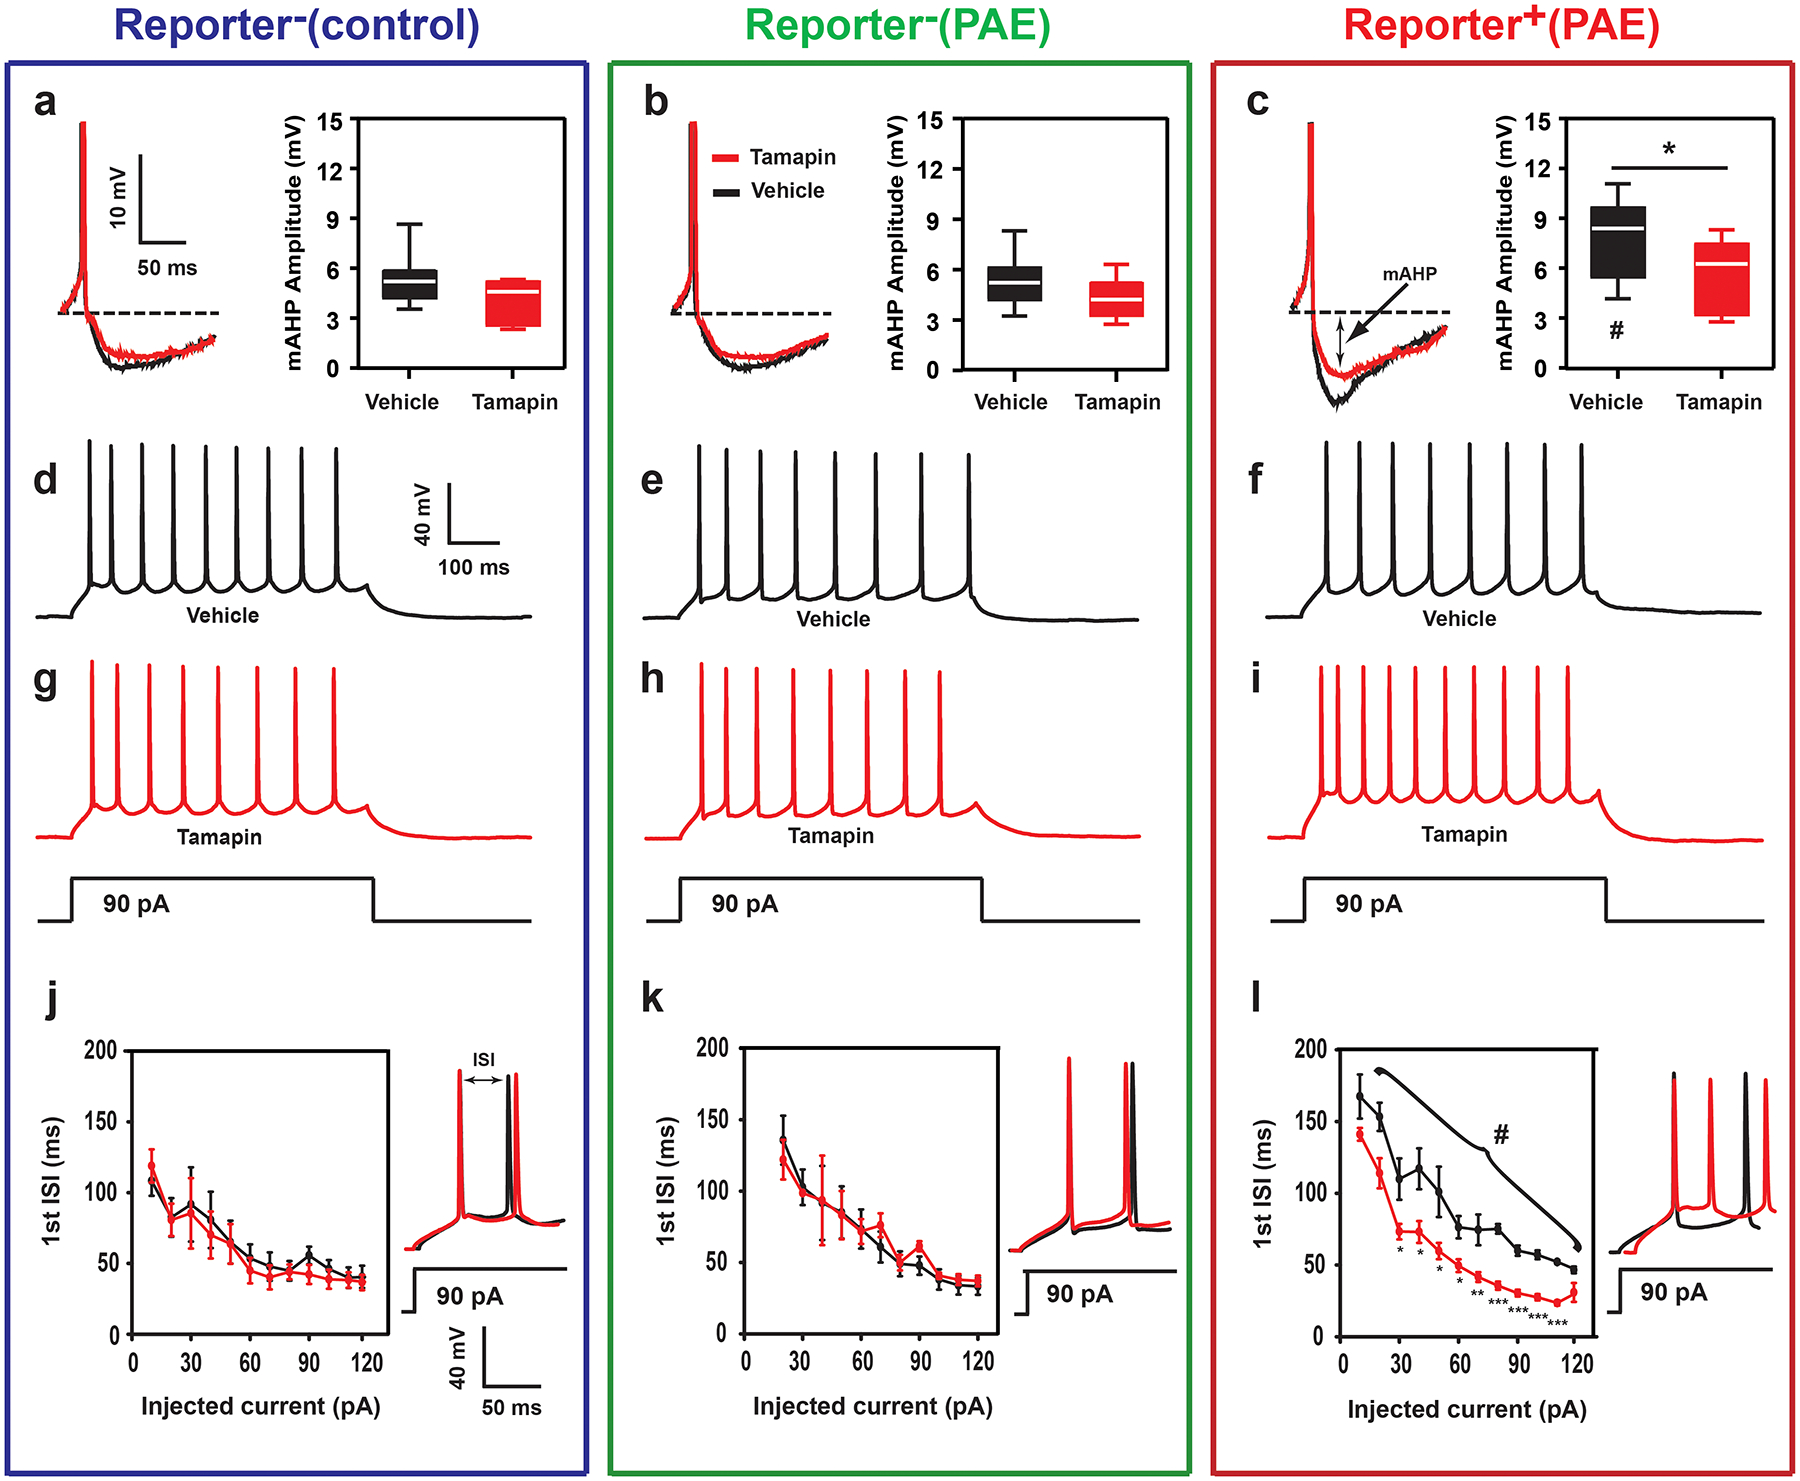
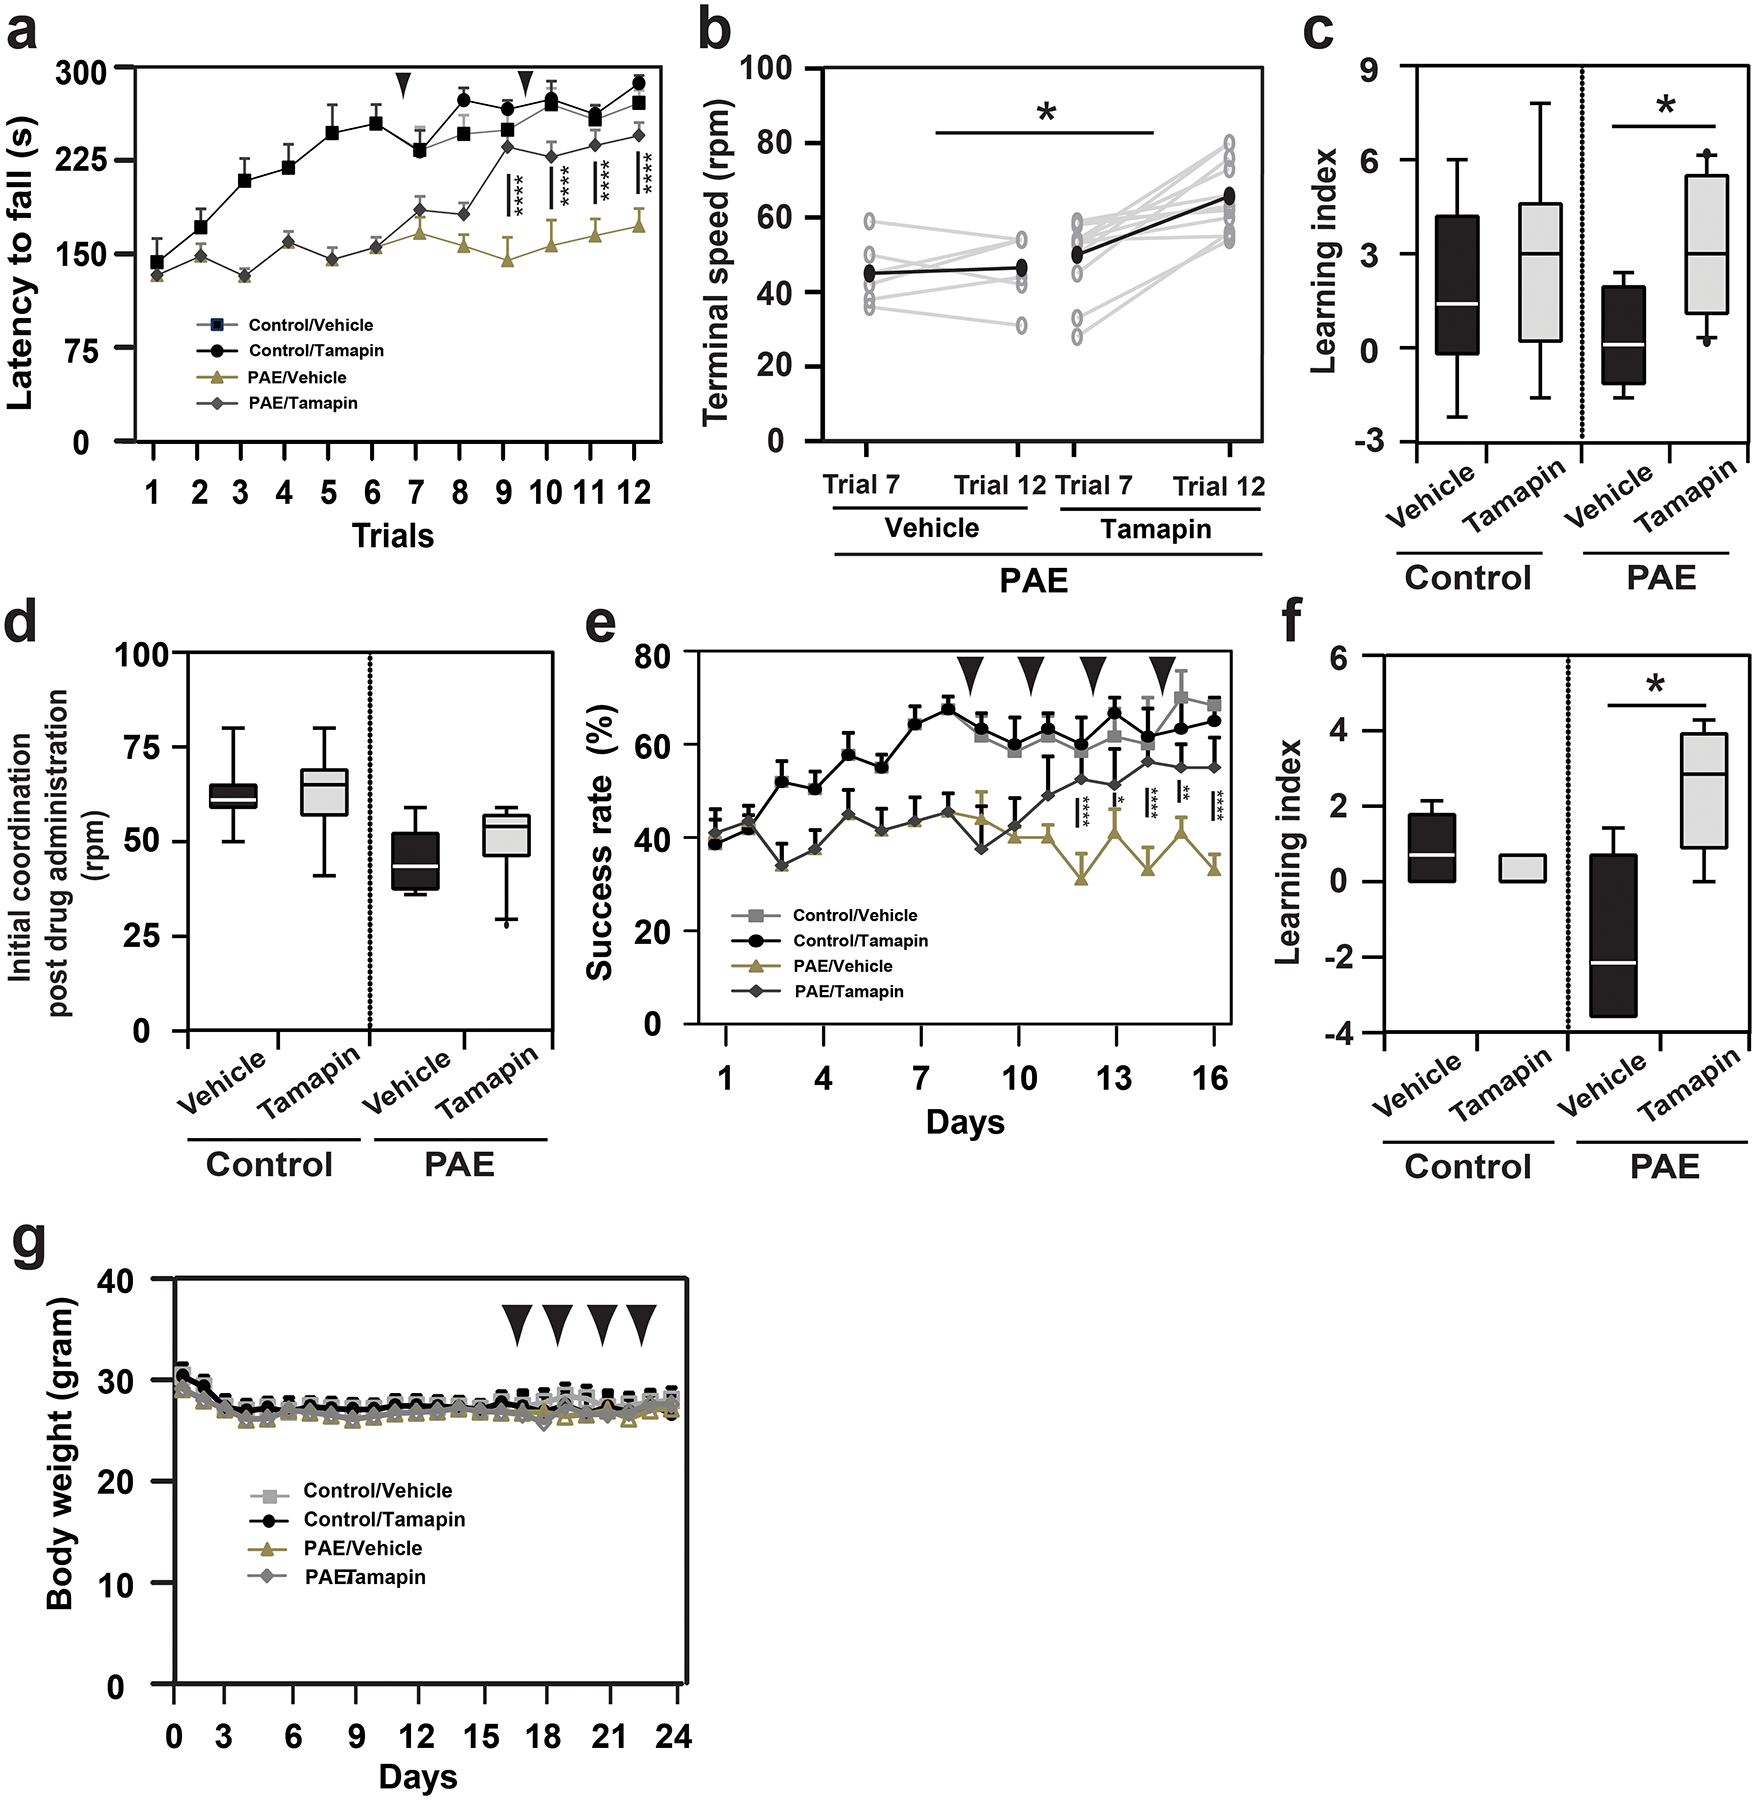
Learning disabilities are hallmarks of congenital conditions caused by prenatal exposure to harmful agents. These include fetal alcohol spectrum disorders (FASDs) with a wide range of cognitive deficiencies, including impaired motor skill development. Although these effects have been well characterized, the molecular effects that bring about these behavioral consequences remain to be determined. We previously found that the acute molecular responses to alcohol in the embryonic brain are stochastic, varying among neural progenitor cells. However, the pathophysiological consequences stemming from these heterogeneous responses remain unknown. Here we show that acute responses to alcohol in progenitor cells altered gene expression in their descendant neurons. Among the altered genes, an increase of the calcium-activated potassium channel Kcnn2 in the motor cortex correlated with motor learning deficits in a mouse model of FASD. Pharmacologic blockade of Kcnn2 improves these learning deficits, suggesting Kcnn2 blockers as a new intervention for learning disabilities in FASD.


Conflict of interest statement

Competing Interests Statement

K.H-T., M.T. and S.M. are founders of Cogthera LLC, a biotechnology company with a mission to develop SK2 blockers for neurocognitive disorders.

Figures

Extended Data Fig. 1
Extended Data Fig. 1. PAE mice show normal gross brain morphology, locomotor activity and anxiety-like behavior
(a,b) There are no differences in the brain size/shape (a) or weight (b) between control and PAE mice. P = 0.75 by two-tailed Student’s t-test [n = 10 (5 males and 5 females) per group]. In the box plot, the line within the box indicates the median, and the upper and lower edges of the box represent the 25th and 75th percentiles, respectively. The upper and lower whisker boundaries indicate the 10th and 90th percentiles, respectively, and dots indicate outliers. (c-f) No abnormalities were observed in total distance (c), horizontal activity (d), vertical activity (e) or center time (f) in PAE mice in the open field test; F(1,38) = 0.07, P = 0.79 (c), F(1,38) = 0.004, P = 0.95 (d), F(1,38) = 0.44, P = 0.51 (e), F(1,38) = 0.21, P = 0.65 (f) by two-way repeated measures ANOVA (n = 20 animals per group). No significant differences in comparisons at each time point by two-tailed Student’s t-test. Graphs show mean ± SEM.
Extended Data Fig. 2
Extended Data Fig. 2. Learning impairment lasts over a period of 5 days in PAE mice
(a) The accelerated rotarod test was performed with the same daily schedule as shown in Fig. 1c for 5 days. PAE mice show significantly shorter latency to fall compared to control. F(1,19) = 28.3, P = 0.0001 by two-way repeated measures ANOVA. *P < 0.05, **P < 0.01, ***P < 0.001, ****P < 0.0001 by Tukey’s test (control: n = 11 animals, PAE: n = 10 animals). Graph shows mean ± SEM. (b) Learning index over the 5-day period is lower in PAE mice. *P = 0.015 by two-tailed Student’s t-test (control: n = 11 animals, PAE: n = 10 animals). (c) The accelerated rotarod test was performed for 5 days with 3-month-old animals. No significant differences were observed in body weight between control and PAE mice; P = 0.243 by two-tailed Student’s t-test (control: n = 12 animals, PAE: n = 14 animals). (d) PAE mice show significantly shorter latency to fall compared to control mice. F(1,24) = 11.57, P = 0.003 by two-way repeated measures ANOVA. *P < 0.05 by Tukey’s test (control: n = 12 animals, PAE: n = 14 animals). Graph shows mean ± SEM. (e) Learning index over the 5-days period is also lower in PAE mice. *P = 0.026 by two-tailed Student’s t-test (control: n = 12 animals, PAE: n = 14 animals). In box plots (b, c, e), the line within the box indicates the median, and the upper and lower edges of the box represent the 25th and 75th percentiles, respectively. The upper and lower whisker boundaries indicate the 10th and 90th percentiles, respectively, and dots indicate outliers.
Extended Data Fig. 3
Extended Data Fig. 3. Pellet grasping is impaired in PAE mice
(a) PAE does not affect body weight change through the phases of the single pellet reaching test [food deprivation: day 1–3, acclimatization: day 4–5, training/shaping: day 6–8, and testing: day 9–16 (test day 1–8)]; F(1,33) = 0.89, P = 0.35 by two-way repeated measures ANOVA (vehicle: n = 20 animals, PAE: n = 15 animals). Graph shows mean ± SEM. (b-c) A significant effect of PAE is observed during the testing phase, on the failure to grasp (b); F(1,30) = 40.21, P < 0.0001 by two-way repeated measures ANOVA, *P < 0.05, **P < 0.01 by Tukey’s test, but not on the drop during retrieval (vehicle: n = 17 animals, PAE: n = 15 animals). Graph shows mean ± SEM. (c); F(1,30) = 0.87, P = 0.36 by two-way repeated measures ANOVA (vehicle: n = 17 animals, PAE: n = 15 animals). Graph shows mean ± SEM. (d) PAE does not affect the number of attempts per minute; F(1,30) = 3.08, P = 0.09 by two-way repeated measures ANOVA (vehicle: n = 17 animals, PAE: n = 15 animals). Graph shows mean ± SEM.
Extended Data Fig. 4
Extended Data Fig. 4. Normal radial positioning and morphology of layer III neurons in M1 in PAE mice at P30
(a) The percentage of reporter (control and PAE) and reporter+ (PAE) neurons among electroporated neurons in equally divided bins 1 to 10 spanning the upper to lower part of the entire thickness of the cerebral cortex. No significant differences are found between the distribution patterns in each group; P < 0.2 by one-tailed Kolmogorov-Smirnov test (n=3 per group). Graph shows mean ± SEM. (b) Representative tracing of the neuronal morphology in each group. (c-e) There are no significant morphological differences in reporter+ cortical neurons in PAE mice compared with reporter neurons in both control and PAE mice; Number of dendrites/neuron (c): F(2,122) = 1.46, P = 0.24 (total), F(2,122) = 1.47, P = 0.23 (apical), F(2,122) = 0.84, P = 0.43 (basal); number of branches/neuron [reporter (control, PAE): n = 40 cells each, reporter+ (PAE): n = 45 cells] (d): F(2,122) = 0.17, P = 0.84 (apical primary), F(2,122) = 0.31, P = 0.73 (apical secondary), F(2,122) = 0.86, P = 0.43 (apical tertiary), F(2,122) = 0.21, P = 0.81 (basal primary), F(2,122) = 2.19, P = 0.12 (basal secondary), F(2,122) = 1.13, P = 0.33 (basal tertiary); length of dendrites/neuron [reporter (control, PAE): n = 40 cells each, reporter+ (PAE): n = 45 cells] (e): F(2,22) = 1.02, P = 0.38 (apical primary), F(2,22) = 0.26, P = 0.77 (apical secondary), F(2,22) = 0.20, P = 0.820 (apical tertiary), F(2,22) = 0.01, P = 0.99 (basal primary), F(2,22) = 0.79, P = 0.47 (basal secondary), F(2,22) = 0.29, P = 0.08 (basal tertiary), all by one-way ANOVA [reporter (control): n = 9 cells, reporter (PAE): n = 8 cells, reporter+ (PAE): n = 8 cells]. In box plots (c-e), the line within the box indicates the median, and the upper and lower edges of the box represent the 25th and 75th percentiles, respectively. The upper and lower whisker boundaries indicate the 10th and 90th percentiles, respectively, and dots indicate outliers.
Extended Data Fig. 5
Extended Data Fig. 5. GO networks of the Blue and Green modules that are specific to reporter + neurons
GO networks enriched in the Blue (a) and Green (b) modules show unique GOs for each module.
Extended Data Fig. 6
Extended Data Fig. 6. Kcnn2 expression is not increased in other major brain regions involved in motor learning
(a) Immunohistochemistry for Kcnn2 (red) with nuclear staining with DAPI (blue) in the indicated brain regions in control and PAE mice at P30. Arrowheads indicate Kcnn2+ cells. (b-e) Quantification of Kcnn2+ cells in dorsal striatum (b), hippocampus (granule cell layer of dentate gyrus) (c), cerebellum (granular layer in lobule VI) (d) and layer V in M1 (e). P = 0.51 (b), 0.26 (c), 0.37 (d), and 0.002 (e) by two-tailed Student’s t-test (n = 10 per group). In box plots (b-e), the line within the box indicates the median, and the upper and lower edges of the box represent the 25th and 75th percentiles, respectively. The upper and lower whisker boundaries indicate the 10th and 90th percentiles, respectively, and dots indicate outliers.
Extended Data Fig. 7
Extended Data Fig. 7. Tamapin binding colocalizes with Kcnn2 protein
Biotinylated Tamapin (or vehicle-only control) was injected i.p. to control and PAE mice at P30. The cortex was fixed 30 minutes later for staining of biotin (green) and Kcnn2 (red). (a) Labeling for biotin (arrowhead) in layer III in M1 shows the co-localization of Tamapin and Kcnn2 protein. (b) Many Kcnn2+ cells in layer III in M1 are co-labeled for biotin in biotinylated Tamapin-injected PAE mice; ***P < 0.0001 by two-tailed Mann-Whitney U test (n = 10 per group). In the box plot, the line within the box indicates the median, and the upper and lower edges of the box represent the 25th and 75th percentiles, respectively. The upper and lower whisker boundaries indicate the 10th and 90th percentiles, respectively, and dots indicate outliers.
Extended Data Fig. 8
Extended Data Fig. 8. Minimal binding of Tamapin to Kcnn1+ or Kcnn3+ cells
(a) Biotinylated Tamapin was injected i.p. to PAE mice at P30. The cortex was fixed 30 minutes later for staining of biotin (green) and Kcnn1, 2, or 3 (red) in the hilus, in which Kcnn1, 2, and 3 have distinct expression patterns. Insets show higher magnification views of the areas outlined by broken lines. (b) The percentage of biotin-labeled cells among the cells that express Kcnn1, 2, or 3 in the hilus, showing specific binding of biotinylated Tamapin to Kcnn2+ cells. F(2,21) = 148.21, P < 0.0001 by one-way ANOVA, **P < 0.01 by Tukey test (n = 8 brains per group). In the box plot, the line within the box indicates the median, and the upper and lower edges of the box represent the 25th and 75th percentiles, respectively. The upper and lower whisker boundaries indicate the 10th and 90th percentiles, respectively, and dots indicate outliers.
Extended Data Fig. 9
Extended Data Fig. 9. Tamapin does not alter locomotor activity or anxiety-like behavior
(a-h) The open field test shows that locomotor activity, measured by total distance (a, e), horizontal activity (b, f) and vertical activity (c, g), as well as anxiety-like behavior, measured by center time (d, h), are not altered by postnatal Tamapin administration in both control (a-d) and PAE (e-h) mice; F(1,18) = 0.06, P = 0.81 (a), F(1,18) = 0.03, P = 0.87 (b), F(1,16) = 0.88, P = 0.36 (c), F(1,18) = 0.01, P = 0.92 (d), F(1,18) = 0.001, P = 1.00 (e), F(1,18) = 0.06, P = 0.81 (f), F(1,17) = 0.22, P = 0.65 (g), F(1,18) = 0.21, P = 0.65 (h) by two-way repeated measures ANOVA (n = 10 animals per group). Separate sets of mice were used for open field testing. Graph shows mean ± SEM.
Extended Data Fig. 10
Extended Data Fig. 10. Knockdown of Kcnn2 in layer II/III neurons in M1 improves motor learning deficits in PAE mice
a) Timeline of the experiment. (b) Representative image of a brain that received Kcnn2 (or control) knockdown (visualized by co-expressed GFP) in the motor area (outlined by red rectangles). (c) Immunohistochemistry for Kcnn2 (red) shows that Kcnn2 shRNA, but not control shRNA, suppresses the increase in Kcnn2 expression in layer III neurons in M1 in PAE mice. Arrowheads indicate Kcnn2+ cells among GFP+ electroporated cells. (d) Percentage of Kcnn2+ cells among GFP+ electroporated cells in the indicated experimental groups. **P = 0.001 by two-tailed Student’s t-test (n = 10 per group). (e, f) Motor learning deficits in PAE mice, revealed by lower success rate (e) and learning index (f) in the single pellet reaching test, are mitigated by Kcnn2 knockdown in layer II/III neurons in M1. A significant interaction was observed between the effects of condition (treatment plus shRNA) and trial (e); F(1,11) = 2.80, P = 0.01 by two-way repeated measures ANOVA, *P < 0.05, **P < 0.01 by simple main effect test [PAE (Kcnn2 shRNA) vs PAE (Kcnn2 shRNA+)], and between treatment and shRNA (f); F(1,24) = 5.55, P = 0.03 by two-way ANOVA, **P < 0.05, ***P < 0.005 by simple main effect test (n = 10 animals per group). Graph shows mean ± SEM. In box plots (d, f), the line within the box indicates the median, and the upper and lower edges of the box represent the 25th and 75th percentiles, respectively. The upper and lower whisker boundaries indicate the 10th and 90th percentiles, respectively, and dots indicate outliers.
Figure 1.
Figure 1.. Impaired motor skill learning in mice prenatally exposed to alcohol
(a) Experimental timeline. (b) Body weight is unaffected by prenatal alcohol exposure (PAE); P = 0.43 by two-tailed Student’s t-test [n = 12 animals (including both sexes) per group]. (c) Experimental paradigm of accelerated rotarod test. (d) Initial motor coordination (terminal speed at trial 1) is not affected by PAE; P = 0.31 by two-tailed Mann-Whitney U test (control: n = 25 animals, PAE: n = 49 animals). (e) The learning indices of PAE mice are significantly lower than those of controls, but not affected by sex; F(1,60) = 15.19, P = 0.0002 and F(1,60) = 0.0003, P = 0.99, respectively by two-way ANOVA. *P < 0.05 by Tukey test [control (male): n = 14 animals, control (female): n = 11 animals, PAE (male): n = 20 animals, PAE (female): n = 19 animals]. (f) Latency to fall at each trial in the rotarod test. A significant interaction between the effects of exposure type (PAE or control) and trial was observed; F(5,72) = 2.73, P = 0.02 by two-way repeated measures ANOVA. PAE mice show significantly shorter latency to fall from the 3rd trial; **P < 0.01, ***P < 0.005, ****P < 0.001 by simple main effect test (control: n = 25 animals, PAE: n = 49 animals). Graph shows mean ± Standard Error of the Mean (SEM). (g) The increases of terminal speeds between trials 1 and 6 were compared between control and PAE mice. Gray and black lines show the data for individual mice and the means, respectively. The increase was significantly smaller in PAE mice; ***P < 0.0001 by two-tailed Student’s t-test (control: n = 20 animals, PAE: n = 26 animals). (h) Schematic of the single-pellet reaching test box. (i) PAE mice show lower success rates; F(1,30) = 43.42, P < 0.0001, by two-way repeated measures ANOVA, *P < 0.05, **P < 0.01 by Tukey test (control: n = 14 animals, PAE: n = 10 animals). Graph shows mean ± SEM. (j) Forelimb grip strength is not affected by PAE. P = 0.92 by two-tailed Student’s t-test (n=10 animals per group). (k) Pearson’s correlation analysis reveals a positive correlation between learning indices of the rotarod and pellet reaching tests on PAE mice; Pearson’s correlation of determination r2 = 0.25, P = 0.04 (n = 16 animals per group). Separate groups of animals were used for rotarod and single pellet reaching tests, except for the correlation study (k), in which the rotarod test was performed before the single pellet reaching test on the same mice. In box plots (b, d, e, j), the line within the box indicates the median, and the upper and lower edges of the box represent the 25th and 75th percentiles, respectively. The upper and lower whisker boundaries indicate the 10th and 90th percentiles, respectively, and dots indicate outliers.
Figure 2.
Figure 2.. Single-cell RNA-sequencing reveals long-term impacts of PAE in postnatal cortical neurons
(a) Design of the lineage-tracing HSE-FLPo;FRT-STOP-RFP (HSE-RFP) reporter system. (b) Experimental timeline. (c, d) RFP reporter expression was observed in a subset of GFP+ electroporated neurons in layer III of the M1 in PAE mice, but not in control mice. ***P = 0.0003 by two-tailed Student’s t-test (n = 10 animals per group). In box plots (d), the line within the box indicates the median, and the upper and lower edges of the box represent the 25th and 75th percentiles, respectively. The upper and lower whisker boundaries indicate the 10th and 90th percentiles, respectively, and dots indicate outliers. (e) Representative images of sampling intracellular contents from a single cell (time course, top to bottom). Similar results were obtained with n = 4 animals. (f) Principal Component Analysis shows highly variable molecular properties of reporter+ neurons in PAE mice (red), segregated from the clusters of reporter neurons in PAE (green) and control (blue) mice, and the cluster of olfactory bulb (OB) neurons (black) [olfactory bulb neurons: n = 4, reporter+ neurons (PAE): n = 15, reporter neurons (PAE): n= 7, reporter neurons (control): n = 6]. (g) Gene counts against the entropy score among reporter+ neurons in PAE mice defined by ROKU. Left and right sides of a broken line include the upregulated and downregulated genes in reporter+ neurons, respectively. The genes in yellow bars are considered as specifically changed in reporter+ neurons. (h, i) K-means clustering and heatmaps of 73 upregulated (h) and 20 downregulated (i) genes in the reporter+ neurons defined by ROKU (in the yellow bars in g). Gene names (from left to right in h and i) are re-listed in Supplementary Table 3. Red, green and blue colors in the y-axis correspond to each cell in PCA (see f).
Figure 3.
Figure 3.. Genes linked to learning are enriched in the modules of co-expression in reporter+ neurons
(a, b) WGCNA analysis of the single cell RNA-sequencing dataset. Clustering dendrogram of genes with assigned module colors (a), from which 9 gene modules of highly correlated genes are identified including 5 modules unique to reporter+ neurons in PAE mice (Blue, Brown, Yellow, Green and Magenta modules) (b). (c-e) GO networks enriched in Brown (c), Yellow (d) and Magenta (e) modules. The broken-line ellipse in the Brown module indicates the fatty acid metabolic process that includes top-ranked genes involved in intellectual disability and autism (genes at higher ranking are indicated as larger nodes). Yellow (d) and Magenta (e) modules include GOs related to learning and ion transport, respectively (broken-line ellipses).
Figure 4.
Figure 4.. Increase of Kcnn2-expressing neurons in M1 in PAE mice
(a, b) Kcnn2 immunohistochemistry at P30 (a) and quantification of labeled neurons in layer III in M1 (b). The number of Kcnn2+ cells (arrowheads in a) is increased in PAE mice compared to that in control (PBS-exposed) mice. The increase of Kcnn2+ cells by PAE is not observed in Hsf1 KO mice; F(2,39) = 23.51, P < 0.0001 by one-way ANOVA, *P < 0.05, **P < 0.01 by Tukey test (control: n = 5 animals, PAE: n = 5 animals, Hsf1 KO+PAE: n = 4 animals). (c) Among GFP+ (green) electroporated neurons, Kcnn2 expression (blue) is enriched in HSE-RFP reporter+ (red) neurons in PAE mice (arrowheads) (arrows indicate Kcnn2+ cells that are also found among non-electroporated cells). Images are representatives of similar results obtained from n = 4 animals. (d) The percentage of neurons positive for Kcnn2 among HSE-RFP reporter+ neurons (in PAE mice) is significantly higher than that of reporter neurons (in PAE or Control mice) among all GFP+ electroporated layer III neurons in M1; F(2,34) = 38.40, P<0.0001 by one-way ANOVA, *P < 0.05, **P < 0.01 by Tukey test (control: n = 4 animals, PAE: n = 4 animals). (e) Pearson’s correlation analysis demonstrates a negative correlation between learning index (accelerated rotarod test) and the number of Kcnn2+ cells in layer III in M1. Pearson’s correlation of determination r2 = 0.45, P = 0.03 (n = 10 animals per group). (f) Kcnn2 expression is not altered by motor learning itself. P = 0.35 and 0.98 by two-tailed Student’s t-test for control group and PAE group, respectively (no test: n = 16 animals, post test: n=10 animals per group). In box plots (b, d, f), the line within the box indicates the median, and the upper and lower edges of the box represent the 25th and 75th percentiles, respectively. The upper and lower whisker boundaries indicate the 10th and 90th percentiles, respectively, and dots indicate outliers.
Figure 5.
Figure 5.. Electrophysiological abnormalities in reporter+ neurons in PAE mice and their improvement by a Kcnn2 blocker
(a-c) The peak amplitude of medium afterhyperpolarization (mAHP) in reporter+ and reporter neurons in slices from control and PAE mice (conditions indicated at the top). In aCSF alone (graphs in black), the amplitude of the mAHP in reporter+ neurons in PAE mice (c) is higher than that of reporter neurons in control (a) or PAE (b) mice; F(2,26) = 6.35, P = 0.005 by one-way ANOVA, #P < 0.05 between reporter+ (PAE) and reporter (control or PAE) neurons by Tukey test (n = 11 cells per group). After Tamapin treatment (graphs in red), the increased mAHP amplitude in reporter+ neurons in PAE mice is mitigated (c); *P = 0.03 by two-tailed Student’s t-test (n = 11 cells per group). In box plots, the line within the box indicates the median, and the upper and lower edges of the box represent the 25th and 75th percentiles, respectively. The upper and lower whisker boundaries indicate the 10th and 90th percentiles, respectively, and dots indicate outliers. (d-l) Typical neuron firing responses to current injection (600 ms, 90 pA, d-i), and the quantification of the first interspike interval (ISI) (j-l, the first two spikes in d-i are shown next the graphs) in reporter+ and reporter neurons in slices from control and PAE mice. In aCSF alone (traces and graphs in black), reporter+ neurons (PAE) exhibit an increase in the 1st ISI (f, l, in black) as compared to reporter- neurons (control or PAE, d, e, j, k); F(1,10) = 72.88, P < 0.00005 by one-way repeated measures ANOVA, #P < 0.0001 by Tukey test. Tamapin treatment (traces and graphs in red) does not affect the firing pattern of action potentials in reporter neurons in control or PAE mice (g, h, j, k), but reverses the increased 1st ISI in reporter+ neurons (PAE) (i, l); F(1,11) = 46.27, P < 0.00005 by one-way repeated measures ANOVA, *P < 0.05, **P < 0.005, ***P < 0.0005 by one-tailed paired t-test (aCSF vs Tamapin) (n = 11 cells per group).
Figure 6.
Figure 6.. Kcnn2 blocker improves deficits in motor skill learning in PAE mice
(a) Effect of Tamapin (arrowheads: twice, before trials 7 and 10) after 6 trials on the accelerated rotarod test, by which PAE mice show gross motor skill learning deficits. A significant interaction between the effects of treatment (Tamapin or Vehicle) and trial was observed in PAE mice; F(5,15) = 2.35, P = 0.049 by two-way repeated measures ANOVA. Tamapin-treated PAE mice show significantly longer latency to fall from the 9th trial; ****P < 0.001 by simple main effect test (vehicle: n = 6 animals, Tamapin: n = 11 animals). No significant effects of Tamapin were observed in control mice; F(1,12) = 2.15, P = 0.17 by two-way repeated measures ANOVA (vehicle: n = 7 animals, Tamapin: n = 7 animals). Graph shows mean ± SEM. (b) The increase in terminal speed between trials 7 and 12 was compared between vehicle- and Tamapin-treated PAE mice. Gray and black lines show the data for individual mice and the means. The increase was significantly larger in Tamapin-treated PAE mice; *P = 0.02 by two-tailed Student’s t-test (vehicle: n = 6 animals, Tamapin: n = 12 animals). (c) Tamapin improves learning in trials 7–12 in PAE, but not in control mice; *P = 0.02 (vehicle: n = 6 animals, Tamapin: n = 12 animals) and P = 0.60 (vehicle: n = 7 animals, Tamapin: n = 7 animals), respectively by two-tailed Student’s t-test. (d) Motor coordination is not affected at trial 7 by the first administration of Tamapin; control mice: P = 0.30 by two-tailed Student’s t-test (vehicle: n = 7 animals, Tamapin: n = 7 animals), PAE mice: P = 0.69 (vehicle: n = 6 animals, Tamapin: n = 12 animals). (e) In different sets of mice, Tamapin was administered (arrowheads: 4 times, before trials 9, 11, 13 and 15) after 8 trials in the single pellet reaching test, in which PAE mice show fine motor skill learning deficits. A significant interaction between the effects of treatment (Tamapin or Vehicle) and trial was observed in PAE mice; F(7,12) = 4.11, P = 0.0006 by two-way repeated measures ANOVA. Tamapin-treated PAE mice show significantly higher success rate from the 12th trial; *P < 0.05, **P < 0.01, ****P < 0.001 by simple main effect test (vehicle: n = 7, Tamapin: n = 7). No significant effects of Tamapin were observed in control mice; F(1,8) = 0.08, P = 0.78 by two-way repeated measures ANOVA (vehicle: n = 5 animals, Tamapin: n = 5 animals). Graph shows mean ± SEM. (f) Learning index in trials 9–16 is improved by Tamapin in PAE mice; *P = 0.011 by two-tailed Student’s t-test (vehicle: n = 7 animals, Tamapin: n = 7 animals), but not in control mice; P = 0.44 by two-tailed Mann-Whitney U test (vehicle: n = 5 animals, Tamapin: n = 5 animals). (g) Tamapin does not affect body weight; control mice: F(1,9) = 0.13, P = 0.72 (vehicle: n = 5 animals, Tamapin: n = 5 animals), PAE mice: F(1,8) = 0.004, P = 0.95 (vehicle: n = 7 animals, Tamapin: n = 7 animals) by two-way repeated measures ANOVA, Graph shows mean ± SEM. In box plots (c, d, f), the line within the box indicates the median, and the upper and lower edges of the box represent the 25th and 75th percentiles, respectively. The upper and lower whisker boundaries indicate the 10th and 90th percentiles, respectively, and dots indicate outliers.

Comment in

  • Channel problems.
    Otto G. Otto G. Nat Rev Neurosci. 2020 Jun;21(6):300. doi: 10.1038/s41583-020-0305-3. Nat Rev Neurosci. 2020. PMID: 32286549 No abstract available.

Similar articles

Cited by

References

    1. Sakurai T et al. Converging models of schizophrenia--Network alterations of prefrontal cortex underlying cognitive impairments. Prog. Neurobiol 134, 178–201 (2015). - PMC - PubMed
    1. Thompson BL, Levitt P & Stanwood GD Prenatal exposure to drugs: effects on brain development and implications for policy and education. Nat. Rev. Neurosci 10, 303–312 (2009). - PMC - PubMed
    1. Grandjean P & Landrigan PJ Developmental neurotoxicity of industrial chemicals. Lancet 368, 2167–2178 (2006). - PubMed
    1. May PA et al. Prevalence of Fetal Alcohol Spectrum Disorders in 4 US Communities. JAMA 319, 474–482 (2018). - PMC - PubMed
    1. Diamond A & Lee EY Inability of five-month-old infants to retrieve a contiguous object: a failure of conceptual understanding or of control of action? Child Dev 71, 1477–1494 (2000). - PubMed

Publication types

MeSH terms

Substances