

Reconciling the Potentially Irreconcilable? Genotypic and Phenotypic Amoxicillin-Clavulanate Resistance in Escherichia coli
- PMID: 32205351
- PMCID: PMC7269502
- DOI: 10.1128/AAC.02026-19
Reconciling the Potentially Irreconcilable? Genotypic and Phenotypic Amoxicillin-Clavulanate Resistance in Escherichia coli
Abstract
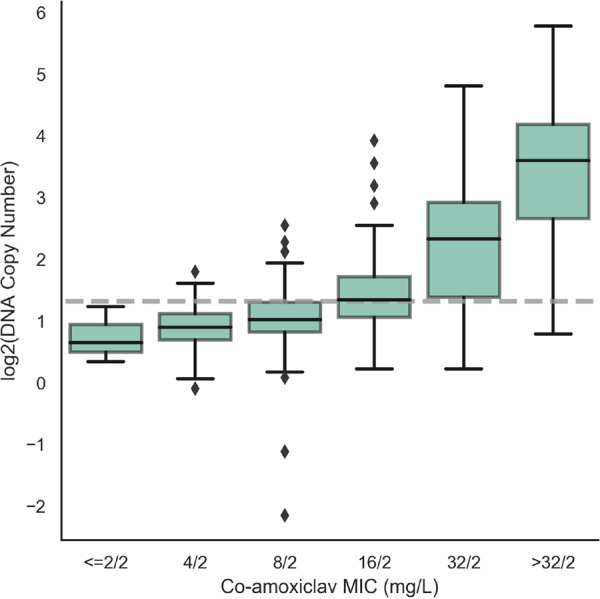
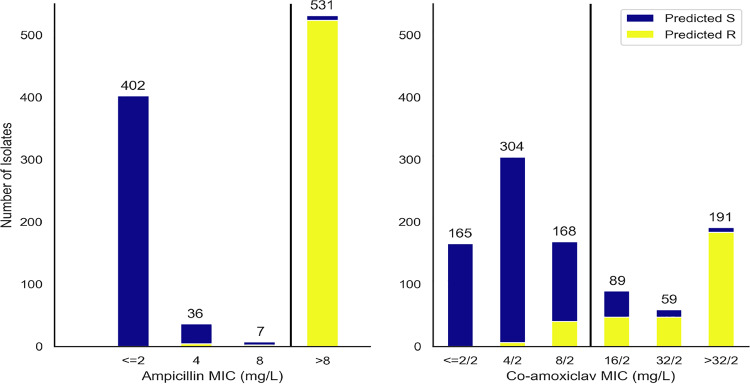
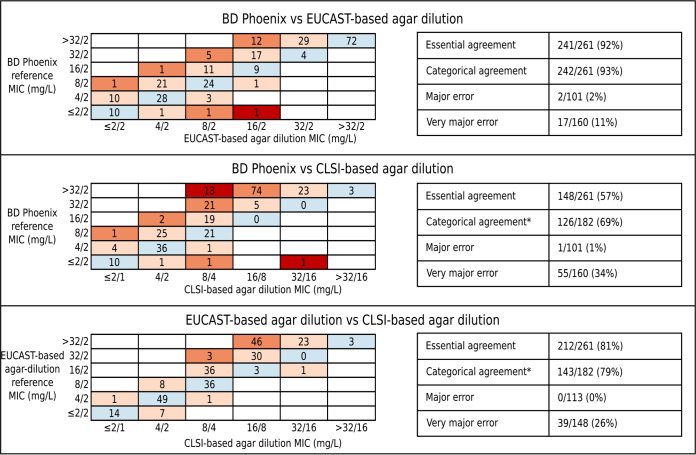
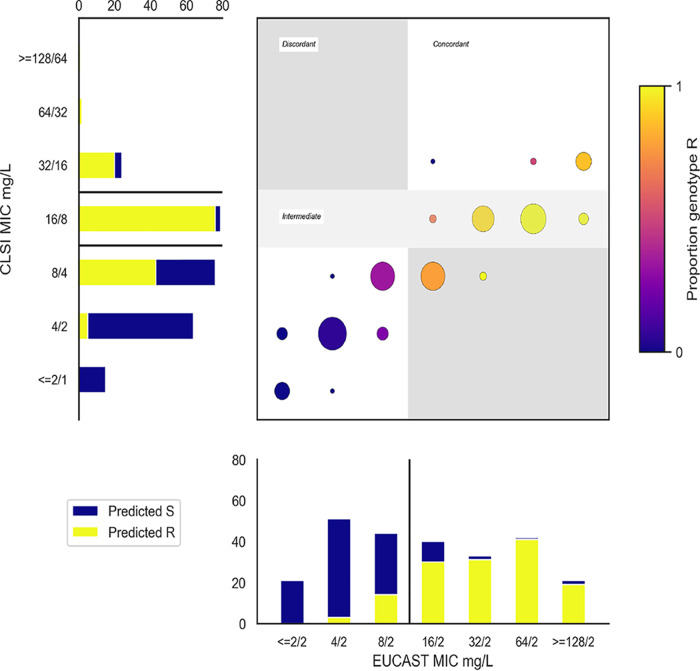
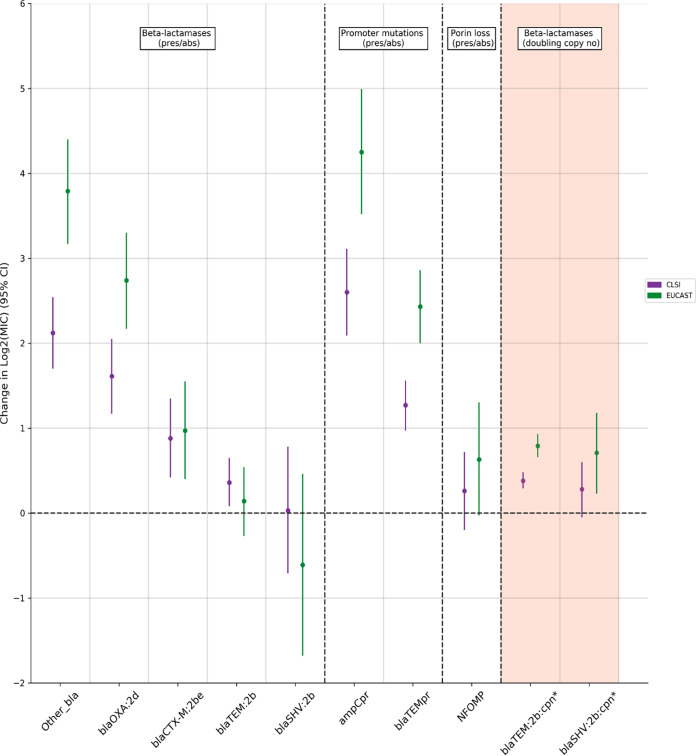
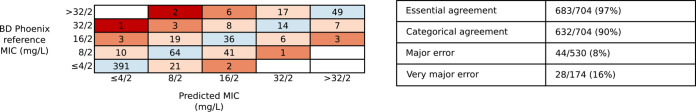
Resistance to amoxicillin-clavulanate, a widely used beta-lactam/beta-lactamase inhibitor combination antibiotic, is rising globally, and yet susceptibility testing remains challenging. To test whether whole-genome sequencing (WGS) could provide a more reliable assessment of susceptibility than traditional methods, we predicted resistance from WGS for 976 Escherichia coli bloodstream infection isolates from Oxfordshire, United Kingdom, comparing against phenotypes from the BD Phoenix (calibrated against EUCAST guidelines). A total of 339/976 (35%) isolates were amoxicillin-clavulanate resistant. Predictions based solely on beta-lactamase presence/absence performed poorly (sensitivity, 23% [78/339]) but improved when genetic features associated with penicillinase hyperproduction (e.g., promoter mutations and copy number estimates) were considered (sensitivity, 82% [277/339]; P < 0.0001). Most discrepancies occurred in isolates with MICs within ±1 doubling dilution of the breakpoint. We investigated two potential causes: the phenotypic reference and the binary resistant/susceptible classification. We performed reference standard, replicated phenotyping in a random stratified subsample of 261/976 (27%) isolates using agar dilution, following both EUCAST and CLSI guidelines, which use different clavulanate concentrations. As well as disagreeing with each other, neither agar dilution phenotype aligned perfectly with genetic features. A random-effects model investigating associations between genetic features and MICs showed that some genetic features had small, variable and additive effects, resulting in variable resistance classification. Using model fixed-effects to predict MICs for the non-agar dilution isolates, predicted MICs were in essential agreement (±1 doubling dilution) with observed (BD Phoenix) MICs for 691/715 (97%) isolates. This suggests amoxicillin-clavulanate resistance in E. coli is quantitative, rather than qualitative, explaining the poorly reproducible binary (resistant/susceptible) phenotypes and suboptimal concordance between different phenotypic methods and with WGS-based predictions.
Keywords: antibiotic resistance; antimicrobial combinations; beta-lactamase inhibitor; microbial genomics; susceptibility testing.
Copyright © 2020 Davies et al.
Figures
References
-
- Public Health England. 2018. English Surveillance Programme for Antimicrobial Utilization and Resistance (ESPAUR). Public Health England, London, United Kingdom.
-
- Plachouras D, Kärki T, Hansen S, Hopkins S, Lyytikäinen O, Moro ML, Reilly J, Zarb P, Zingg W, Kinross P, Weist K, Monnet DL, Suetens C, PPSS Group . 2018. Antimicrobial use in European acute care hospitals: results from the second point prevalence survey (PPS) of healthcare-associated infections and antimicrobial use, 2016 to 2017. Eurosurveillance 23:1800393. doi:10.2807/1560-7917.ES.23.46.1800393. - DOI - PMC - PubMed
-
- Diez-Aguilar M, Morosini M-I, Lopez-Cerero L, Pascual A, Calvo J, Martinez-Martinez L, Marco F, Vila J, Ortega A, Oteo J, Canton R. 2015. Performance of EUCAST and CLSI approaches for co-amoxiclav susceptibility testing conditions for clinical categorization of a collection of Escherichia coli isolates with characterized resistance phenotypes. J Antimicrob Chemother 70:2306–2310. doi:10.1093/jac/dkv088. - DOI - PubMed
-
- Mouton J. 2017. Antimicrobial susceptibility testing with EUCAST breakpoints and methods. ECCMID, Vienna, Austria.
-
- Vihta K-D, Stoesser N, Llewelyn MJ, Quan TP, Davies T, Fawcett NJ, Dunn L, Jeffery K, Butler CC, Hayward G, Andersson M, Morgan M, Oakley S, Mason A, Hopkins S, Wyllie DH, Crook DW, Wilcox MH, Johnson AP, Peto TEA, Walker AS. 2018. Trends over time in Escherichia coli bloodstream infections, urinary tract infections, and antibiotic susceptibilities in Oxfordshire, UK, 1998–2016: a study of electronic health records. Lancet Infect Dis 18:1138–1149. doi:10.1016/S1473-3099(18)30353-0. - DOI - PMC - PubMed
Publication types
MeSH terms
Substances
LinkOut - more resources
Full Text Sources
Molecular Biology Databases
Research Materials
