. 2020 Apr;30(4):647-659.
doi: 10.1101/gr.253070.119. Epub 2020 Mar 23.

Transcriptome reconstruction and functional analysis of eukaryotic marine plankton communities via high-throughput metagenomics and metatranscriptomics

Affiliations

Transcriptome reconstruction and functional analysis of eukaryotic marine plankton communities via high-throughput metagenomics and metatranscriptomics

Alexey Vorobev et al. Genome Res. 2020 Apr.

Abstract

Large-scale metagenomic and metatranscriptomic data analyses are often restricted by their gene-centric approach, limiting the ability to understand organismal and community biology. De novo assembly of large and mosaic eukaryotic genomes from complex meta-omics data remains a challenging task, especially in comparison with more straightforward bacterial and archaeal systems. Here, we use a transcriptome reconstruction method based on clustering co-abundant genes across a series of metagenomic samples. We investigated the co-abundance patterns of ∼37 million eukaryotic unigenes across 365 metagenomic samples collected during the Tara Oceans expeditions to assess the diversity and functional profiles of marine plankton. We identified ∼12,000 co-abundant gene groups (CAGs), encompassing ∼7 million unigenes, including 924 metagenomics-based transcriptomes (MGTs, CAGs larger than 500 unigenes). We demonstrated the biological validity of the MGT collection by comparing individual MGTs with available references. We identified several key eukaryotic organisms involved in dimethylsulfoniopropionate (DMSP) biosynthesis and catabolism in different oceanic provinces, thus demonstrating the potential of the MGT collection to provide functional insights on eukaryotic plankton. We established the ability of the MGT approach to capture interspecies associations through the analysis of a nitrogen-fixing haptophyte-cyanobacterial symbiotic association. This MGT collection provides a valuable resource for analyses of eukaryotic plankton in the open ocean by giving access to the genomic content and functional potential of many ecologically relevant eukaryotic species.


Figures

Figure 1.
Figure 1.
A taxonomic dendrogram representing the eukaryotic tree of life shows taxonomic positions of MGTs (orange circles) in relation to the major eukaryotic lineages. The size of the circles represents the number of MGTs positioned at a given taxonomic node. The total number of MGTs assigned to each taxonomic group is indicated on the outside of the tree.
Figure 2.
Figure 2.
A visual representation of the major MGT statistics including the MGT size (represented by the number of unigenes, x-axis) and the fraction of taxonomically assigned unigenes (y-axis). The circle size and its opacity represent the number of samples in which a given MGT was detected. Taxonomic affiliation of the MGTs to major eukaryotic lineages is color-coded. Size distribution of MGTs based on the number of unigenes is displayed on top of the main figure. Distribution of taxonomically assigned unigenes among MGTs is presented on the left-hand side panel of the figure. “Known” and “unknown” sections of the panel indicate the MGTs comprising >75% and <25% of taxonomically assigned unigenes, respectively. Highlighted MGTs were used for the biological validation of the MGT collection (see Results for more detail); Bathycoccus prasinos—MGT-41, MGT-65, MGT-277; Oithona nana—MGT-5, MGT-9, MGT-56, MGT-60.
Figure 3.
Figure 3.
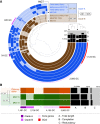
The pangenomes of (A) Bathycoccus prasinos and (B) Oithona nana compared to available sequenced references. Each layer represents an MGT, a reference genome, or transcriptome. Gene clusters are organized based on their distribution across samples. The dendrogram in the center organizes gene clusters based on their presence or absence in the samples. The top right dendrogram represents the hierarchical clustering of the samples based on the abundance of gene clusters. (ANI) Average nucleotide identity, (SCG) single-copy core genes, (GC) gene cluster.
Figure 4.
Figure 4.
Comparison of the DSYB (A) and Alma1 (B) relative gene expression per sample (x-axis) and per MGT (y-axis) across samples. Numbers near each point represent a Tara Oceans station. (SRF) Surface, (DCM) deep chlorophyll maximum. Y-axis (to the left of panel A) and size fractionation (to the right of panel B) are common for both figures. Tara Oceans provinces are applicable to both graphs and are specified on the right side of panel B. (ATLN) North Atlantic Ocean, (ATLS) South Atlantic Ocean, (SO) Southern Ocean, (INDIAN) Indian Ocean, (MEDIT) Mediterranean Sea, (PACN) North Pacific Ocean, and (PACS) South Pacific Ocean. (A) DSYB expression profiles across Tara Oceans stations and size fractions for 10 MGTs contributing significantly to the overall DSYB expression (at least 10% of the total DSYB expression in at least one sample). Red circles (MGT-4 and MGT-13) represent MGTs taxonomically assigned to the genus Phaeocystis; green circles (MGT-44, MGT-166, and MGT-179) represent Chloropicophyceae-affiliated MGTs; the rest of the circles represent other organisms. (B) Alma1 expression profiles across Tara Oceans stations and size fractions for nine MGTs contributing significantly to the overall Alma1 expression (at least 10% of the total Alma1 expression in at least one sample). Red circles (MGT-4, MGT-13, and MGT-67) represent MGTs taxonomically assigned to the genus Phaeocystis; yellow circles (MGT-178) represent Pelagomonas spp.-affiliated MGTs; and the rest of the circles represent other organisms.
Figure 5.
Figure 5.
The pangenomes of MGT-29 and MGT-176 compared to available reference sequences of UCYN-A. Each layer represents an MGT, a reference genome, or a MAG. Gene clusters are organized based on their distribution across samples. The dendrogram in the center organizes gene clusters based on their presence or absence in the samples. The top right dendrogram represents the hierarchical clustering of the samples based on the ANI values. (ANI) Average nucleotide identity, (SCG) single-copy core genes.

Similar articles

  • Eukaryotic genomes from a global metagenomic data set illuminate trophic modes and biogeography of ocean plankton.
    Alexander H, Hu SK, Krinos AI, Pachiadaki M, Tully BJ, Neely CJ, Reiter T. Alexander H, et al. mBio. 2023 Dec 19;14(6):e0167623. doi: 10.1128/mbio.01676-23. Epub 2023 Nov 10. mBio. 2023. PMID: 37947402 Free PMC article.
  • A global ocean atlas of eukaryotic genes.
    Carradec Q, Pelletier E, Da Silva C, Alberti A, Seeleuthner Y, Blanc-Mathieu R, Lima-Mendez G, Rocha F, Tirichine L, Labadie K, Kirilovsky A, Bertrand A, Engelen S, Madoui MA, Méheust R, Poulain J, Romac S, Richter DJ, Yoshikawa G, Dimier C, Kandels-Lewis S, Picheral M, Searson S; Tara Oceans Coordinators; Jaillon O, Aury JM, Karsenti E, Sullivan MB, Sunagawa S, Bork P, Not F, Hingamp P, Raes J, Guidi L, Ogata H, de Vargas C, Iudicone D, Bowler C, Wincker P. Carradec Q, et al. Nat Commun. 2018 Jan 25;9(1):373. doi: 10.1038/s41467-017-02342-1. Nat Commun. 2018. PMID: 29371626 Free PMC article.
  • Ocean plankton. Eukaryotic plankton diversity in the sunlit ocean.
    de Vargas C, Audic S, Henry N, Decelle J, Mahé F, Logares R, Lara E, Berney C, Le Bescot N, Probert I, Carmichael M, Poulain J, Romac S, Colin S, Aury JM, Bittner L, Chaffron S, Dunthorn M, Engelen S, Flegontova O, Guidi L, Horák A, Jaillon O, Lima-Mendez G, Lukeš J, Malviya S, Morard R, Mulot M, Scalco E, Siano R, Vincent F, Zingone A, Dimier C, Picheral M, Searson S, Kandels-Lewis S; Tara Oceans Coordinators; Acinas SG, Bork P, Bowler C, Gorsky G, Grimsley N, Hingamp P, Iudicone D, Not F, Ogata H, Pesant S, Raes J, Sieracki ME, Speich S, Stemmann L, Sunagawa S, Weissenbach J, Wincker P, Karsenti E. de Vargas C, et al. Science. 2015 May 22;348(6237):1261605. doi: 10.1126/science.1261605. Science. 2015. PMID: 25999516
  • Eukaryotic picoplankton in surface oceans.
    Massana R. Massana R. Annu Rev Microbiol. 2011;65:91-110. doi: 10.1146/annurev-micro-090110-102903. Annu Rev Microbiol. 2011. PMID: 21639789 Review.
  • Metatranscriptomics: A Tool for Clinical Metagenomics.
    Tyagi S, Katara P. Tyagi S, et al. OMICS. 2024 Aug;28(8):394-407. doi: 10.1089/omi.2024.0130. Epub 2024 Jul 19. OMICS. 2024. PMID: 39029911 Review.

Cited by

References

    1. Alberti A, Poulain J, Engelen S, Labadie K, Romac S, Ferrera I, Albini G, Aury JM, Belser C, Bertrand A, et al. 2017. Viral to metazoan marine plankton nucleotide sequences from the Tara Oceans expedition. Sci Data 4: 170093 10.1038/sdata.2017.93 - DOI - PMC - PubMed
    1. Albertsen M, Hugenholtz P, Skarshewski A, Nielsen KL, Tyson GW, Nielsen PH. 2013. Genome sequences of rare, uncultured bacteria obtained by differential coverage binning of multiple metagenomes. Nat Biotechnol 31: 533–538. 10.1038/nbt.2579 - DOI - PubMed
    1. Alcolombri U, Ben-Dor S, Feldmesser E, Levin Y, Tawfik DS, Vardi A. 2015. Identification of the algal dimethyl sulfide-releasing enzyme: a missing link in the marine sulfur cycle. Science 348: 1466–1469. 10.1126/science.aab1586 - DOI - PubMed
    1. Armbrecht LH, Eriksen R, Leventer A, Armand LK. 2017. First observations of living sea-ice diatom agglomeration to tintinnid loricae in East Antarctica. J Plankton Res 39: 795–802. 10.1093/plankt/fbx036 - DOI
    1. Ayers GP, Cainey JM. 2007. The CLAW hypothesis: a review of the major developments. Environ Chem 4: 366–374. 10.1071/EN07080 - DOI

Publication types

LinkOut - more resources