

Spatiotemporal modelling of pregabalin prescribing in England with effect of deprivation
- PMID: 32205369
- PMCID: PMC7103846
- DOI: 10.1136/bmjopen-2019-029624
Spatiotemporal modelling of pregabalin prescribing in England with effect of deprivation
Abstract
Objective: This paper aims to understand spatial and temporal trends in pregabalin prescribing and the relationship with deprivation across England at both general practice and clinical commissioning group (CCG) levels.
Design: A set of 207 independent generalised additive models are employed to model the spatiotemporal trend of pregabalin prescribed and dispensed per 1000 population, adjusting for deprivation. The response variable is pregabalin prescribed in milligrams, with weighted Index of Multiple Deprivation (IMD), geographical location and time as predictors. The set of active prescribing facilities grouped within CCG is the unit of analysis.
Setting: National Health Service open prescribing data; all general practices in England, UK between January 2015 and June 2017.
Population: All patients registered to general practices in England, UK.
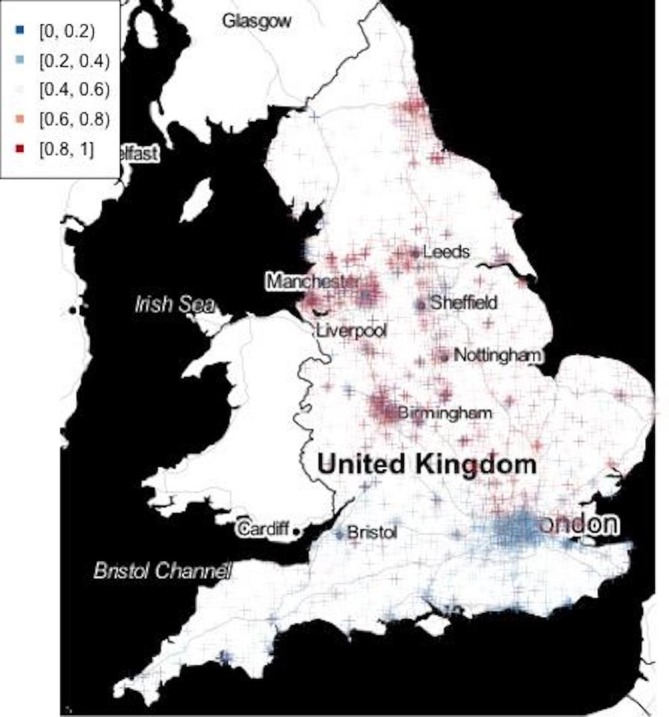
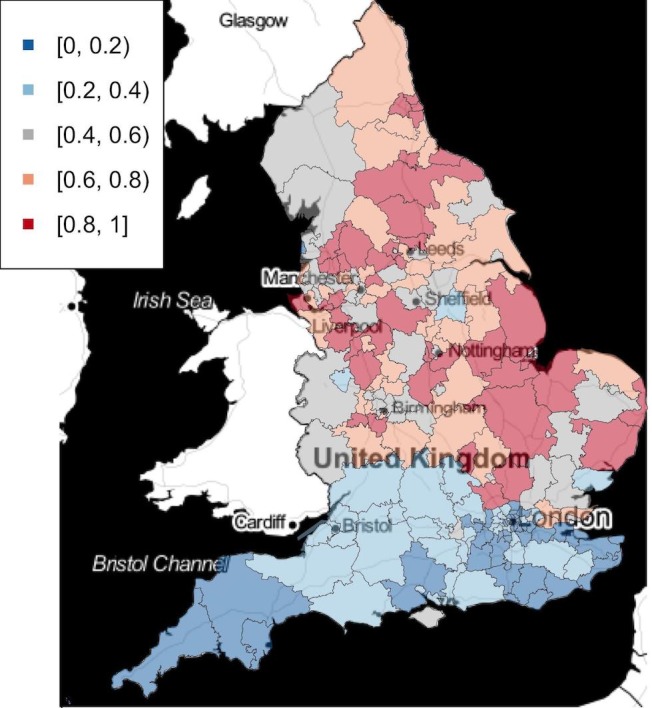
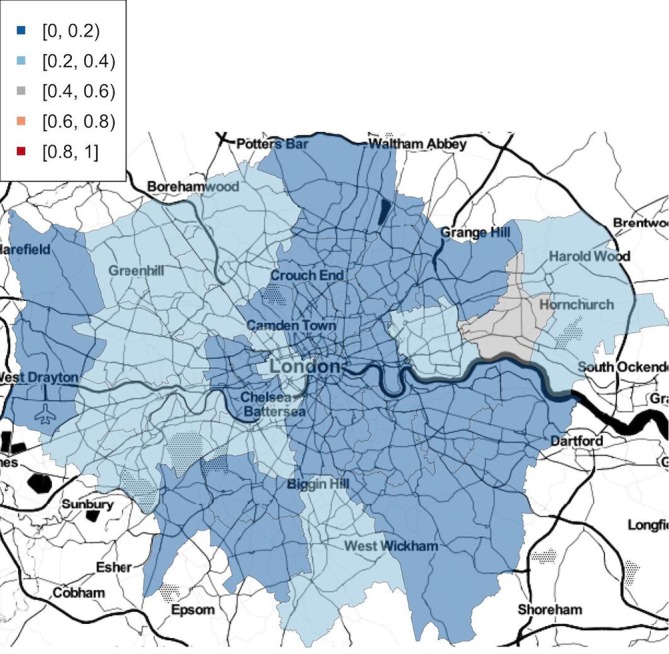
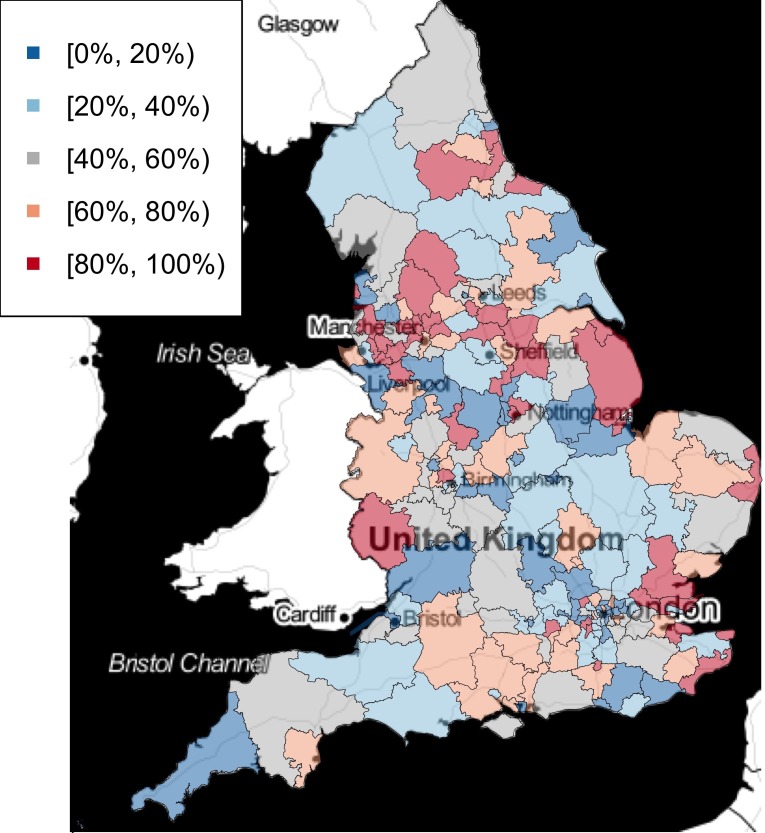
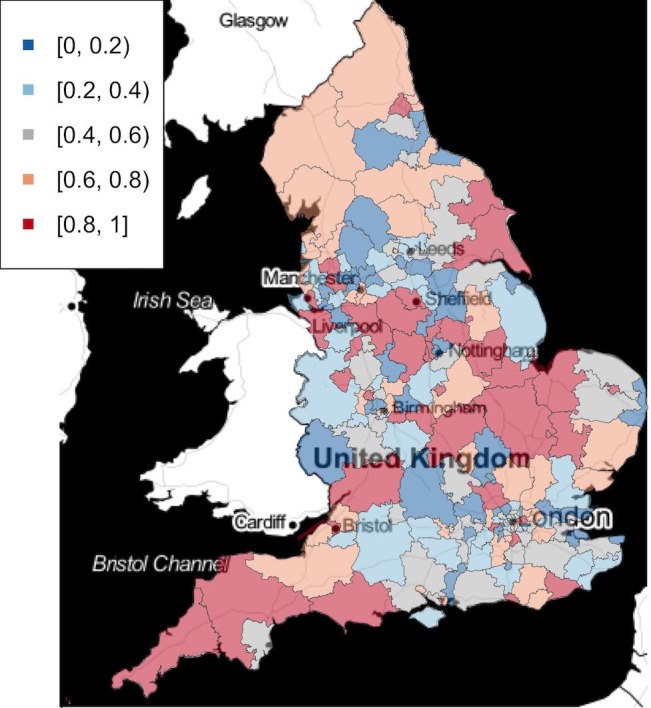
Results: Adjusting for deprivation, a North-South divide is shown in terms of prescribing trends, with the North of England showing increasing prescribing rates during the study period on average, while in the South of England rates are on average decreasing. Approximately 60% of general practices showed increasing prescribing rate, with the highest being 4.03 (1.75 for the most decreasing). There were no apparent spatial patterns in baseline prescription rates at the CCG level. Weighted IMD score proved to be statistically significant in 138 of 207 CCGs. Two-thirds of CCGs showed more pregabalin prescribed in areas of greater deprivation. Whether the prescribing rate is high due to high baseline prescription rate or increasing rates needs to be specifically looked at.
Conclusions: The spatial temporal modelling demonstrated that the North of England has a significantly higher chance to see increase in pregablin prescriptions compared with the South, adjusted for weighted IMD. Weighted IMD has shown positive impact on pregabalin prescriptions for 138 CCGs.
Keywords: NHS prescribing data; epidemiology; pregabalin; primary care; spatio-temporal mapping.
© Author(s) (or their employer(s)) 2020. Re-use permitted under CC BY-NC. No commercial re-use. See rights and permissions. Published by BMJ.
Conflict of interest statement
Competing interests: None declared.
Figures
References
-
- National Institute for Health and Care Excellence Neuropathic pain in adults: pharmacological management in non-specialist settings, 2013. Available: http://guidance.nice.org.uk/CG173 [Accessed Jan 2018]. - PubMed
MeSH terms
Substances
LinkOut - more resources
Full Text Sources