

Racial disparities in automated speech recognition
- PMID: 32205437
- PMCID: PMC7149386
- DOI: 10.1073/pnas.1915768117
Racial disparities in automated speech recognition
Abstract
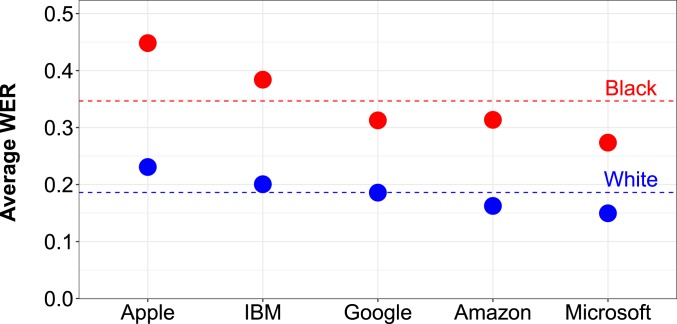
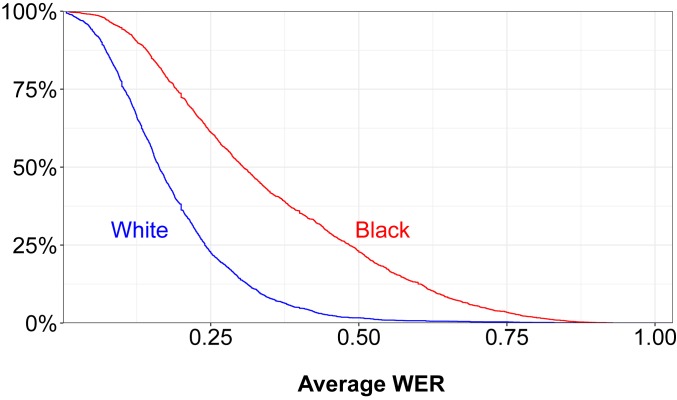
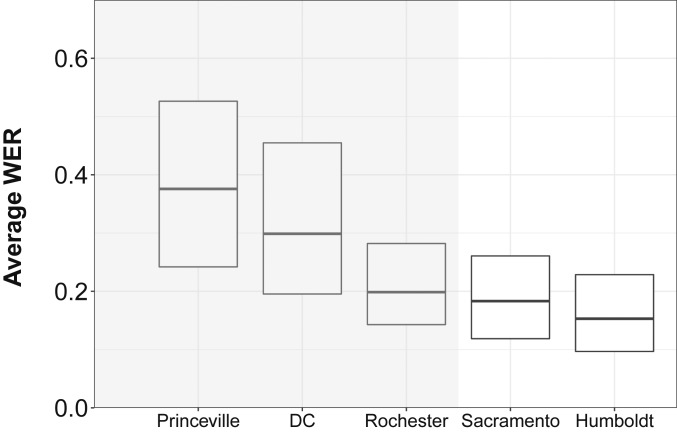
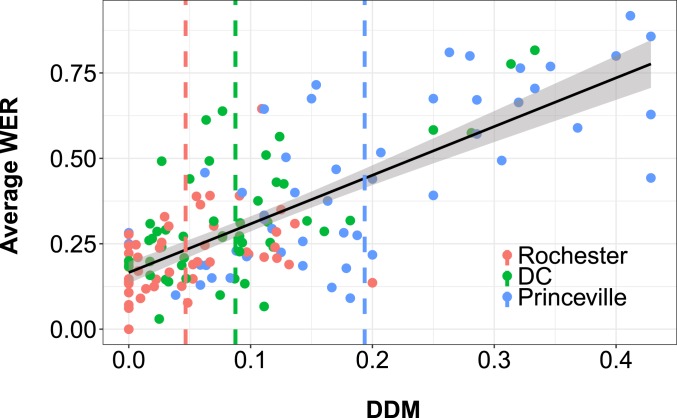
Automated speech recognition (ASR) systems, which use sophisticated machine-learning algorithms to convert spoken language to text, have become increasingly widespread, powering popular virtual assistants, facilitating automated closed captioning, and enabling digital dictation platforms for health care. Over the last several years, the quality of these systems has dramatically improved, due both to advances in deep learning and to the collection of large-scale datasets used to train the systems. There is concern, however, that these tools do not work equally well for all subgroups of the population. Here, we examine the ability of five state-of-the-art ASR systems-developed by Amazon, Apple, Google, IBM, and Microsoft-to transcribe structured interviews conducted with 42 white speakers and 73 black speakers. In total, this corpus spans five US cities and consists of 19.8 h of audio matched on the age and gender of the speaker. We found that all five ASR systems exhibited substantial racial disparities, with an average word error rate (WER) of 0.35 for black speakers compared with 0.19 for white speakers. We trace these disparities to the underlying acoustic models used by the ASR systems as the race gap was equally large on a subset of identical phrases spoken by black and white individuals in our corpus. We conclude by proposing strategies-such as using more diverse training datasets that include African American Vernacular English-to reduce these performance differences and ensure speech recognition technology is inclusive.
Keywords: fair machine learning; natural language processing; speech-to-text.
Copyright © 2020 the Author(s). Published by PNAS.
Conflict of interest statement
The authors declare no competing interest.
Figures
References
-
- Tatman R., “Gender and dialect bias in YouTube’s automatic captions” in Proceedings of the First ACL Workshop on Ethics in Natural Language Processing, Hovy D., et al., Eds. (Association for Computational Linguistics, 2017), pp. 53–59.
-
- Tatman R., Kasten C., “Effects of talker dialect, gender & race on accuracy of Bing speech and YouTube automatic captions” in INTERSPEECH, Lacerda F., et al., Eds. (International Speech Communication Association, 2017), pp. 934–938.
-
- Harwell D., Mayes B., Walls M., Hashemi S., The accent gap. The Washington Post, 19 July 2018. https://www.washingtonpost.com/graphics/2018/business/alexa-does-not-und.... Accessed 28 February 2020.
-
- Kitashov F., Svitanko E., Dutta D., Foreign English accent adjustment by learning phonetic patterns. arXiv:1807.03625 (9 July 2018).
-
- Buolamwini J., Gebru T., “Gender shades: Intersectional accuracy disparities in commercial gender classification” in Proceedings of the Conference on Fairness, Accountability and Transparency, Friedler S. A., Wilson C., Eds. (Association for Computing Machinery, New York, NY, 2018), pp. 77–91.
MeSH terms
LinkOut - more resources
Full Text Sources
Other Literature Sources
Miscellaneous
