Review
. 2020 May;27(3):114-163.
doi: 10.1097/PAP.0000000000000256.

An Algorithmic Immunohistochemical Approach to Define Tumor Type and Assign Site of Origin

Affiliations
Review

An Algorithmic Immunohistochemical Approach to Define Tumor Type and Assign Site of Origin

Andrew M Bellizzi. Adv Anat Pathol. 2020 May.

Abstract

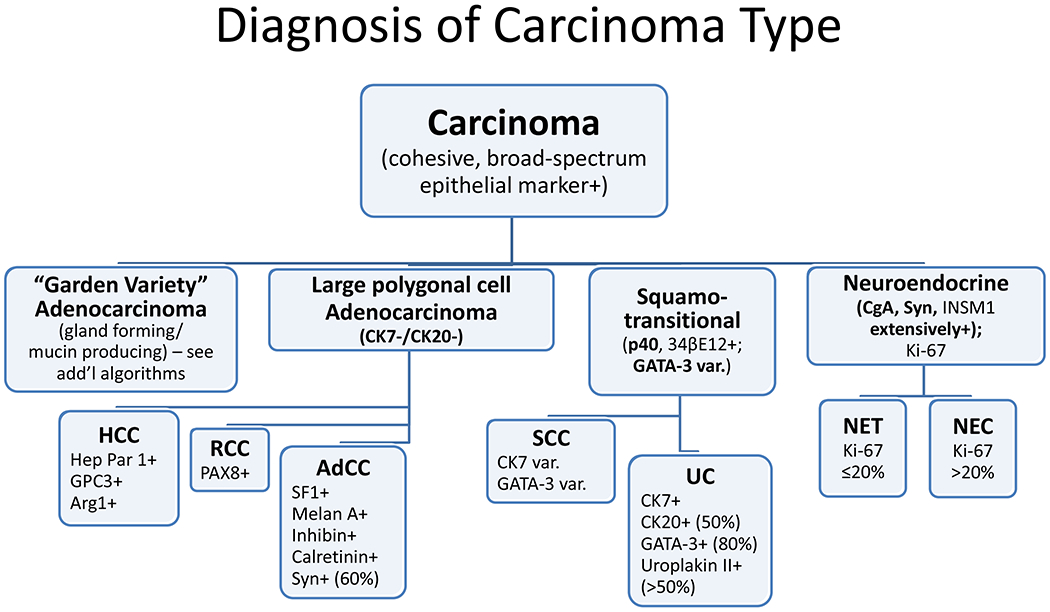
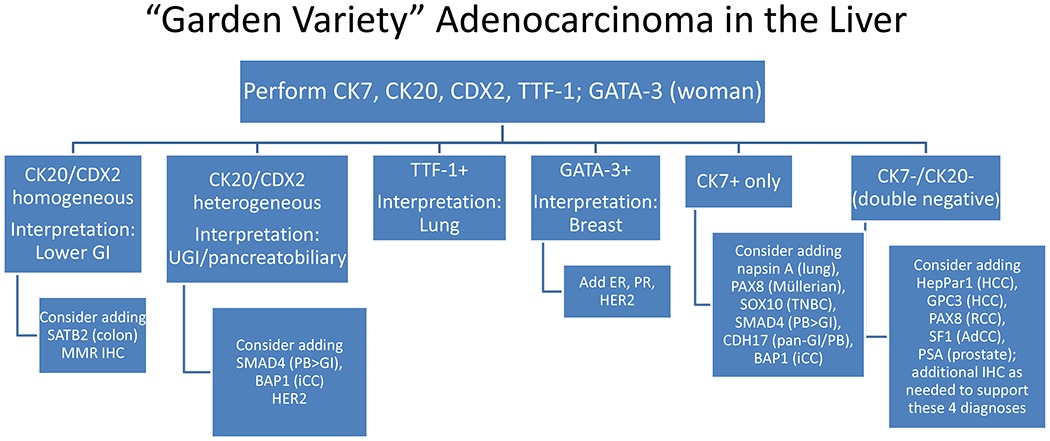
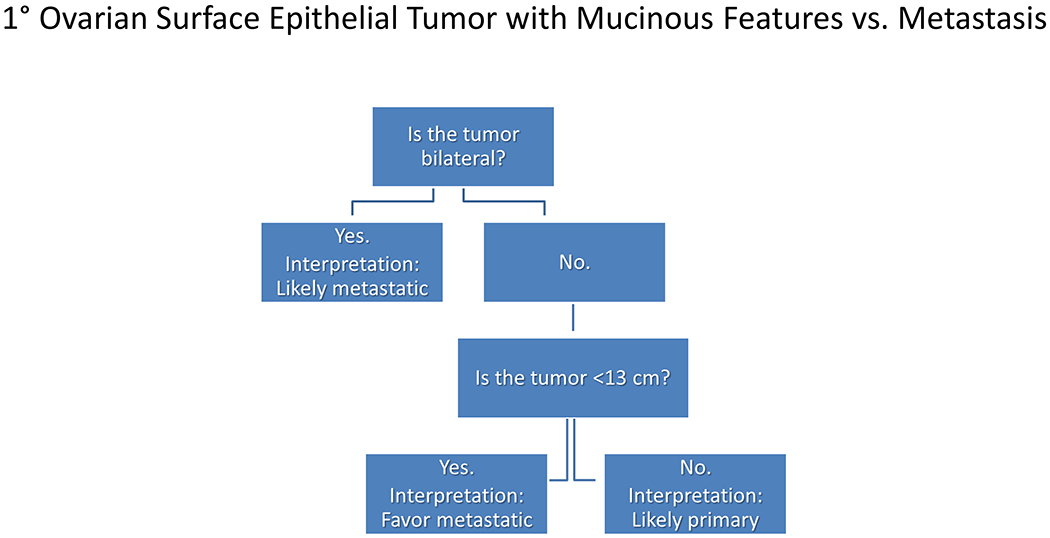
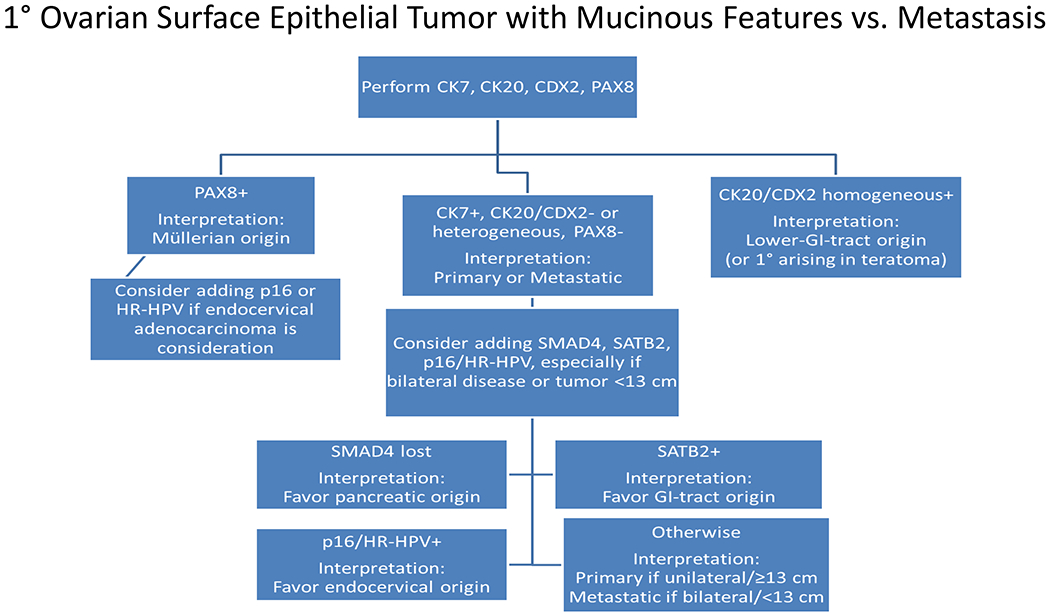
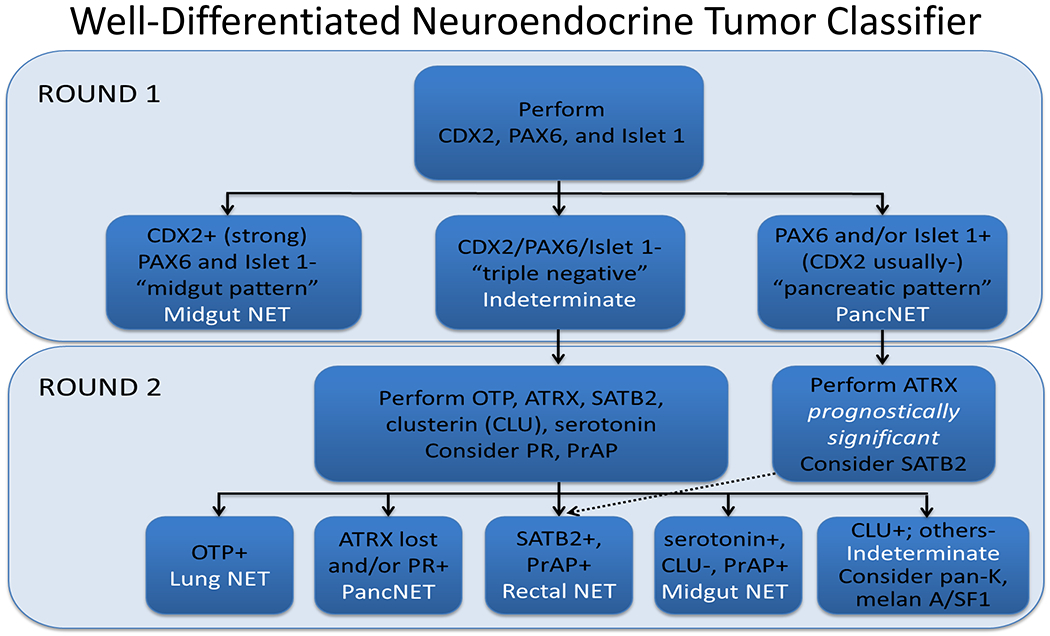
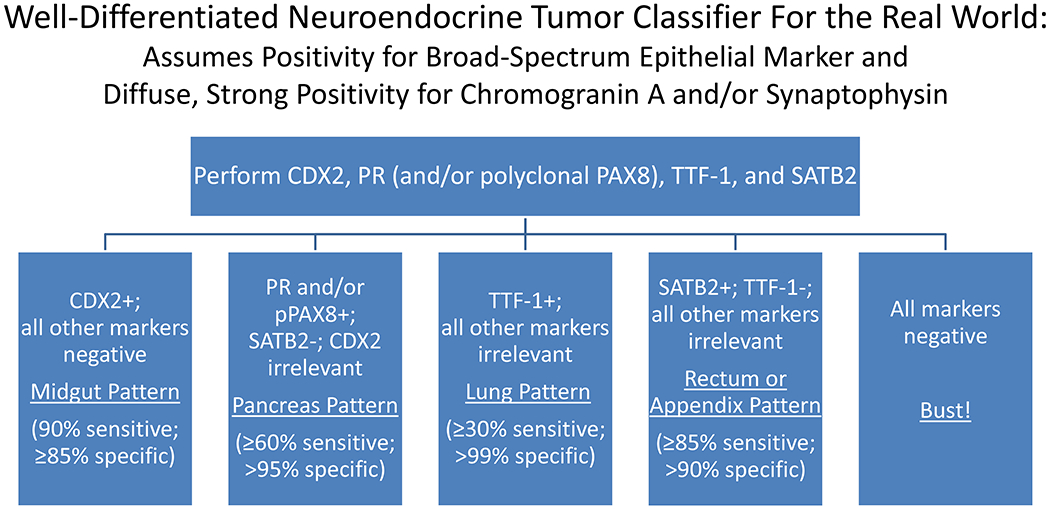
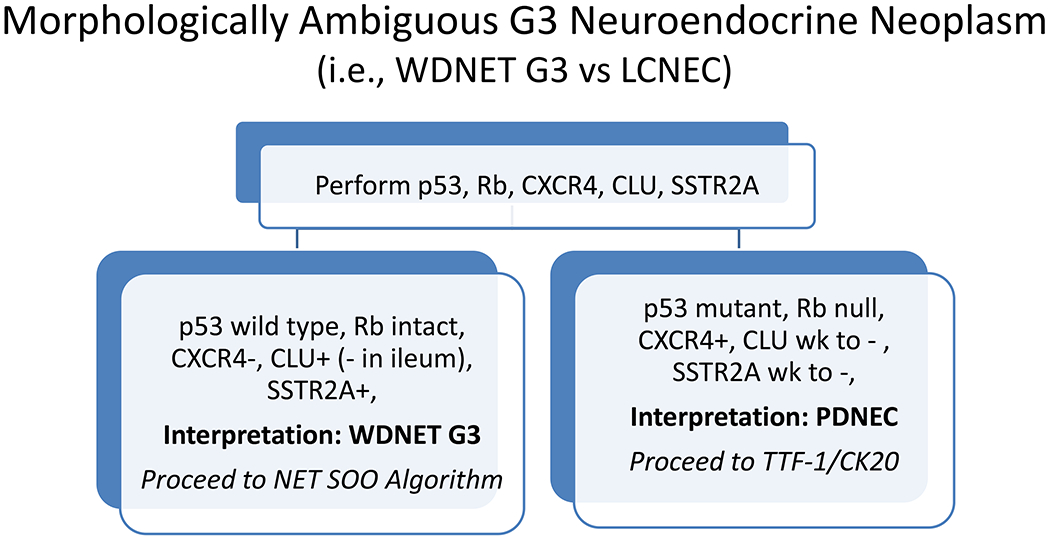
Immunohistochemistry represents an indispensable complement to an epidemiology and morphology-driven approach to tumor diagnosis and site of origin assignment. This review reflects the state of my current practice, based on 15-years' experience in Pathology and a deep-dive into the literature, always striving to be better equipped to answer the age old questions, "What is it, and where is it from?" The tables and figures in this manuscript are the ones I "pull up on the computer" when I am teaching at the microscope and turn to myself when I am (frequently) stuck. This field is so exciting because I firmly believe that, through the application of next-generation immunohistochemistry, we can provide better answers than ever before. Specific topics covered in this review include (1) broad tumor classification and associated screening markers; (2) the role of cancer epidemiology in determining pretest probability; (3) broad-spectrum epithelial markers; (4) noncanonical expression of broad tumor class screening markers; (5) a morphologic pattern-based approach to poorly to undifferentiated malignant neoplasms; (6) a morphologic and immunohistochemical approach to define 4 main carcinoma types; (7) CK7/CK20 coordinate expression; (8) added value of semiquantitative immunohistochemical stain assessment; algorithmic immunohistochemical approaches to (9) "garden variety" adenocarcinomas presenting in the liver, (10) large polygonal cell adenocarcinomas, (11) the distinction of primary surface ovarian epithelial tumors with mucinous features from metastasis, (12) tumors presenting at alternative anatomic sites, (13) squamous cell carcinoma versus urothelial carcinoma, and neuroendocrine neoplasms, including (14) the distinction of pheochromocytoma/paraganglioma from well-differentiated neuroendocrine tumor, site of origin assignment in (15) well-differentiated neuroendocrine tumor and (16) poorly differentiated neuroendocrine carcinoma, and (17) the distinction of well-differentiated neuroendocrine tumor G3 from poorly differentiated neuroendocrine carcinoma; it concludes with (18) a discussion of diagnostic considerations in the broad-spectrum keratin/CD45/S-100-"triple-negative" neoplasm.


Figures

Figure 1:
Figure 1:
Algorithmic Approach to Diagnosis of Four Carcinoma Types Key: HCC, hepatocellular carcinoma; RCC, renal cell carcinoma; AdCC, adrenal cortical carcinoma; SCC, squamous cell carcinoma; UC, urothelial carcinoma; NET, well-differentiated neuroendocrine tumor; NEC, poorly differentiated neuroendocrine carcinoma; CgA, chromogranin A; Syn, synaptophysin; GPC3, glypican-3; Arg1, arginase-1;
Figure 2:
Figure 2:
Immunohistochemical Algorithm for “Garden Variety” Adenocarcinoma in the Liver Key: GI, gastrointestinal; UGI, upper gastrointestinal; IHC, immunohistochemistry; PB, pancreatobiliary; iCC, intrahepatic cholangiocarcinoma; TNBC, triple-negative breast cancer; GPC3, glypican-3
Figure 3:
Figure 3:
Gross Algorithm for Primary Ovarian Surface Epithelial Tumor vs. Metastasis
Figure 4:
Figure 4:
Immunohistochemical Algorithm for Primary Ovarian Surface Epithelial Tumor with Mucinous Features vs. Metastasis
Figure 5:
Figure 5:
University of Iowa Immunohistochemical Algorithm for Well-Differentiated Neuroendocrine Tumor Site of Origin
Figure 6:
Figure 6:
Simplified Immunohistochemical Algorithm for Well-Differentiated Neuroendocrine Tumor Site of Origin
Figure 7:
Figure 7:
Immunohistochemical Algorithm for Morphologically Ambiguous G3 Neuroendocrine Epithelial Neoplasms
Image 1.
Image 1.
SATB2 as Exemplar Oligospecific Lineage-Restricted Transcription Factor: (A) Mucinous adenocarcinoma of the ampulla demonstrates (B) homogenous CDX2 expression (left half of image) but is SATB2-negative (right) arguing against a lower GI origin. (C) Medullary carcinoma of colonic origin (D) expresses SATB2 more frequently than CDX2. (E) The presence of osteoblastic differentiation is confirmed in the setting of (F) strong, uniform SATB2-positivity. (G) Rectal neuroendocrine tumors are almost always (H) SATB2-positive. (I) Among poorly differentiated neuroendocrine carcinomas, (J) diffuse, strong SATB2-positivity supports a cutaneous origin.
Image 1.
Image 1.
SATB2 as Exemplar Oligospecific Lineage-Restricted Transcription Factor: (A) Mucinous adenocarcinoma of the ampulla demonstrates (B) homogenous CDX2 expression (left half of image) but is SATB2-negative (right) arguing against a lower GI origin. (C) Medullary carcinoma of colonic origin (D) expresses SATB2 more frequently than CDX2. (E) The presence of osteoblastic differentiation is confirmed in the setting of (F) strong, uniform SATB2-positivity. (G) Rectal neuroendocrine tumors are almost always (H) SATB2-positive. (I) Among poorly differentiated neuroendocrine carcinomas, (J) diffuse, strong SATB2-positivity supports a cutaneous origin.
Image 2.
Image 2.
SOX10 vs. S-100 in Melanoma: (A) This large round cell malignant neoplasm with prominent neutrophilic stroma was referred to me for evaluation as it was broad-spectrum keratin/CD45/S-100 “triple-negative.” (B) In retrospect, the S-100 shows rare tumor cells with weak cytoplasmic and absent nuclear staining. (C) SOX10 demonstrates diffuse, strong nuclear staining, supporting a diagnosis of melanoma, which was corroborated with other melanoma differentiation markers.
Image 2.
Image 2.
SOX10 vs. S-100 in Melanoma: (A) This large round cell malignant neoplasm with prominent neutrophilic stroma was referred to me for evaluation as it was broad-spectrum keratin/CD45/S-100 “triple-negative.” (B) In retrospect, the S-100 shows rare tumor cells with weak cytoplasmic and absent nuclear staining. (C) SOX10 demonstrates diffuse, strong nuclear staining, supporting a diagnosis of melanoma, which was corroborated with other melanoma differentiation markers.
Image 3.
Image 3.
Vimentin Expression in Non-Sarcomas: (A) Melanoma and (C) Burkitt lymphoma express vimentin (B and D, respectively). Vimentin immunohistochemistry has limited diagnostic utility.
Image 3.
Image 3.
Vimentin Expression in Non-Sarcomas: (A) Melanoma and (C) Burkitt lymphoma express vimentin (B and D, respectively). Vimentin immunohistochemistry has limited diagnostic utility.
Image 3.
Image 3.
Vimentin Expression in Non-Sarcomas: (A) Melanoma and (C) Burkitt lymphoma express vimentin (B and D, respectively). Vimentin immunohistochemistry has limited diagnostic utility.
Image 3.
Image 3.
Vimentin Expression in Non-Sarcomas: (A) Melanoma and (C) Burkitt lymphoma express vimentin (B and D, respectively). Vimentin immunohistochemistry has limited diagnostic utility.
Image 4.
Image 4.
Broad-Spectrum Epithelial Markers: (A) Well-differentiated neuroendocrine tumor of lung origin demonstrating (B) diffuse, though weak keratin AE1/AE3, (C) absent EMA, (D) moderate MOC-31, and (E) diffuse, strong Ber-EP4 staining. It is important to have multiple broad-spectrum epithelial markers at one’s disposal.
Image 4.
Image 4.
Broad-Spectrum Epithelial Markers: (A) Well-differentiated neuroendocrine tumor of lung origin demonstrating (B) diffuse, though weak keratin AE1/AE3, (C) absent EMA, (D) moderate MOC-31, and (E) diffuse, strong Ber-EP4 staining. It is important to have multiple broad-spectrum epithelial markers at one’s disposal.
Image 5.
Image 5.
Broad-Spectrum Epithelial Marker Expression by Sarcoma: (A) I initially misdiagnosed this epitheloid angiosarcoma presenting in the mediastinum as poorly differentiated non-small cell lung carcinoma, (B) based in part, on this keratin AE1/AE3; repeat biopsy demonstrated more obvious vasoformative areas, and I confirmed the diagnosis with ERG (C). (D) This epithelioid malignant neoplasm presenting in the proximal thigh was initially misdiagnosed as metastatic carcinoma based on diffuse, strong EMA-positivity (E); (F) INI1/SMARCB1 loss supports the correct interpretation of epithelioid sarcoma. (G) This undifferentiated malignant neoplasm with osteoclast-like giant cells was initially misdiagnosed a sarcomatoid carcinoma based on this keratin AE1/AE3 (H). (I) Resection demonstrated an abrupt transition from a well-differentiated cartilaginous neoplasm to undifferentiated malignant neoplasm, diagnostic of dedifferentiated chondrosarcoma. (J) Leiomyosarcoma co-expressing keratin AE1/AE1 (K) and SMSA (L).
Image 5.
Image 5.
Broad-Spectrum Epithelial Marker Expression by Sarcoma: (A) I initially misdiagnosed this epitheloid angiosarcoma presenting in the mediastinum as poorly differentiated non-small cell lung carcinoma, (B) based in part, on this keratin AE1/AE3; repeat biopsy demonstrated more obvious vasoformative areas, and I confirmed the diagnosis with ERG (C). (D) This epithelioid malignant neoplasm presenting in the proximal thigh was initially misdiagnosed as metastatic carcinoma based on diffuse, strong EMA-positivity (E); (F) INI1/SMARCB1 loss supports the correct interpretation of epithelioid sarcoma. (G) This undifferentiated malignant neoplasm with osteoclast-like giant cells was initially misdiagnosed a sarcomatoid carcinoma based on this keratin AE1/AE3 (H). (I) Resection demonstrated an abrupt transition from a well-differentiated cartilaginous neoplasm to undifferentiated malignant neoplasm, diagnostic of dedifferentiated chondrosarcoma. (J) Leiomyosarcoma co-expressing keratin AE1/AE1 (K) and SMSA (L).
Image 6.
Image 6.
p63 Expression by Diffuse Large B-cell Lymphoma: (A) This large lung tumor invaded the chest wall. Based on (B) p63-positivity and (C) TTF-1 negativity, I initially favored a diagnosis of sarcomatoid squamous cell carcinoma. When multiple broad-spectrum epithelial markers were negative, I grew suspicious of the diagnosis and ordered (D) CD45, which ultimately led to the correct diagnosis of diffuse large B-cell lymphoma. I consider p63 immunohistochemistry to be “too dangerous for general consumption,” and for nearly all diagnostic applications p40 should be used instead.
Image 6.
Image 6.
p63 Expression by Diffuse Large B-cell Lymphoma: (A) This large lung tumor invaded the chest wall. Based on (B) p63-positivity and (C) TTF-1 negativity, I initially favored a diagnosis of sarcomatoid squamous cell carcinoma. When multiple broad-spectrum epithelial markers were negative, I grew suspicious of the diagnosis and ordered (D) CD45, which ultimately led to the correct diagnosis of diffuse large B-cell lymphoma. I consider p63 immunohistochemistry to be “too dangerous for general consumption,” and for nearly all diagnostic applications p40 should be used instead.
Image 7.
Image 7.
Immunohistochemical Work Up of a Broad-Spectrum Epithelial Marker/S-100-Co-Expressing Tumor: (A) This epithelioid malignant neoplasm presented in the temporal lobe of an elderly man. Initial work up demonstrated positivity for (B) pan-keratin and (C) S-100. I was consulted to work up the site of origin of this presumed carcinoma. I was struck by the extent of S-100-positivity and confirmed the diagnosis of melanoma with (D) melan A, (E) HMB-45, and (F) MiTF. Up to a quarter of metastatic melanomas express broad-spectrum epithelial markers, which may lead to significant diagnostic confusion.
Image 7.
Image 7.
Immunohistochemical Work Up of a Broad-Spectrum Epithelial Marker/S-100-Co-Expressing Tumor: (A) This epithelioid malignant neoplasm presented in the temporal lobe of an elderly man. Initial work up demonstrated positivity for (B) pan-keratin and (C) S-100. I was consulted to work up the site of origin of this presumed carcinoma. I was struck by the extent of S-100-positivity and confirmed the diagnosis of melanoma with (D) melan A, (E) HMB-45, and (F) MiTF. Up to a quarter of metastatic melanomas express broad-spectrum epithelial markers, which may lead to significant diagnostic confusion.
Image 8.
Image 8.
E-cadherin Expression by Melanoma: (A) I recently learned that melanomas frequently express (B) E-cadherin, which normally functions to anchor non-neoplastic melanocytes to basal keratinocytes. (C) SOX10 in this case.
Image 8.
Image 8.
E-cadherin Expression by Melanoma: (A) I recently learned that melanomas frequently express (B) E-cadherin, which normally functions to anchor non-neoplastic melanocytes to basal keratinocytes. (C) SOX10 in this case.
Image 8.
Image 8.
E-cadherin Expression by Melanoma: (A) I recently learned that melanomas frequently express (B) E-cadherin, which normally functions to anchor non-neoplastic melanocytes to basal keratinocytes. (C) SOX10 in this case.
Image 9.
Image 9.
SOX10 Expression by Triple-Negative Breast Cancer: (A) Triple-negative breast cancers can be negative for (B) GATA-3, and, even when they are positive, expression is often weak, overlapping with the “non-specific” expression seen in other tumor types. (C) SOX10 is expressed by 60% of triple-negative cancers, typically in diffuse, strong fashion, which I have found to be complementary to GATA-3 in securing this diagnosis.
Image 9.
Image 9.
SOX10 Expression by Triple-Negative Breast Cancer: (A) Triple-negative breast cancers can be negative for (B) GATA-3, and, even when they are positive, expression is often weak, overlapping with the “non-specific” expression seen in other tumor types. (C) SOX10 is expressed by 60% of triple-negative cancers, typically in diffuse, strong fashion, which I have found to be complementary to GATA-3 in securing this diagnosis.
Image 10.
Image 10.
Morphologic Pattern-Based Approach to Tumor Diagnosis: Undifferentiated malignant neoplasms may demonstrate one or more of the following patterns (A) epithelioid, (B) round cell, (C) spindle cell, and (D) anaplastic. An initial immunohistochemical screening panel for each of this patterns is provided in Table 7.
Image 10.
Image 10.
Morphologic Pattern-Based Approach to Tumor Diagnosis: Undifferentiated malignant neoplasms may demonstrate one or more of the following patterns (A) epithelioid, (B) round cell, (C) spindle cell, and (D) anaplastic. An initial immunohistochemical screening panel for each of this patterns is provided in Table 7.
Image 11.
Image 11.
Homogeneous vs. Heterogeneous CDX2 Expression: (A) Homogeneous (i.e., diffuse, strong) CDX2 expression is typical of lower GI tumors (i.e., appendiceal mucinous neoplasm and adenocarcinoma and colorectal adenocarcinoma), while (B) heterogeneous (i.e., any staining less than homogeneous) expression is typical of upper GI, pancreatobiliary, and primary mucinous ovarian tumors.
Image 11.
Image 11.
Homogeneous vs. Heterogeneous CDX2 Expression: (A) Homogeneous (i.e., diffuse, strong) CDX2 expression is typical of lower GI tumors (i.e., appendiceal mucinous neoplasm and adenocarcinoma and colorectal adenocarcinoma), while (B) heterogeneous (i.e., any staining less than homogeneous) expression is typical of upper GI, pancreatobiliary, and primary mucinous ovarian tumors.
Image 12.
Image 12.
Weak, Patchy PAX8-Positivity Has No Diagnostic Value: (A) This lung adenocarcinoma was found to demonstrate (B) weak, patchy PAX8 expression when evaluated as an “expected negative” in a recent immunohistochemistry validation study in my laboratory. (C) Since TTF-1-positivity does not distinguish tumors of lung and thyroid origin, I also performed (D) thyroglobulin and (E) napsin A. Weak, patchy PAX8 (and GATA-3) staining is common and should not be “overinterpreted.”
Image 12.
Image 12.
Weak, Patchy PAX8-Positivity Has No Diagnostic Value: (A) This lung adenocarcinoma was found to demonstrate (B) weak, patchy PAX8 expression when evaluated as an “expected negative” in a recent immunohistochemistry validation study in my laboratory. (C) Since TTF-1-positivity does not distinguish tumors of lung and thyroid origin, I also performed (D) thyroglobulin and (E) napsin A. Weak, patchy PAX8 (and GATA-3) staining is common and should not be “overinterpreted.”
Image 13.
Image 13.
Napsin A in Mullerian Clear Cell Carcinoma: (A) Mullerian clear cell carcinoma staining for (B) PAX8 and (C) napsin A. In addition to its value in lung cancer, I use napsin A to support a diagnosis of clear cell carcinoma among Mullerian tumors.
Image 13.
Image 13.
Napsin A in Mullerian Clear Cell Carcinoma: (A) Mullerian clear cell carcinoma staining for (B) PAX8 and (C) napsin A. In addition to its value in lung cancer, I use napsin A to support a diagnosis of clear cell carcinoma among Mullerian tumors.
Image 13.
Image 13.
Napsin A in Mullerian Clear Cell Carcinoma: (A) Mullerian clear cell carcinoma staining for (B) PAX8 and (C) napsin A. In addition to its value in lung cancer, I use napsin A to support a diagnosis of clear cell carcinoma among Mullerian tumors.
Image 14.
Image 14.
CDH17 as a Pan-Gastrointestinal Marker: (A) Pancreatobiliary-type ampullary adenocarcinoma stains for (B) CK7 and not (C) CK20 (or CDX2, not shown). (D) CDH17 demonstrates diffuse, strong membranous expression. CDH17 has shown superior sensitivity to CDX2 as a pan-GI marker, and I use it in “CK7+ only” adenocarcinomas to support a GI origin.
Image 14.
Image 14.
CDH17 as a Pan-Gastrointestinal Marker: (A) Pancreatobiliary-type ampullary adenocarcinoma stains for (B) CK7 and not (C) CK20 (or CDX2, not shown). (D) CDH17 demonstrates diffuse, strong membranous expression. CDH17 has shown superior sensitivity to CDX2 as a pan-GI marker, and I use it in “CK7+ only” adenocarcinomas to support a GI origin.
Image 15.
Image 15.
BAP1 Loss Supports a Diagnosis of Intrahepatic Cholangiocarcinoma: (A) This liver tumor was originally misinterpreted as a well-differentiated neuroendocrine tumor based on its organoid architecture and monomorphous cytomorphology. (B, C) Absent BAP1 nuclear staining, with intact staining in non-neoplastic hepatocytes and endothelium, supports the correct interpretation of intrahepatic cholangiocarcinoma. Up to 25% of intrahepatic cholangiocarcinomas are BAP1-inactivated.
Image 15.
Image 15.
BAP1 Loss Supports a Diagnosis of Intrahepatic Cholangiocarcinoma: (A) This liver tumor was originally misinterpreted as a well-differentiated neuroendocrine tumor based on its organoid architecture and monomorphous cytomorphology. (B, C) Absent BAP1 nuclear staining, with intact staining in non-neoplastic hepatocytes and endothelium, supports the correct interpretation of intrahepatic cholangiocarcinoma. Up to 25% of intrahepatic cholangiocarcinomas are BAP1-inactivated.
Image 16.
Image 16.
Immunohistochemical Work Up of Squamous Cell vs. Urothelial Carcinoma: (A) This tumor in the rectum was initially diagnosed as a squamous cell carcinoma based on the combination of (B) positive p40 and (D) negative CK20 staining. (C) CK7 staining was also performed. (E) I added a GATA-3, which demonstrates diffuse, moderate-to-strong staining. Although anogenitourinary squamous cell carcinomas can express GATA-3, the extent of staining in this case is most in keeping with urothelial carcinoma, and, in fact, this patient had a history of bladder cancer. CK20 staining is only seen in 50% of urothelial carcinomas, and CK7 staining is more common in urothelial (>90%) than squamous cell (30%) carcinoma. Uroplakin II (or S100P)-positivity would also support a diagnosis of urothelial carcinoma.
Image 16.
Image 16.
Immunohistochemical Work Up of Squamous Cell vs. Urothelial Carcinoma: (A) This tumor in the rectum was initially diagnosed as a squamous cell carcinoma based on the combination of (B) positive p40 and (D) negative CK20 staining. (C) CK7 staining was also performed. (E) I added a GATA-3, which demonstrates diffuse, moderate-to-strong staining. Although anogenitourinary squamous cell carcinomas can express GATA-3, the extent of staining in this case is most in keeping with urothelial carcinoma, and, in fact, this patient had a history of bladder cancer. CK20 staining is only seen in 50% of urothelial carcinomas, and CK7 staining is more common in urothelial (>90%) than squamous cell (30%) carcinoma. Uroplakin II (or S100P)-positivity would also support a diagnosis of urothelial carcinoma.
Image 17.
Image 17.
Non-Neuroendocrine Carcinoma with Occult Neuroendocrine Differentiation: (A) This undifferentiated colon cancer was initially diagnosed as “poorly differentiated carcinoma with neuroendocrine features” based on this chromogranin A (B); (C) MLH1 immunostain highlights the correct diagnosis of MSI-H undifferentiated colon cancer. (D) Breast cancer with occult neuroendocrine differentiation with staining for synaptophysin (E) and GATA-3 (F). I found this breast cancer by screening tissue microarrays with chromogranin A and synaptophysin; 4% of 105 tumors demonstrated this extent of positivity. These tumors should be diagnosed and managed as non-neuroendocrine carcinomas.
Image 17.
Image 17.
Non-Neuroendocrine Carcinoma with Occult Neuroendocrine Differentiation: (A) This undifferentiated colon cancer was initially diagnosed as “poorly differentiated carcinoma with neuroendocrine features” based on this chromogranin A (B); (C) MLH1 immunostain highlights the correct diagnosis of MSI-H undifferentiated colon cancer. (D) Breast cancer with occult neuroendocrine differentiation with staining for synaptophysin (E) and GATA-3 (F). I found this breast cancer by screening tissue microarrays with chromogranin A and synaptophysin; 4% of 105 tumors demonstrated this extent of positivity. These tumors should be diagnosed and managed as non-neuroendocrine carcinomas.
Image 18.
Image 18.
Immunohistochemical Features of Pheochromocytoma/Paraganglioma: (A) This metastatic paraganglioma expresses (B) GATA-3, while (C) SDHB expression is absent (note intact staining in endothelium). (D) In this case, absent tyrosine hydroxylase staining supports a diagnosis of paraganglioma over pheochromocytoma, although 40% of paragangliomas are tyrosine hydroxylase-positive. SDH-deficiency in this case raises the possibility of hereditary paraganglioma-pheochromocytoma.
Image 18.
Image 18.
Immunohistochemical Features of Pheochromocytoma/Paraganglioma: (A) This metastatic paraganglioma expresses (B) GATA-3, while (C) SDHB expression is absent (note intact staining in endothelium). (D) In this case, absent tyrosine hydroxylase staining supports a diagnosis of paraganglioma over pheochromocytoma, although 40% of paragangliomas are tyrosine hydroxylase-positive. SDH-deficiency in this case raises the possibility of hereditary paraganglioma-pheochromocytoma.
Image 19.
Image 19.
Morphologic Clues to Well-Differentiated Neuroendocrine Tumor Site of Origin: (A) Midgut tumors demonstrate predominantly nested architecture, often with a secondary pseudoglandular growth pattern; serotonin granules may be conspicuous, as in this example. (B) Rectal tumors are often trabecular, with the cords typically folding back upon themselves like a paperclip. (C) Somatostatin-expressing periampullary tumors generally demonstrate extensive pseudoglandular architecture and are, thus, apt to be misdiagnosed as adenocarcinoma, especially in crushed, small biopsies. Pancreatic tumors demonstrate a range of morphologies including (D) nested, (E) trabecular, and (F) pseudoglandular. (G) Metastatic bronchopulmonary tumors often demonstrate spindle cell morphology.
Image 19.
Image 19.
Morphologic Clues to Well-Differentiated Neuroendocrine Tumor Site of Origin: (A) Midgut tumors demonstrate predominantly nested architecture, often with a secondary pseudoglandular growth pattern; serotonin granules may be conspicuous, as in this example. (B) Rectal tumors are often trabecular, with the cords typically folding back upon themselves like a paperclip. (C) Somatostatin-expressing periampullary tumors generally demonstrate extensive pseudoglandular architecture and are, thus, apt to be misdiagnosed as adenocarcinoma, especially in crushed, small biopsies. Pancreatic tumors demonstrate a range of morphologies including (D) nested, (E) trabecular, and (F) pseudoglandular. (G) Metastatic bronchopulmonary tumors often demonstrate spindle cell morphology.
Image 20.
Image 20.
TTF-1 and CK20 in Poorly Differentiated Neuroendocrine Carcinoma: (A) Small cell lung cancer demonstrating homogenous TTF-1 expression (B) and CK20-negativity (C). (D) Merkel cell carcinoma demonstrating TTF-1-negativity (E) and CK20-positivity (F). TTF-1-positivitiy is seen in 80-90% of small cell lung carcinomas, 40% of extrapulmonary visceral small cell carcinomas, and only rarely (and weakly) in Merkel cell carcinoma. In contrast, 90% of Merkel cell carcinomas express CK20, while they only rarely (and weakly) express TTF-1. Other than frequent expression by carcinomas of major salivary gland origin (60%), CK20-positivity is fairly specific for Merkel cell carcinoma.
Image 20.
Image 20.
TTF-1 and CK20 in Poorly Differentiated Neuroendocrine Carcinoma: (A) Small cell lung cancer demonstrating homogenous TTF-1 expression (B) and CK20-negativity (C). (D) Merkel cell carcinoma demonstrating TTF-1-negativity (E) and CK20-positivity (F). TTF-1-positivitiy is seen in 80-90% of small cell lung carcinomas, 40% of extrapulmonary visceral small cell carcinomas, and only rarely (and weakly) in Merkel cell carcinoma. In contrast, 90% of Merkel cell carcinomas express CK20, while they only rarely (and weakly) express TTF-1. Other than frequent expression by carcinomas of major salivary gland origin (60%), CK20-positivity is fairly specific for Merkel cell carcinoma.
Image 21.
Image 21.
Poorly Differentiated Neuroendocrine Carcinomas Demonstrate Marked Transcription Factor Lineage Infidelity: (A) This small cell carcinoma of endometrial origin was found to express (B) p63, (C) CDX2, (D) c-Myc, (E) SALL4, and (F) PAX8, among others. Note that the PAX8-positvity is no more extensive than positivity for any of the other markers. Poorly differentiated neuroendocrine carcinomas tend to express multiple transcription factors independent of site of origin.
Image 21.
Image 21.
Poorly Differentiated Neuroendocrine Carcinomas Demonstrate Marked Transcription Factor Lineage Infidelity: (A) This small cell carcinoma of endometrial origin was found to express (B) p63, (C) CDX2, (D) c-Myc, (E) SALL4, and (F) PAX8, among others. Note that the PAX8-positvity is no more extensive than positivity for any of the other markers. Poorly differentiated neuroendocrine carcinomas tend to express multiple transcription factors independent of site of origin.
Image 22.
Image 22.
Merkel Cell Carcinoma Polyomavirus Large T Antigen Expression in Merkel Cell Carcinoma: CM2B4-positivity in the Merkel cell carcinoma illustrated in Image 20D. Merkel cell carcinoma polyomavirus-positivity is seen in >75% of non-Australian tumors. It tends to correlate with CK20-positivity, which somewhat limits its diagnostic value.
Image 23.
Image 23.
p53 and Rb Immunohistochemistry in Poorly Differentiated Neuroendocrine Carcinoma: (A) Small cell lung cancer demonstrating (B) null pattern p53 staining and (C) loss of Rb protein staining. Biallelic inactivation of TP53 and RB1 is the molecular genetic hallmark of small cell lung cancer and is frequently seen in extrapulmonary visceral small cell carcinomas, as well. Although null pattern p53 staining is shown in this example, missense and gain-of-function mutations, resulting in diffuse, strong p53 staining, predominate in small cell lung cancer on the order of 3-4:1.
Image 23.
Image 23.
p53 and Rb Immunohistochemistry in Poorly Differentiated Neuroendocrine Carcinoma: (A) Small cell lung cancer demonstrating (B) null pattern p53 staining and (C) loss of Rb protein staining. Biallelic inactivation of TP53 and RB1 is the molecular genetic hallmark of small cell lung cancer and is frequently seen in extrapulmonary visceral small cell carcinomas, as well. Although null pattern p53 staining is shown in this example, missense and gain-of-function mutations, resulting in diffuse, strong p53 staining, predominate in small cell lung cancer on the order of 3-4:1.
Image 24.
Image 24.
Triple-Negative Malignant Neoplasm: (A) This large nasal cavity mass was referred to me as it was (B) keratin AE1/AE3, (C) CD45, and (D) SOX10 “triple-negative.” (E) EMA-positivity led to my “aha (a hof?) moment,” and I requested a (F) CD138, (G) MUM1, and (H) kappa and (I) lambda light chains, supporting the diagnosis of anaplastic plasma cell neoplasm. This diagnosis led to a bone marrow examination, which demonstrated myeloma. EMA-positive/CD45-negative hematolymphoid neoplasms, including plasma cell neoplasm, anaplastic large cell lymphoma, ALK-positive large B-cell lymphoma, and plasmablastic lymphoma, are apt to be misdiagnosed as undifferentiated carcinoma. Before settling on a diagnosis of carcinoma in an “EMA+ only” neoplasm, a hematopathology work up directed at this differential is indicated.
Image 24.
Image 24.
Triple-Negative Malignant Neoplasm: (A) This large nasal cavity mass was referred to me as it was (B) keratin AE1/AE3, (C) CD45, and (D) SOX10 “triple-negative.” (E) EMA-positivity led to my “aha (a hof?) moment,” and I requested a (F) CD138, (G) MUM1, and (H) kappa and (I) lambda light chains, supporting the diagnosis of anaplastic plasma cell neoplasm. This diagnosis led to a bone marrow examination, which demonstrated myeloma. EMA-positive/CD45-negative hematolymphoid neoplasms, including plasma cell neoplasm, anaplastic large cell lymphoma, ALK-positive large B-cell lymphoma, and plasmablastic lymphoma, are apt to be misdiagnosed as undifferentiated carcinoma. Before settling on a diagnosis of carcinoma in an “EMA+ only” neoplasm, a hematopathology work up directed at this differential is indicated.

References

    1. McFarland M, Quick CM, McCluggage WG. Hormone receptor-negative, thyroid transcription factor 1-positive uterine and ovarian adenocarcinomas: report of a series of mesonephric-like adenocarcinomas. Histopathology. 2016;68(7):1013–20. - PubMed
    1. Pors J, Cheng A, Leo JM, Kinloch MA, Gilks B, Hoang L. A Comparison of GATA3, TTF1, CD10, and Calretinin in Identifying Mesonephric and Mesonephric-like Carcinomas of the Gynecologic Tract. The American journal of surgical pathology. 2018;42(12):1596–606. - PubMed
    1. Moriguchi T, Takako N, Hamada M, Maeda A, Fujioka Y, Kuroha T, et al. Gata3 participates in a complex transcriptional feedback network to regulate sympathoadrenal differentiation. Development. 2006;133(19):3871–81. - PubMed
    1. Rohrer H Transcriptional control of differentiation and neurogenesis in autonomic ganglia. The European journal of neuroscience. 2011;34(10):1563–73. - PubMed
    1. Miettinen M, McCue PA, Sarlomo-Rikala M, Rys J, Czapiewski P, Wazny K, et al. GATA3: a multispecific but potentially useful marker in surgical pathology: a systematic analysis of 2500 epithelial and nonepithelial tumors. The American journal of surgical pathology. 2014;38(1):13–22. - PMC - PubMed

Substances