. 2021 Jan;35(1):75-89.
doi: 10.1038/s41375-020-0792-2. Epub 2020 Mar 24.

CAR T-cells that target acute B-lineage leukemia irrespective of CD19 expression

Affiliations

CAR T-cells that target acute B-lineage leukemia irrespective of CD19 expression

Kristen Fousek et al. Leukemia. 2021 Jan.

Abstract

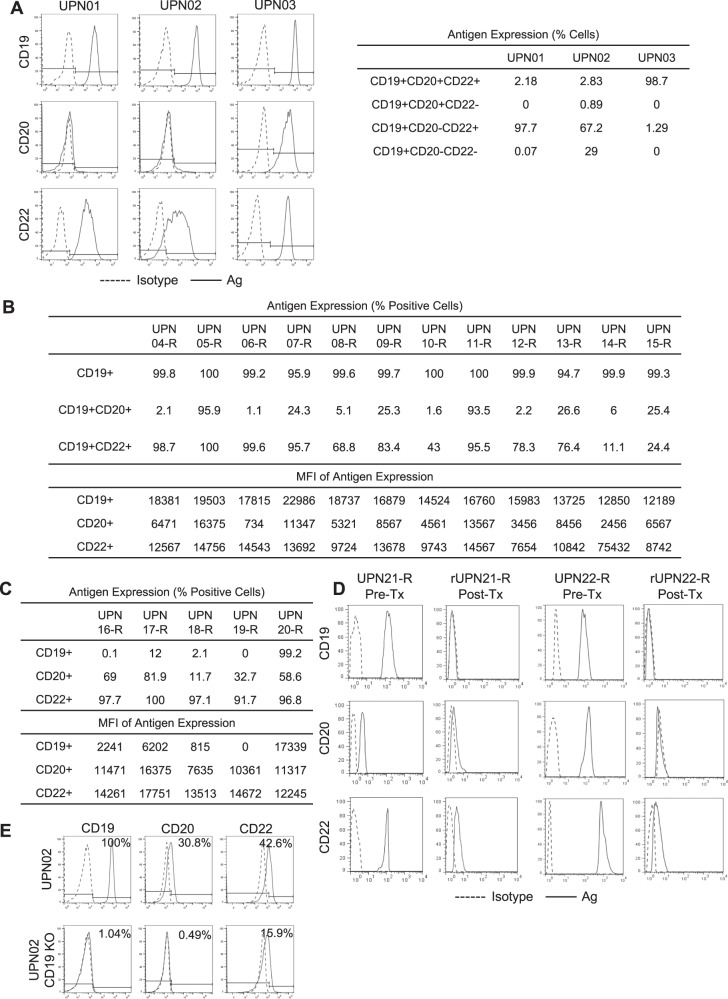
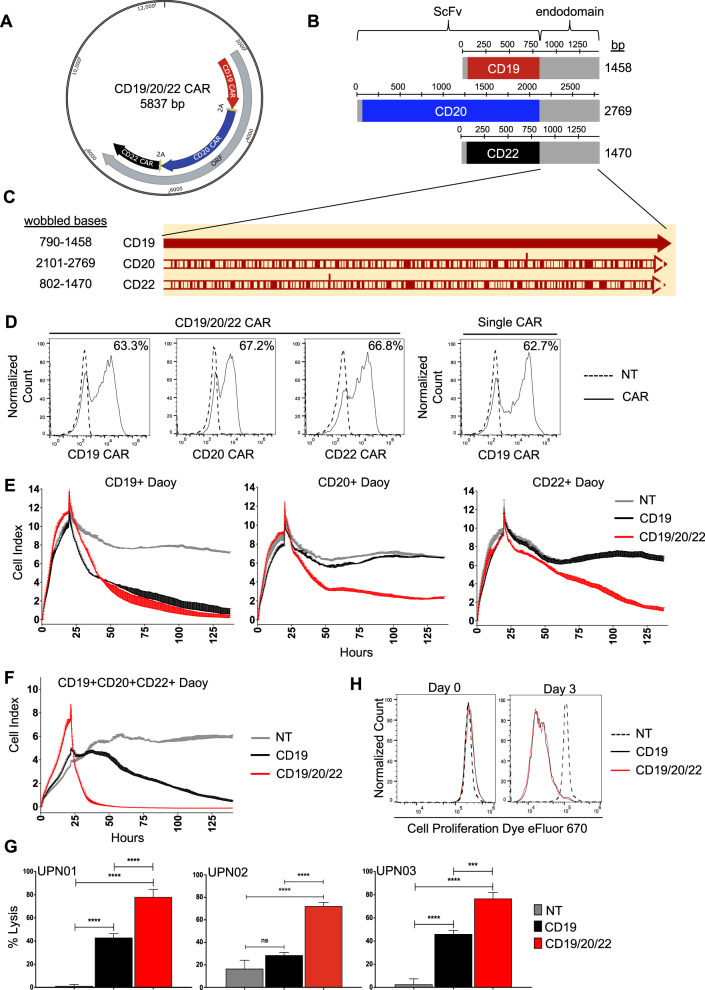
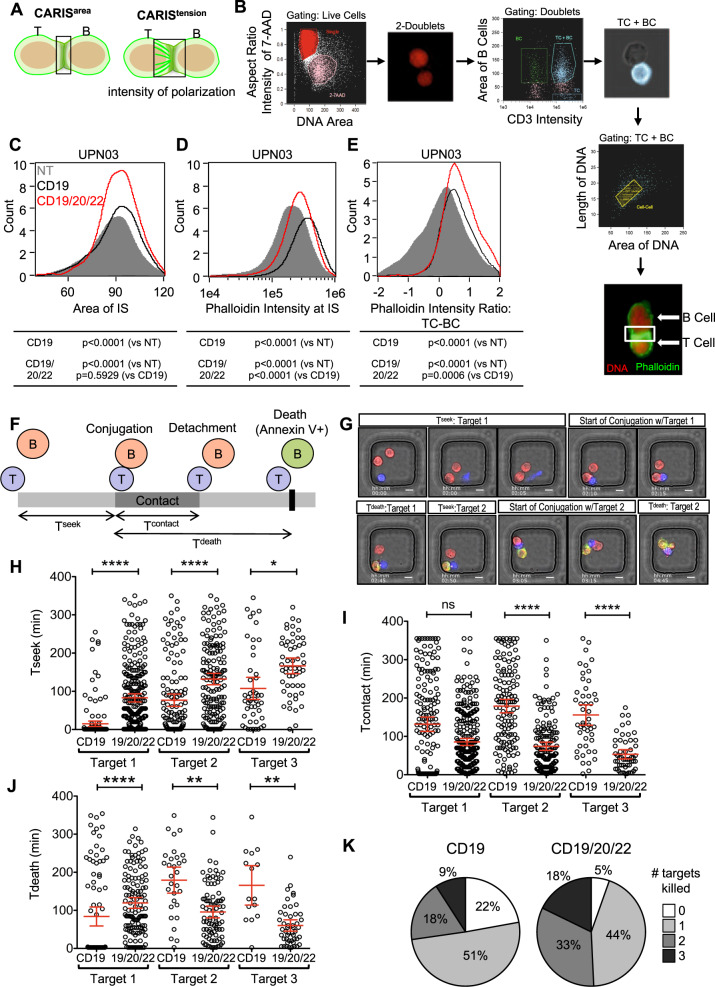
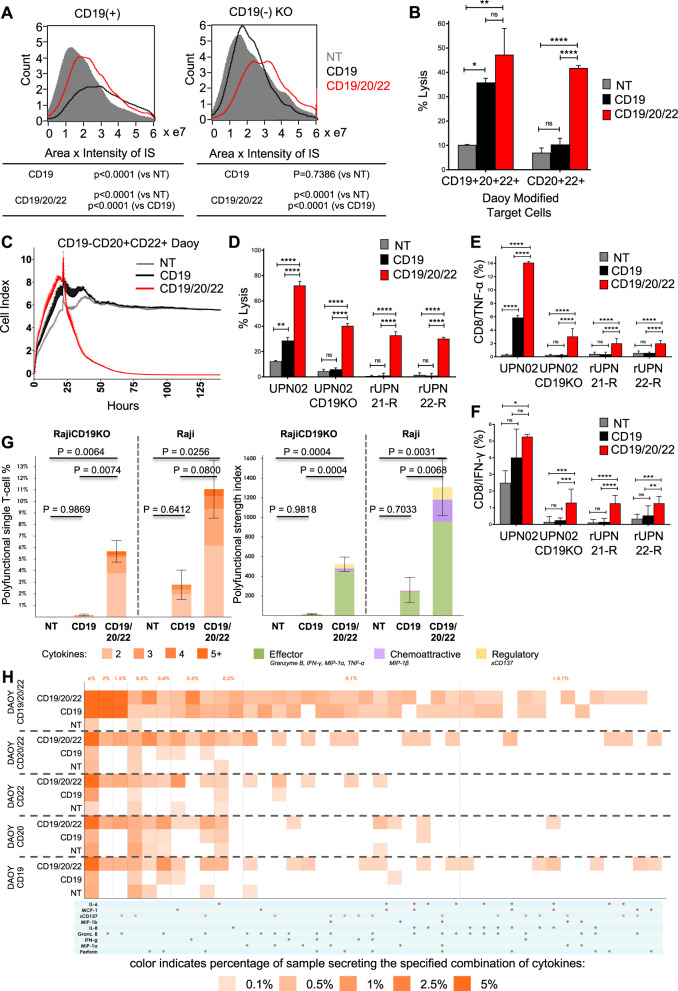
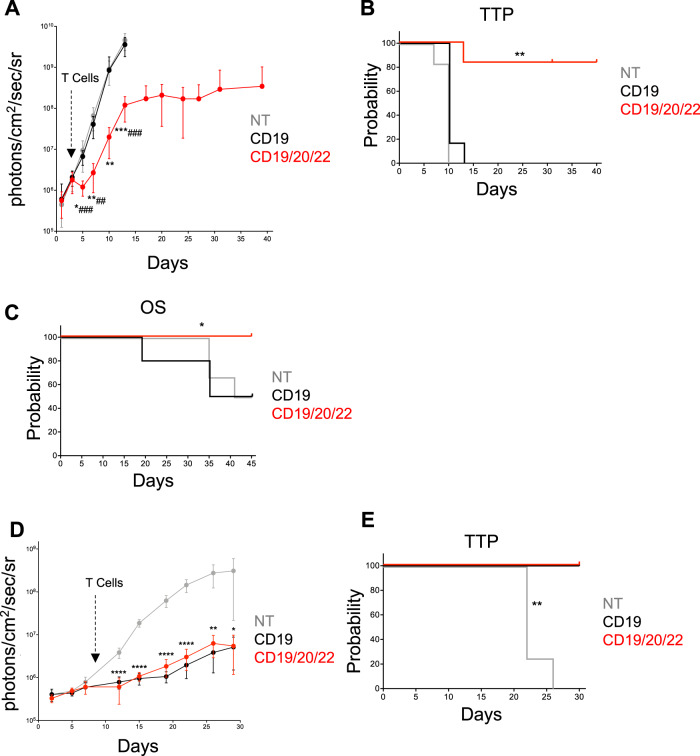
Chimeric antigen receptor (CAR) T-cells targeting CD19 demonstrate remarkable efficacy in treating B-lineage acute lymphoblastic leukemia (BL-ALL), yet up to 39% of treated patients relapse with CD19(-) disease. We report that CD19(-) escape is associated with downregulation, but preservation, of targetable expression of CD20 and CD22. Accordingly, we reasoned that broadening the spectrum of CD19CAR T-cells to include both CD20 and CD22 would enable them to target CD19(-) escape BL-ALL while preserving their upfront efficacy. We created a CD19/20/22-targeting CAR T-cell by coexpressing individual CAR molecules on a single T-cell using one tricistronic transgene. CD19/20/22CAR T-cells killed CD19(-) blasts from patients who relapsed after CD19CAR T-cell therapy and CRISPR/Cas9 CD19 knockout primary BL-ALL both in vitro and in an animal model, while CD19CAR T-cells were ineffective. At the subcellular level, CD19/20/22CAR T-cells formed dense immune synapses with target cells that mediated effective cytolytic complex formation, were efficient serial killers in single-cell tracking studies, and were as efficacious as CD19CAR T-cells against primary CD19(+) disease. In conclusion, independent of CD19 expression, CD19/20/22CAR T-cells could be used as salvage or front-line CAR therapy for patients with recalcitrant disease.


Conflict of interest statement

KF, TTB, MH, YK, NH, HA, and NA have patent applications in the field of gene modified T-cell therapy for cancer. NV is founder and CSO of CellChorus.

Figures

Fig. 1
Fig. 1. B-lineage ALL expresses variable yet targetable levels of alternative antigens, CD20 and CD22.
Flow cytometry was done on ≥30,000 B-lineage BL-ALL cells to assess the expression of CD19 (FITC), CD20 (PE), and CD22 (APC) in each BL-ALL sample. Histograms displayed are representative data. (n = 3). a Samples from three patients (UPN01, UPN02, and UPN03) were cultured in vitro and assessed for their antigen expression profile. Dotted histogram, isotype; solid line, target antibody. Table displays quantification of antigen expression. b Antigen expression in BL-ALL blasts from 12 patients (UPN04-R to UPN15-R) who relapsed after chemotherapy. Quantification of the percentage of antigen-positive cells and the density using mean fluorescence intensity (MFI) are shown in the table. c Quantification of CD19, CD20, and CD22 on BL-ALL samples from five patients who relapsed after CD19-directed immune therapy (UPN16-R to UPN20-R). (d) B-lineage BL-ALL phenotype before (UPN21-R and UPN22-R) and after CD19CAR T-cell therapy (rUPN21-R and rUPN22-R). (e) CD19, CD20, and CD22 expression in UPN02 BL-ALL cells, after CD19 was knocked out using CRISPR/Cas9 technology.
Fig. 2
Fig. 2. Design of CD19/20/22CAR T-cells.
a A tricistronic vector was designed with self-cleaving 2A peptides, enabling trivalent protein expression of CD19/20/22-directed CARs on T-cells. b Design of CAR transgenes. Each CAR endo-domain contains a CD8α hinge and transmembrane region followed by downstream 4-1BB and CD3ζ intracellular signaling domains. c Diagram of DNA wobbling of CAR endo-domain transgenes. Common segments of DNA were wobbled so that no more than 20 consecutive base pairs are the same in any of the three transgenes. Using the CD19CAR sequence as a reference, red bars on the CD20 and CD22 CARs indicate the positions of DNA wobbling. d Flow cytometry was performed on T-cells ~1 week after retroviral CAR transduction. Results demonstrate specific binding to each individual scFv region with detection methods unique to each CAR (Fig. S1B). Histograms shown are representative data. Long-term impedance-based xCELLigence killing assay targeting Daoy tumor cells (Fig. S2A, B) expressing each target antigen singly (n = 2) (e) or all three antigens simultaneously (n = 2) (f). Tumor cells adhered and expanded for 24 h before CAR T-cells were added in a 1:3 E:T ratio. NT T-cells serve as a negative control. A decreasing cell index indicates tumor lysis. g Four hours 51Cr release assay targeting B-lineage BL-ALL cells, UPN01, UPN02, and UPN03, at an E:T ratio of 3:1 (n = 3). NT T-cells serve as a negative control. Data represent the mean of triplicate samples +SD; *p < 0.05, ***p < 0.001, ****p < 0.0001, one-way ANOVA with Tukey’s multiple comparison post-test. h NT, CD19CAR, and CD19/20/22CAR T-cells were stained with eFluor 670 proliferation dye, and proliferation capacity of CAR-expressing T-cells was assessed over 72 h of exposure to BL-ALL cells (n = 2).
Fig. 3
Fig. 3. CD19/20/22CAR T cells have increased immunoactivity and serial killing activity at the single-cell level.
a Schematic illustrating the parameters assessed in the chimeric antigen receptor immune synapse (CARIS). b UPN03 cells were cocultured with NT, CD19CAR, or CD19/20/22CAR T-cells at a ratio of 1:1 for 1 h. After incubation, cells were analyzed for expression of CD3 (BV450), phalloidin (FITC), and 7-AAD using ImageStream. (n = 3) Duplex cells were separated from single cells by DNA contents and aspect ratio of 7-AAD. Intact T and B (BL-ALL) cells were identified by CD3 intensity and area of CD3(−), respectively. Duplex cells containing both T and B cells were selected for further analysis. Formation of immune synapses between T and B cells were defined by length and area of two DNA clusters between duplex cells. The final image exemplifies the characterization of a CARIS. The DNA is shown as red and F-actin (phalloidin staining) as green. The area boxed in white is the immune synapse (IS) area that is quantified in the analysis. Quantification of (c) the area encompassed by the IS (CARISarea), (d) the intensity of F-actin (phalloidin) at the CARIS (CARISdensity), and (e) the ratio of intensity of phalloidin between T-cells to B-cells (BL-ALL) (CARIStension). The frequency of each parameter for NT (gray), CD19CAR (black), and CD19/20/22CAR (red) T-cells is shown in a histogram. 1 × 105 events were assessed; two-way ANOVA was performed for statistical analysis, and p < 0.05 was considered significant. (fk) CD19CAR or CD19/20/22CAR T-cells were incubated with UPN02 cells at an E:T ratio of 1:3 to assess their cytolysis activity at the single-cell level using a TIMING nanowell assay. (f) Schematic depicting measurements quantified by TIMING assay. (g) Microscopy images representing Tseek, Tcontact, and Tdeath parameters. Scale bars represent 10 μm. (hj): Quantification of the time spent (h) searching for target by T-cells (Tseek), (i) the duration of contact maintained between an individual CAR T-cell and their first, second, and third target (Tcontact), and (j) the time to apoptosis of individual target cells since the start of conjugation (Tdeath) at an E:T ratio of 1:3. Each data point represents a single effector cell. ****p < 0.0001, **p < 0.01, *p < 0.05, ns = > 0.05; Kruskall–Wallis test with Dunn’s multiple correction. Data are presented as mean ± 95% confidence interval. (k) Pie chart comparing proportion of CD19CAR and CD19/20/22CAR T-cells able to kill multiple targets when plated at an E:T ratio of 1:3. > 165 individual wells were analyzed for each effector cell type.
Fig. 4
Fig. 4. Trivalent CAR T-cells overcome CD19(−) antigen escape in primary BL-ALL.
a Image stream analysis was performed as described in Fig. 3. The area × intensity of phalloidin in the CARIS is quantified for NT, CD19CAR, and CD19/20/22CAR T-cells in their interaction with CD19-expressing and CD19 KO target cells. b Eight hours 51Cr release assay targeting cells over-expressing CD19, CD20, and CD22 (triple positive) or CD20 and CD22 (double positive) cells at an E:T ratio of 5:1 (n = 2). c Long-term impedance-based xCELLigence killing assay targeting double positive (CD20+CD22+) but CD19- cells that are described in Fig. S2B. Target cells were cultured for ~24 h before NT, CD19CAR, or CD19/20/22CAR T-cells were added in a 1:3 E:T ratio. Tumor cell lysis, represented by a decrease in cell index, was measured over time (n = 2). d Target BL-ALL cells (UPN02, UPN02 CD19KO, rUPN21-R, rUPN22-R) were cocultured with NT or CAR T-cells at an E:T ratio of 3:1 for 4 h and cell lysis was determined by 51Cr assay (data shown are representative data, n = 3). **p < 0.01, ****p < 0.0001, one-way ANOVA with Tukey’s multiple comparison post-test. BL-ALL target cells (UPN02, UPN02 CD19KO, rUPN21-R, rUPN22-R) were cocultured with T-cells in the presence of brefeldin A at an E:T ratio of 10:1 for 4 h. Cells were stained to determine levels of intracellular (e) TNF-α + CD8 + T-cells or (f) IFN-γ + CD8+T-cells. NT T-cells serve as a negative control in all experiments (n = 3). **p < 0.01, ***p ≤ 0.001, ****p < 0.0001, one-way ANOVA with Tukey’s multiple comparison post-test. (gh) CD19+ and CD19- target cells were cocultured with CD8+ isolated CD19/20/22CAR, CD19CAR, and NT T-cells, and single-cell polyfunctionality assessed via a 32-plex antibody barcoded chip analysis. (g) Polyfunctionality evaluation of the number and subset classification of cytokines produced by single cells in response to antigen-specific stimulation (h) Single-cell functional heatmap demonstrates proportions of polyfunctional subsets of T-cells in response to Daoy cells transduced with various combinations of tumor antigens. Each column corresponds to a specific cytokine or combination of cytokines, and the orange squares represent the frequency at which the cytokine set was secreted by the corresponding sample. The cytokine groups are ordered by overall frequency across all samples.
Fig. 5
Fig. 5. CD19/20/22CAR T-cell efficacy in xenograft models of CD19(−) disease.
a, b Mice were administered Raji.CD19KO.GFP.FFLuc cells (Fig. S2C) on day 0 followed by NT, CD19CAR, or CD19/20/22CAR T-cells on day 3 (n = 6 mice per group). Bioluminescent signal was tracked and quantified over the course of 40 days. a The average BLI ± SD for each group is displayed. (*denotes comparisons between NT and CD19/20/22CAR, # denotes CD19CAR vs CD19/20/22CAR; *p < 0.05, **p < 0.01, ***p < 0.001; ## p < 0.01, ### p ≤ 0.001, one-way ANOVA with Tukey’s post-test). b Time to progression (TTP) represented as Kaplan–Meier estimate (tumor burden of 1 × 108 photons/cm2/sec/sr considered as disease progression); **p = 0.0013 NT vs CD19/20/22CAR, p = 0.0017 CD19 vs CD19/20/22CAR, Gehan-Breslow-Wilcoxon test. c Overall survival in mice transplanted with rUPN21-R, a primary BL-ALL exhibiting CD19-escape after CD19CAR T-cell therapy. Injection with rUPN21-R cells on day 0 followed by T-cells on days 3 and 7: NT (n = 6 mice), CD19CAR (n = 10 mice), or CD19/20/22CAR (n = 10 mice). Mice were monitored for signs of disease, weight loss, and general well-being, and overall survival was quantified after 45 days. (*p = 0.0015 NT vs CD19/20/22CAR, p = 0.0126 CD19 vs CD19/20/22CAR, Gehan-Breslow-Wilcoxon test). d, e Mice were administered UPN03.GFP.FFLuc cells on day 0 followed by NT (n = 4 mice), CD19CAR (n = 5 mice), or CD19/20/22CAR (n = 4 mice) T-cells on day 9. d Bioluminescent signal (BLI) was recorded and average BLI ± SD quantified over 30 days (*p < 0.05, **p < 0.01, ****p < 0.0001; NT vs CD19 or CD19/20/22CAR; one-way ANOVA with Tukey’s post-test) (E) Time to tumor progression (tumor burden of 1 × 108 photons/cm2/sec/sr considered as disease progression) represented as Kaplan–Meier estimate; **p = 0.0047 NT vs CD19CAR and NT vs CD19/20/22CAR, Gehan-Breslow-Wilcoxon Test.

References

    1. Davila ML, Riviere I, Wang X, Bartido S, Park J, Curran K, et al. Efficacy and toxicity management of 19-28z CAR T cell therapy in B cell acute lymphoblastic leukemia. Sci Transl Med. 2014;6:224ra25. - PMC - PubMed
    1. Grupp SA, Kalos M, Barrett D, Aplenc R, Porter DL, Rheingold SR, et al. Chimeric antigen receptor-modified T cells for acute lymphoid leukemia. N Engl J Med. 2013;368:1509–18. - PMC - PubMed
    1. Lee DW, Kochenderfer JN, Stetler-Stevenson M, Cui YK, Delbrook C, Feldman SA, et al. T cells expressing CD19 chimeric antigen receptors for acute lymphoblastic leukaemia in children and young adults: a phase 1 dose-escalation trial. Lancet. 2015;385:517–28. - PMC - PubMed
    1. Maude SL, Frey N, Shaw PA, Aplenc R, Barrett DM, Bunin NJ, et al. Chimeric antigen receptor T cells for sustained remissions in leukemia. N Engl J Med. 2014;371:1507–17. - PMC - PubMed
    1. Turtle CJ, Hanafi LA, Berger C, Gooley TA, Cherian S, Hudecek M, et al. CD19 CAR-T cells of defined CD4+:CD8+ composition in adult B cell ALL patients. J Clin Invest. 2016;126:2123–38. - PMC - PubMed

Publication types

MeSH terms