

Serum N-glycan markers for diagnosing liver fibrosis induced by hepatitis B virus
- PMID: 32205997
- PMCID: PMC7080998
- DOI: 10.3748/wjg.v26.i10.1067
Serum N-glycan markers for diagnosing liver fibrosis induced by hepatitis B virus
Abstract
Background: Hepatitis B virus (HBV) infection is the primary cause of hepatitis with chronic HBV infection, which may develop into liver fibrosis, cirrhosis and hepatocellular carcinoma. Detection of early-stage fibrosis related to HBV infection is of great clinical significance to block the progression of liver lesion. Direct liver biopsy is regarded as the gold standard to detect and assess fibrosis; however, this method is invasive and prone to clinical sampling error. In order to address these issues, we attempted to find more convenient and effective serum markers for detecting HBV-induced early-stage liver fibrosis.
Aim: To investigate serum N-glycan profiling related to HBV-induced liver fibrosis and verify multiparameter diagnostic models related to serum N-glycan changes.
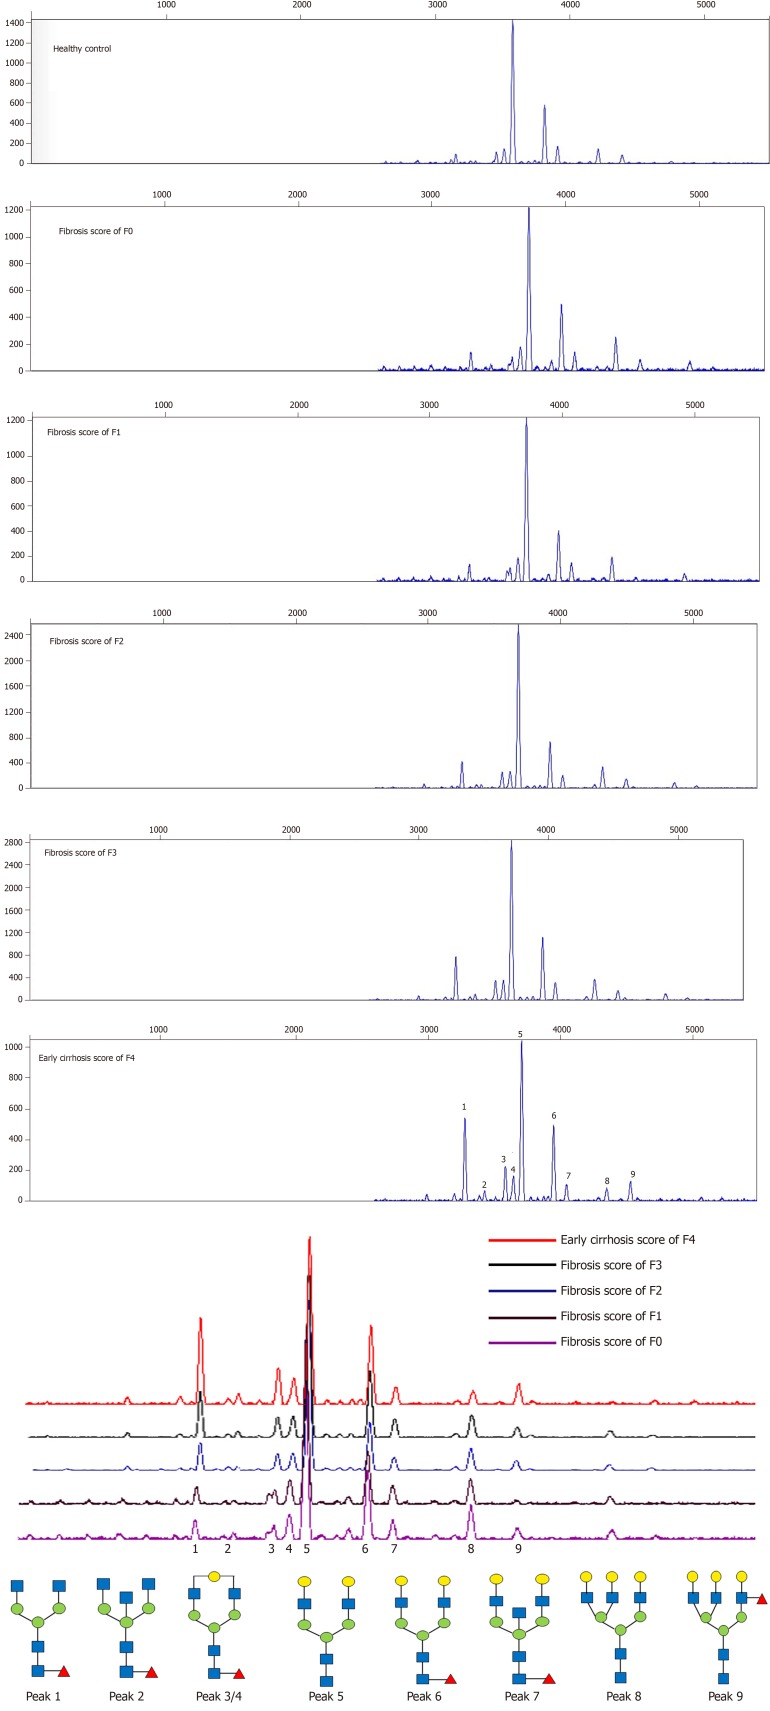
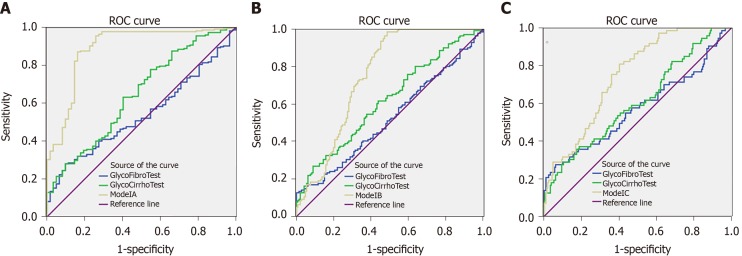
Methods: N-glycan profiles from the sera of 432 HBV-infected patients with liver fibrosis were analyzed. Significant changed N-glycan levels (peaks) (P < 0.05) in different fibrosis stages were selected in the modeling group, and multiparameter diagnostic models were established based on changed N-glycan levels by logistic regression analysis. The receiver operating characteristic (ROC) curve analysis was performed to evaluate diagnostic efficacy of N-glycans models. These models were then compared with the aspartate aminotransferase to platelet ratio index (APRI) , fibrosis index based on the four factors (FIB-4), glutamyltranspeptidase platelet albumin index (S index), GlycoCirrho-test, and GlycoFibro-test. Furthermore, we combined multiparameter diagnostic models with alanine aminotransferase (ALT) and platelet (PLT) tests and compared their diagnostic power. In addition, the diagnostic accuracy of N-glycan models was also verified in the validation group of patients.
Results: Multiparameter diagnostic models constructed based on N-glycan peak 1, 3, 4 and 8 could distinguish between different stages of liver fibrosis. The area under ROC curves (AUROCs) of Model A and Model B were 0.890 and 0.752, respectively differentiating fibrosis F0-F1 from F2-F4, and F0-F2 from F3-F4, and surpassing other serum panels. However, AUROC (0.747) in Model C used for the diagnosis of F4 from F0-F3 was lower than AUROC (0.795) in FIB-4. In combination with ALT and PLT, the multiparameter models showed better diagnostic power (AUROC = 0.912, 0.829, 0.885, respectively) when compared with other models. In the validation group, the AUROCs of the three combined models (0.929, 0.858, and 0.867, respectively) were still satisfactory. We also applied the combined models to distinguish adjacent fibrosis stages of 432 patients (F0-F1/F2/F3/F4), and the AUROCs were 0.917, 0.720 and 0.785.
Conclusion: Multiparameter models based on serum N-glycans are effective supplementary markers to distinguish between adjacent fibrosis stages of patients caused by HBV, especially in combination with ALT and PLT.
Keywords: Chronic hepatitis B; Diagnostic power; Liver fibrosis; Multiparameter diagnostic models; N-glycan; Receiver operating characteristic curve analysis.
©The Author(s) 2020. Published by Baishideng Publishing Group Inc. All rights reserved.
Conflict of interest statement
Conflict-of-interest statement: All authors declare no conflicts-of-interest related to this article.
Figures
References
-
- World Health Organization. Global hepatitis report, 2017. Available from: https://www.who.int/hepatitis/publications/global-hepatitis-report2017/en/
-
- Sharma P, Dhawan S, Bansal R, Tyagi P, Bansal N, Singla V, Kumar A, Matin A, Arora A. Usefulness of transient elastography by FibroScan for the evaluation of liver fibrosis. Indian J Gastroenterol. 2014;33:445–451. - PubMed
-
- Wai CT, Greenson JK, Fontana RJ, Kalbfleisch JD, Marrero JA, Conjeevaram HS, Lok AS. A simple noninvasive index can predict both significant fibrosis and cirrhosis in patients with chronic hepatitis C. Hepatology. 2003;38:518–526. - PubMed
Publication types
MeSH terms
Substances
LinkOut - more resources
Full Text Sources
Medical
Miscellaneous
