

Smart Sorting of Tumor Phenotype with Versatile Fluorescent Ag Nanoclusters by Sensing Specific Reactive Oxygen Species
- PMID: 32206100
- PMCID: PMC7069096
- DOI: 10.7150/thno.38422
Smart Sorting of Tumor Phenotype with Versatile Fluorescent Ag Nanoclusters by Sensing Specific Reactive Oxygen Species
Abstract
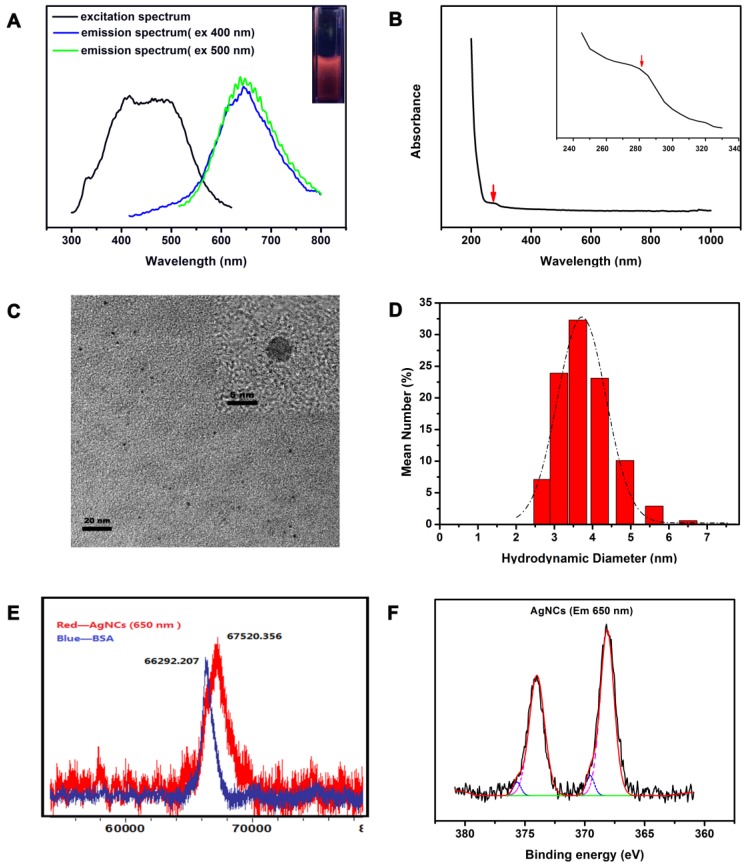
Reactive oxygen species (ROS) play a crucial role in cancer formation and development, especially cancer metastasis. However, lack of a precise tool, which could accurately distinguish specific types of ROS, restricts an in-depth study of ROS in cancer development and progression. Herein, we designed smart and versatile fluorescent Ag nanoclusters (AgNCs) for sensitive and selective detection of different species of ROS in cells and tissues. Methods: Firstly, dual-emission fluorescent AgNCs was synthesized by using bovine serum albumin (BSA) to sense different types of ROS (H2O2, O2•-, •OH). The responsiveness of the AgNCs to different species of ROS was explored by fluorescence spectrum, hydrodynamic diameter, and so on. Furthermore, dual-emission fluorescent AgNCs was used to sense ROS in tumor with different degrees of differentiation. Finally, the relationship between specific types of ROS and tumor cell invasion was explored by cell migration ability and the expression of cell adhesion and EMT markers. Results: This dual-emission fluorescent AgNCs possessed an excellent ability to sensitively and selectively distinguish highly reactive oxygen species (hROS, including O2•-and •OH) from moderate reactive oxygen species (the form of H2O2), and exhibited no fluoresence and green fluorescence, respectively. The emission of AgNCs is effective in detecting cellular and tissular ROS. When cultured with AgNCs, malignant tumor cells exhibit non-fluorescence, while the benign tumor emits green and reduced red light and the normal cells appear in weak green and bright red fluorescence. We further verified that not just H2O2 but specific species of ROS (O2•-and •OH) were involved in cell invasion and malignant transformation. Our study warrants further research on the role of ROS in physiological and pathophysiological processes. Conclusion: Taken together, AgNCs would be a promising approach for sensing ROS, and offer an intelligent tool to detect different kinds of ROS in tumors.
Keywords: Ag Nanoclusters; ROS; Tumor Phenotype.
© The author(s).
Conflict of interest statement
Competing Interests: The authors have declared that no competing interest exists.
Figures


Similar articles
-
Application of fluorescence i-motif DNA silver nanocluster sensor to visualize endogenous reactive oxygen species in plant cells.Plant Cell Rep. 2024 Dec 15;44(1):6. doi: 10.1007/s00299-024-03398-2. Plant Cell Rep. 2024. PMID: 39676128
-
Highly Stable and Multiemissive Silver Nanoclusters Synthesized in Situ in a DNA Hydrogel and Their Application for Hydroxyl Radical Sensing.ACS Appl Mater Interfaces. 2018 Aug 8;10(31):26075-26083. doi: 10.1021/acsami.8b09152. Epub 2018 Jul 24. ACS Appl Mater Interfaces. 2018. PMID: 30001115
-
Fluorescence switch for silver ion detection utilizing dimerization of DNA-Ag nanoclusters.Biosens Bioelectron. 2015 Jun 15;68:642-647. doi: 10.1016/j.bios.2015.01.058. Epub 2015 Jan 28. Biosens Bioelectron. 2015. PMID: 25658488
-
Development of General Methods for Detection of Virus by Engineering Fluorescent Silver Nanoclusters.ACS Sens. 2021 Mar 26;6(3):613-627. doi: 10.1021/acssensors.0c02322. Epub 2021 Mar 4. ACS Sens. 2021. PMID: 33660987 Review.
-
Fluorescent DNA-Silver nanoclusters in food safety detection: From synthesis to application.Talanta. 2024 Jun 1;273:125834. doi: 10.1016/j.talanta.2024.125834. Epub 2024 Mar 8. Talanta. 2024. PMID: 38479031 Review.
Cited by
-
Advances in the synthesis and applications of 2D MXene-metal nanomaterials.Surf Interfaces. 2023 Jun;38:102873. doi: 10.1016/j.surfin.2023.102873. Epub 2023 Apr 9. Surf Interfaces. 2023. PMID: 37614222 Free PMC article.
-
Current update on nanoplatforms as therapeutic and diagnostic tools: A review for the materials used as nanotheranostics and imaging modalities.Asian J Pharm Sci. 2021 Jan;16(1):24-46. doi: 10.1016/j.ajps.2020.03.003. Epub 2020 May 12. Asian J Pharm Sci. 2021. PMID: 33613728 Free PMC article. Review.
-
Stimuli-Responsive Plasmonic Assemblies and Their Biomedical Applications.Nano Today. 2021 Feb;36:101014. doi: 10.1016/j.nantod.2020.101014. Epub 2020 Nov 8. Nano Today. 2021. PMID: 33250931 Free PMC article.
-
Recent theranostic applications of hydrogen peroxide-responsive nanomaterials for multiple diseases.RSC Adv. 2023 Sep 12;13(39):27333-27358. doi: 10.1039/d3ra05020c. eCollection 2023 Sep 8. RSC Adv. 2023. PMID: 37705984 Free PMC article. Review.
-
Electrostimulus-triggered reactive oxygen species level in organelles revealed by organelle-targeting SERS nanoprobes.Anal Bioanal Chem. 2022 Sep;414(23):6965-6975. doi: 10.1007/s00216-022-04265-3. Epub 2022 Aug 17. Anal Bioanal Chem. 2022. PMID: 35976421
References
-
- Loberg RD, Bradley DA, Tomlins SA, Chinnaiyan AM, Pienta KJ. The Lethal Phenotype of Cancer: The Molecular Basis of Death Due to Malignancy. CA: A Cancer Journal for Clinicians. 2007;57:225–41. - PubMed
-
- Mehlen P, Puisieux A. Metastasis: a question of life or death. Nat Rev Cancer. 2006;6:449–58. - PubMed
-
- Zhang C, Cao S, Toole BP, Xu Y. Cancer may be a pathway to cell survival under persistent hypoxia and elevated ROS: A model for solid-cancer initiation and early development. International journal of cancer. 2015;136:2001–11. - PubMed
Publication types
MeSH terms
Substances
LinkOut - more resources
Full Text Sources
Other Literature Sources
Medical
