. 2020 Feb 10;10(8):3518-3532.
doi: 10.7150/thno.40687. eCollection 2020.

Concurrent imaging of vascularization and metabolism in a mouse model of paraganglioma under anti-angiogenic treatment

Affiliations

Concurrent imaging of vascularization and metabolism in a mouse model of paraganglioma under anti-angiogenic treatment

Caterina Facchin et al. Theranostics. .

Abstract

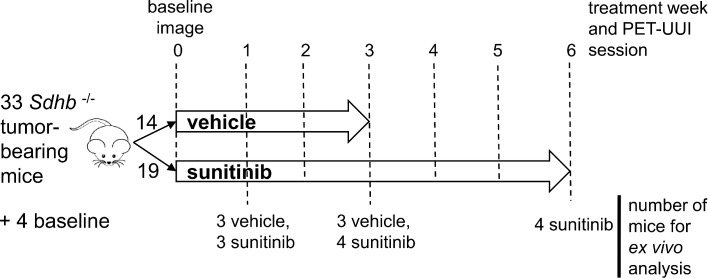
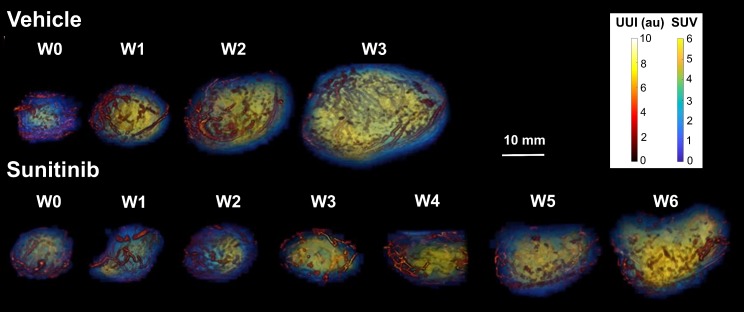
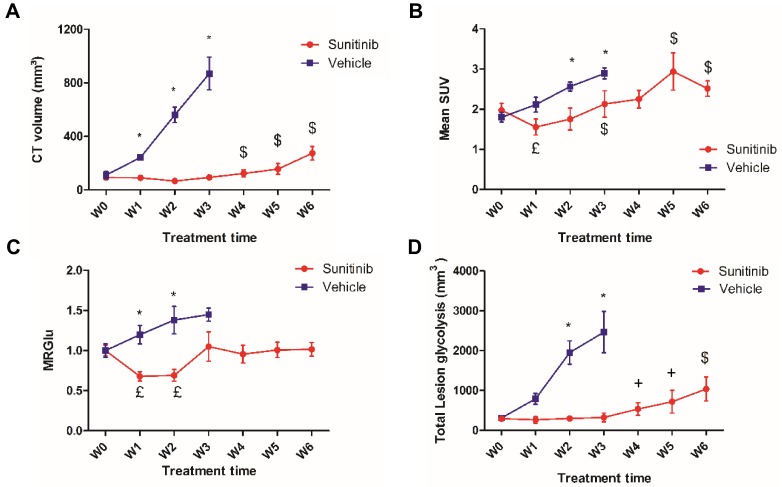
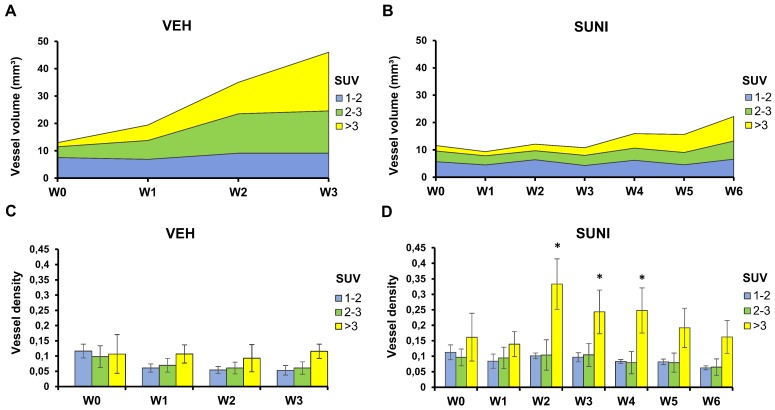
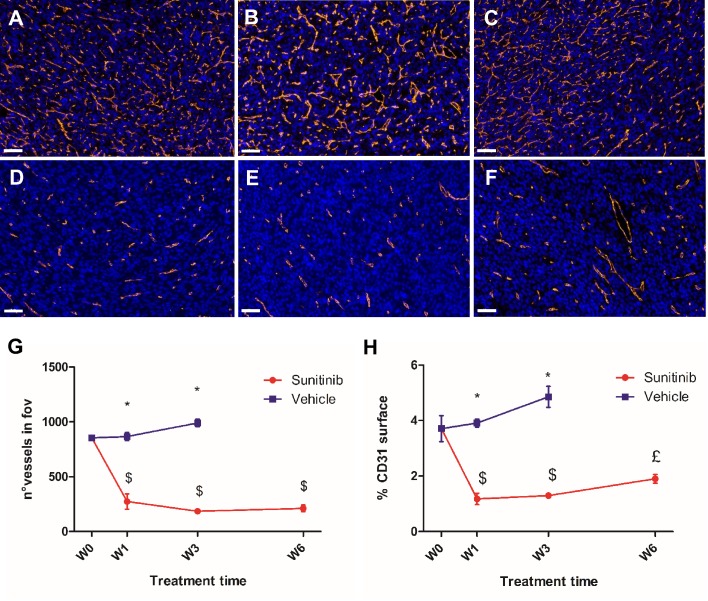
Rationale: Deregulation of metabolism and induction of vascularization are major hallmarks of cancer. Using a new multimodal preclinical imaging instrument, we explored a sequence of events leading to sunitinib-induced resistance in a murine model of paraganglioma (PGL) invalidated for the expression of succinate dehydrogenase subunit B (Sdhb-/-). Methods: Two groups of Sdhb-/- tumors bearing mice were treated with sunitinib (6 weeks) or vehicle (3 weeks). Concurrent Positron Emission Tomography (PET) with 2' -deoxy-2'-[18F]fluoro-D-glucose (FDG), Computed Tomography (CT) and Ultrafast Ultrasound Imaging (UUI) imaging sessions were performed once a week and ex vivo samples were analyzed by western blots and histology. Results: PET-CT-UUI enabled to detect a rapid growth of Sdhb-/- tumors with increased glycolysis and vascular development. Sunitinib treatment prevented tumor growth, vessel development and reduced FDG uptake at week 1 and 2 (W1-2). Thereafter, imaging revealed tumor escape from sunitinib treatment: FDG uptake in tumors increased at W3, followed by tumor growth and vessel development at W4-5. Perfused vessels were preferentially distributed in the hypermetabolic regions of the tumors and the perfused volume increased during escape from sunitinib treatment. Finally, initial changes in total lesion glycolysis and maximum vessel length at W1 were predictive of resistance to sunitinib. Conclusion: These results demonstrate an adaptive resistance of Sdhb-/- tumors to six weeks of sunitinib treatment. Early metabolic changes and delayed vessel architecture changes were detectable and predictable in vivo early during anti-angiogenic treatment. Simultaneous metabolic, anatomical and functional imaging can monitor precisely the effects of anti-angiogenic treatment of tumors.

Keywords: Cancer metabolism; SDHB; angiogenesis; multimodality imaging; paraganglioma; positron emission tomography; ultrafast-ultrasound imaging.


Conflict of interest statement

Competing Interests: The authors have declared that no competing interest exists.

Figures

Figure 1
Figure 1
Study design. Mice were divided into two groups: sunitinib- and vehicle-treated (SUNI and VEH, respectively). 8 mice from each group, were scanned with PETRUS before and after 1, 2 and 3 weeks of treatment. In addition, SUNI mice were imaged at 4, 5 and 6 weeks of treatment. Among the two groups, n=21 Sdhb-/- tumor bearing mice were used for histological and western blots analysis at baseline (no treatment, n=4), week 1 (SUNI, n=3; VEH, n=3), week 3 (SUNI, n=4; VEH, n=3), week 6 (SUNI, n=4).
Figure 2
Figure 2
Representative images of tumor vascularization and metabolism acquired weekly in a VEH (top row) and a SUNI-treated mouse tumor (bottom row). Maximum intensity projection (MIP) visualization. Bar Length: 10 mm. Resume of FDG at W3 and growth and vascular network at W5-6 in sunitinib treated animals.
Figure 3
Figure 3
Effects of sunitinib on tumor growth and glycolytic metabolism of Sdhb-/- PGLs allografts imaged with PETRUS. Quantification of (A) CT volume, $: p <0.05 compared with W0, W1, W2 and W3 in SUNI group. (B) Mean SUV by PET, £: p <0.05 compared with baseline in the SUNI group, $: p <0.05 compared with W1 in the SUNI group. (C) Metabolic Rate of Glucose (MRGlu): Means were normalized by the baseline value. £: p <0.05 compared to baseline. (D) Total Lesion Glycolysis, $: p <0.05 compared to the earlier weeks in the SUNI group; +: p<0.05 in comparison with W0, W1, W2 and W3 in the SUNI group. Data are expressed as mean ± SEM. *: p <0.05 between the two groups with 2-ways ANOVA. In the VEH group, all values at W1 and W3 are statistically different from baseline (p<0.05).
Figure 4
Figure 4
UUI parameters. (A) Vessel volume, $: p <0.05 compared with W3 and baseline in SUNI group. All VEH values at W1-3 are statistically different from baseline. (B) Maximum vessel length. $: p <0.05 in comparison with W3 and W1 in SUNI group. Values of VEH are statistically different from baseline at W1 and W2 but not at W3. (C) Number of nodes. $: p <0.05 in comparison with W3 and baseline in SUNI group. Values of VEH are statistically different from baseline at W2 and W3. (D) Tortuosity. Data expressed in mean ± SEM. *: p <0.05 between the two groups with 2-ways ANOVA.
Figure 5
Figure 5
Perfused vessels feed high metabolic regions during escape to sunitinib. Each tumor was segmented according to its local mean SUV values into 3 regions: low SUV (1 ≤ mean SUV < 2, blue), intermediate SUV (2 ≤ mean SUV < 3, green), and high SUV (mean SUV ≥ 3, yellow). Panels A and B present the vessel volume in the segmented regions. Note that these numbers are independent from the relative volumes of each segmented region. Panels C and D present the ratio of the vessel volume to the volume of each segmented region, which corresponds to the regional vessel densities (vessel volume/ segmented metabolic region). Vessel volumes increase in regions with SUV > 2 in VEH animals (A) and, after W4, in SUNI animals (B). Minor changes in the vessel densities relative to SUV-segmented regions were observed in VEH animals (C). In contrast, in SUNI animals, there was a drastic rise of vessel density in highly glycolytic regions from W2 onwards (D). Data are expressed in mean ± SEM. *: p <0.05 between the high SUV-regions and the low or intermediate SUV regions, Wilcoxon matched-pairs test.
Figure 6
Figure 6
GLUT1 and CD31 immunofluorescence. Representative sections of Sdhb-/- tumors at W3 treated with vehicle at W3 (A, D), sunitinib at W3 (B, E) and at W6 (C, F). Green: GLUT1. Orange: CD31. Blue: DAPI. Length bars: (A-C) 800µm, (D-F) 200µm.
Figure 7
Figure 7
Sunitinib decreases the microvascular density and the number of vessels. Representative sections of Sdhb-/- tumor stained for blood vessels (CD31 staining, orange) and nuclei (DAPI, blue). Length bar: 50µm. (A) Baseline, (B) VEH 1 week, (C) VEH 3 weeks, (D) SUNI treated 1 week, (E) SUNI 3 weeks, (F) SUNI 6 weeks. Magnification 20x. (G)(H) Quantification of number of vessels and percentage of CD31 surface in field of view in tumors treated with VEH or with SUNI. $: p <0.05 in comparison with the baseline with Student's t-test. £: p <0.05 in comparison with baseline and W3 of SUNI. Data expressed in mean ± SEM. *: p <0.05 between the two groups with 2-ways ANOVA.
Figure 8
Figure 8
Pericyte coverage changes during sunitinib treatment. Representative sections of Sdhb-/- tumor stained for pericytes (α-SMA staining, red) and endothelial cells (CD31 staining, green). (A) Week 1 and (B) week 3 in VEH tumors. (C) Week 1 and (D) week 3 in SUNI tumors. Length bars: (A)-(D): 30µm. (E) and (F) percentage of pericyte (α-SMA) coverage (number of covered vessels/total vessel number) in tumors treated with VEH or with SUNI. (E) All vessels, (F) only capillaries (diameter <10µm) considered. Data expressed in mean ± SEM. *: p <0.05 between the two groups at W1 with 2-ways ANOVA.
Figure 9
Figure 9
Correlations between PET-CT-UUI parameters at the week 6 (W6) and the variations between Week 1 (W1) and baseline (W0). Heatmap plotting the square of Pearson correlation coefficient values (R2). Parameters variations between W1-W0 (y-axis) and parameter values at W6 (x-axis). Parameters in the two axis: CT volume, mean and max SUV, MRGlu, Metabolic Flux, Total Lesion Glycolysis, Vessel volume, Mean and Max vessel length, Vessel length dispersion, Mean and Max vessel diameter, Number (Nb) of nodes, Number of nodes/ vessel volume, and Tortuosity.

References

    1. Folkman J, Merler E, Abernathy C, Williams G. Isolation of a tumor factor responsible for angiogenesis. J Exp Med. 1971;133(2):275–88. - PMC - PubMed
    1. Jayson GC, Kerbel R, Ellis LM, Harris AL. Antiangiogenic therapy in oncology: current status and future directions. Lancet. 2016;388(10043):518–29. - PubMed
    1. Nassif E, Thibault C, Vano Y, Fournier L, Mauge L, Verkarre V. et al. Sunitinib in kidney cancer: 10 years of experience and development. Expert Rev Anticancer Ther. 2017;17(2):129–42. - PubMed
    1. Favier J, Amar L, Gimenez-Roqueplo A-P. Paraganglioma and phaeochromocytoma: from genetics to personalized medicine. Nat Rev Endocrinol. 2015;11(2):101–11. - PubMed
    1. Pàez-Ribes M, Allen E, Hudock J, Takeda T, Okuyama H, Viñals F. et al. Antiangiogenic Therapy Elicits Malignant Progression of Tumors to Increased Local Invasion and Distant Metastasis. Cancer Cell. 2009;15(3):220–31. - PMC - PubMed

Publication types

MeSH terms