. 2020 Mar 19;14(2):024103.
doi: 10.1063/1.5143656. eCollection 2020 Mar.

Flow induced particle separation and collection through linear array pillar microfluidics device

Affiliations

Flow induced particle separation and collection through linear array pillar microfluidics device

Prerna Balyan et al. Biomicrofluidics. .

Abstract

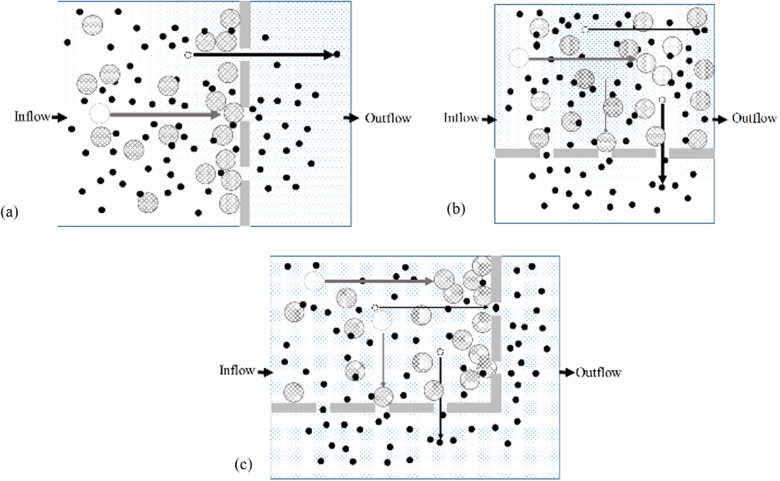
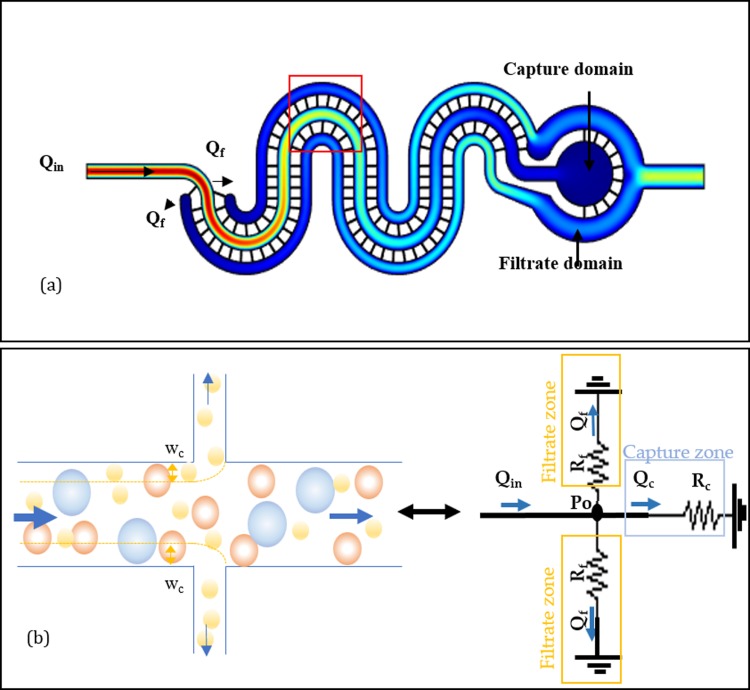
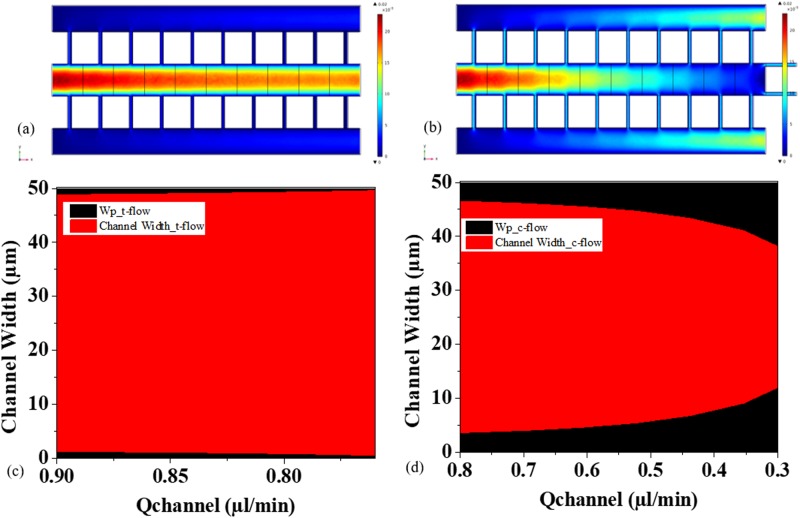
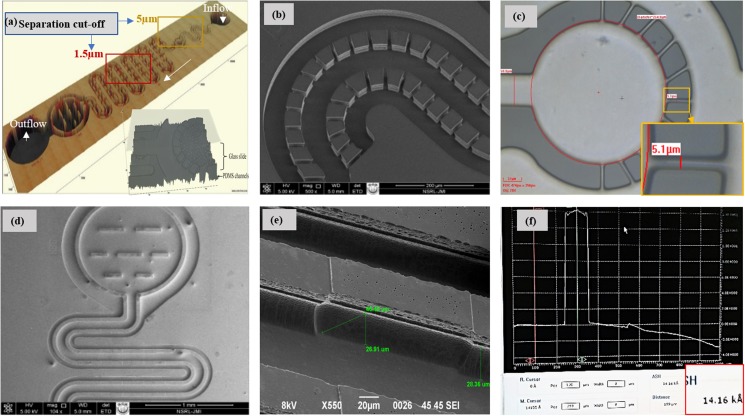
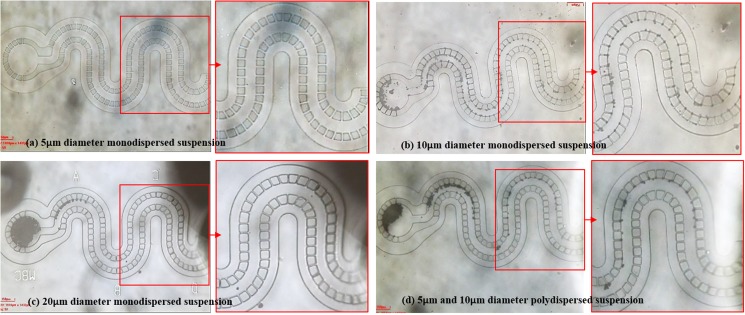
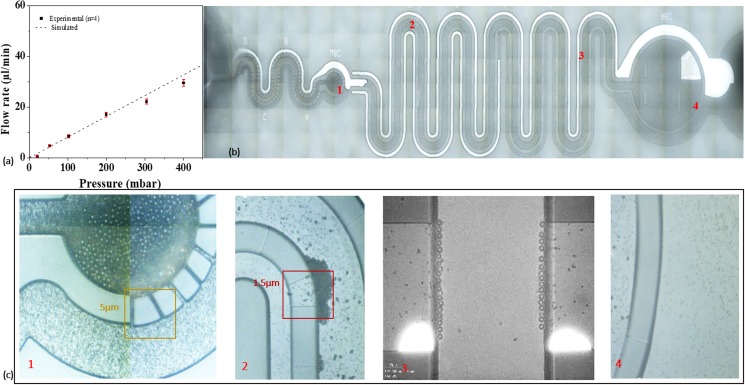
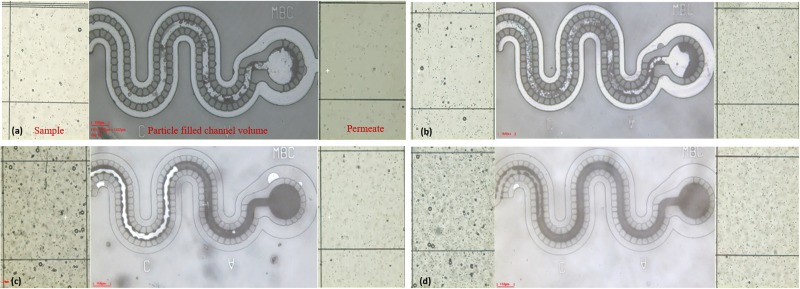
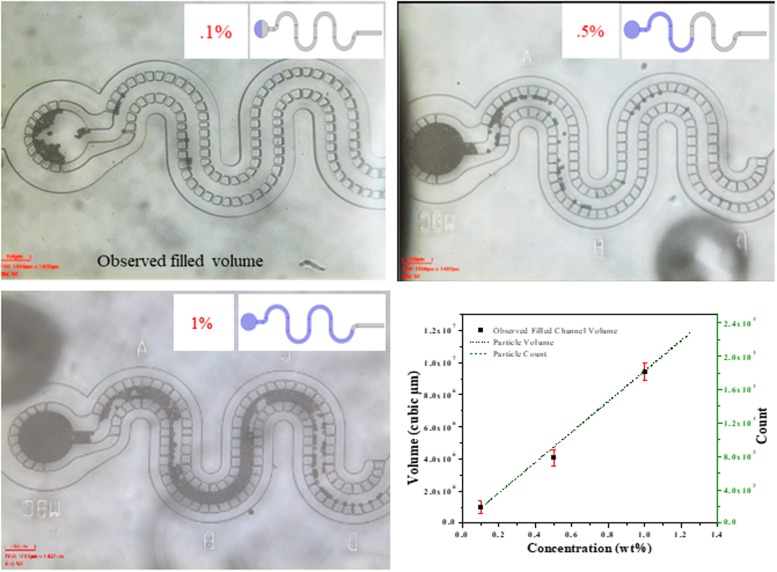
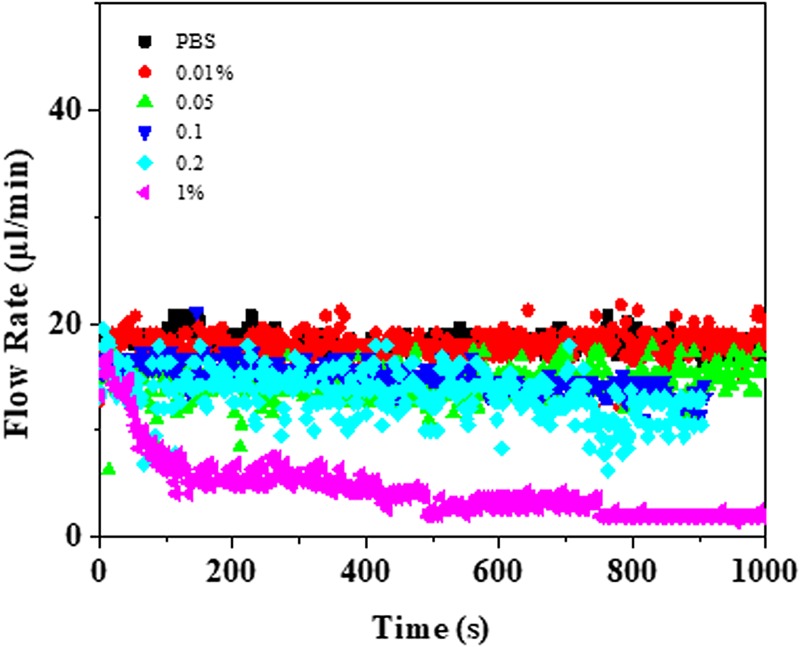
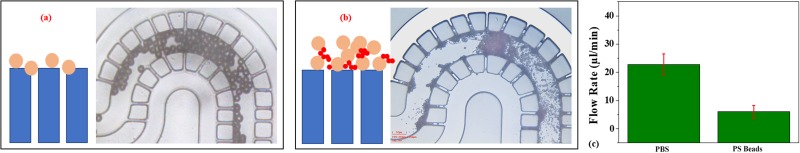
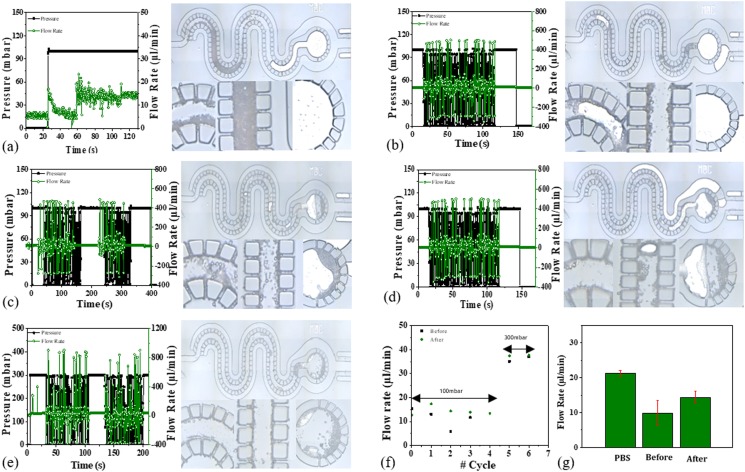
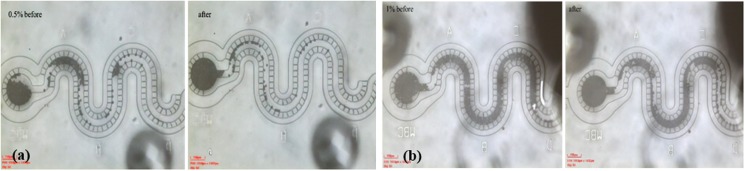
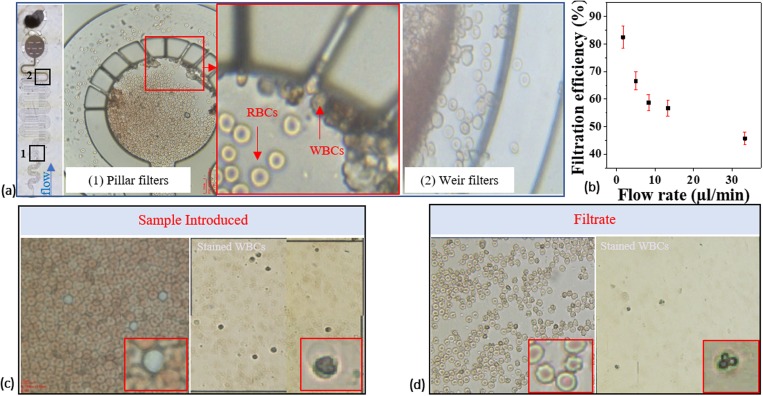
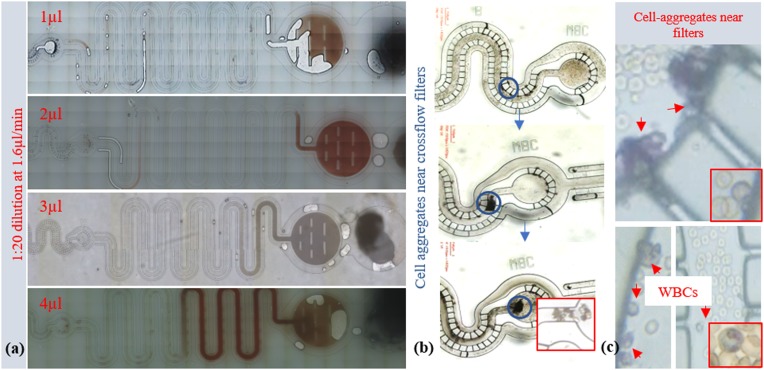
Particle filtration and concentration have great significance in a multitude of applications. Physical filters are nearly indispensable in conventional separation processes. Similarly, microfabrication-based physical filters are gaining popularity as size-based particle sorters, separators, and prefiltration structures for microfluidics platforms. The work presented here introduces a linear combination of obstructions to provide size contrast-based particle separation. Polystyrene particles that are captured along the crossflow filters are packed in the direction of the dead-end filters. Separation of polydisperse suspension of 5 μm and 10 μm diameter polystyrene microspheres is attained with capture efficiency for larger particles as 95%. Blood suspension is used for biocharacterization of the device. A flow induced method is used to improve particle capture uniformity in a single microchannel and reduce microgap clogging to about 30%. This concept is extended to obtain semiquantification obtained by comparison of the initial particle concentration to captured-particle occupancy in a microfiltration channel.


Figures

FIG. 1.
FIG. 1.
Modes of filtration according to filter orientation with respect to flow direction are (a) n-flow with filter opening aligned in the direction of fluid flow, (b) t-flow with filters aligned perpendicular to the flow direction, and (c) combination (c-flow) of n-flow and t-flow filters.
FIG. 2.
FIG. 2.
(a) Velocity profile of the c-flow design. Qin and Qf show the direction of sample flow and filtrate flow, respectively; (b) schematic and equivalent hydraulic circuit representation of flow through and critical width formation near filter openings.
FIG. 3.
FIG. 3.
Simulation analysis of distribution of velocity profile and critical width along the lateral filters in (a) t-flow design and (b) c-flow design. (c) t-flow design shows very small change in critical width compared to (d) c-flow design, where there is an increase in critical width along the filter distribution. Qchannel represents the flow rates inside the channel before the lateral filters. Indirectly, Qchannel also represents the points in channel length.
FIG. 4.
FIG. 4.
Microscopic images of filter arrangement of the device: (a) 3D image of the complete device, (b) array of pillar filters (width 5.56 μm and 30 μm height) arranged in the t-flow mode, (c) particle collection reservoir with pillar microfilters arranged in the n-flow mode, (d) t-flow arrangement of weir filters (1.5–2 μm) bound via a dead-end weir filter, (e) tilted image of a single weir filter, and (f) height of weir as 1.42 μm measured using a stylus profiler.
FIG. 5.
FIG. 5.
Size-based particle capture inside the microchannel with a filter gap of 5.1 μm: (a) flow of 5 μm particle suspension did not get captured near filters, (b) 10 μm diameter particles are captured in the reservoir and some crossflow filters also near the inlet region, (c) 20 μm diameter particles captured and filled the n-flow zone first and the region near inlet is empty, (d) suspension of 5 μm and 10 μm particles also showed partial filling of the capture, whereas some accumulated near t-flow regions.
FIG. 6.
FIG. 6.
Particle microfiltration through the device: (a) baseline flow profile of device, (b) filtration of polystyrene beads of diameters 10, 5, and 1 μm through the device, (c) magnified view of different sections of the device with the larger particles (10 μm) filtered in filter section 1 (at 20×), filtration of intermediate sized, i.e., 5 μm in weir filter section 2 (at 20×) and 3 (at 50×). 1 μm sized beads are found in section 4 (at 20×) of the device.
FIG. 7.
FIG. 7.
Filtration of 10 μm particle in a polydisperse particle suspension with concentrations (wt. %) as (a) 0.125, (b) 0.375, (c) 0.625, and (d) 0.875.
FIG. 8.
FIG. 8.
Particle concentration and channel volume filling comparison obtained by 10 μm monodisperse particle suspension. Analytically calculated volume and count of microparticles for given concentration are compared with experimentally obtained filled microchannel volume with equivalent particle concentrations.
FIG. 9.
FIG. 9.
Variation in the throughput behavior of the device with suspension concentration and time.
FIG. 10.
FIG. 10.
Dominating clogging mechanisms in the device are (a) pore blocking, (b)cake layer buildup, and (c) decline in permeate flow rate with clogging (no. of measurements, n = 3).
FIG. 11.
FIG. 11.
Effect of alternating pressure on filtration through the device. (a) At a constant pressure, the permeate flow declined due to particle retention and partial clogging of filter gaps. With the application of alternating pressure cycles in (b) to (e), the permeate flow rate improved. (f) Summary of #cycles are shown graphically and (g) multiple measurements of permeate flow for control (PBS) and 0.3% polystyrene bead suspension before and after alternating pressure excitations for three devices (n = 3). Value 0 on #cycle axis indicates average flow rate measured at constant pressure (100 mbar), 1–4 at alternating pressure cycles from 0 to 100 mbar at 0.1 s rate, 5 and 6 represent the flow rate measured at alternating pressure from 0 to 300 mbar at 0.1 s rate.
FIG. 12.
FIG. 12.
Effect of pressure perturbation on channel filling with varying particle concentrations (wt. %) of (a) 0.5% and (b) 1%.
FIG. 13.
FIG. 13.
Blood cell filtration through the device shows the WBCs captured in (a) the pillar region with a magnified image showing the WBC collection near the filters. Some of the WBCs also got caught in the weir section. (b) The capture efficiency for WBCs for a given flow rate. Microscopic images of the blood sample (c) before and (d) after separation. For cell separation analysis, the blood sample is processed for staining and enumeration of white blood cells using a hemocytometer. Unstained and stained cells are shown in the zoomed sections of the images.
FIG. 14.
FIG. 14.
RBCs captured in the weir filter section. Different volume of blood suspension followed by 10 μl of PBS buffer introduced to the device at 10 mbar pressure. (a) Channel fill level increased with sample volume. (b) Effect of alternating pressure on trapped white blood cells in crossflow regions; under constant applied pressure cells accumulate near crossflow filters, cell aggregates move under alternating pressure (amplitude 10 mbar at rate 0.1 s) and form bigger cell aggregates expanding toward the channel center higher velocity region and move with the forward carrier flow. (c) Magnified regions where WBCs accumulated.

References

    1. Gubala V., Harris L. F., Ricco A. J., Tan M. X., and Williams D. E., “Point of care diagnostics: Status and future,” Anal. Chem. 84(2), 487–515 (2011). 10.1021/ac2030199 - DOI - PubMed
    1. Lafleur J. P., Jönsson A., Senkbeil S., and Kutter J. P., “Recent advances in lab-on-a-chip for biosensing applications,” Biosens. Bioelectron. 76, 213–233 (2016). 10.1016/j.bios.2015.08.003 - DOI - PubMed
    1. Gomez F. A., “The future of microfluidic point-of-care diagnostic devices,” Bioanalysis 5(1), 1–3 (2013). 10.4155/bio.12.307 - DOI - PubMed
    1. Ziaie B. et al, “Hard and soft micromachining for BioMEMS: Review of techniques and examples of applications in microfluidics and drug delivery,” Adv. Drug Delivery Rev. 56(2), 145–172 (2004). 10.1016/j.addr.2003.09.001 - DOI - PubMed
    1. Khan I. U., Serra C. A., Anton N., and Vandamme T., “Microfluidics: A focus on improved cancer targeted drug delivery systems,” J. Control. Release 172(3), 1065–1074 (2013). 10.1016/j.jconrel.2013.07.028 - DOI - PubMed

LinkOut - more resources