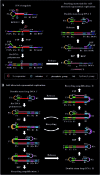
Construction of a self-directed replication system for label-free and real-time sensing of repair glycosylases with zero background
- PMID: 32206275
- PMCID: PMC7069502
- DOI: 10.1039/c9sc04738g
Construction of a self-directed replication system for label-free and real-time sensing of repair glycosylases with zero background
Abstract
Genomic DNA damage and repair are involved in multiple fundamental biological processes, including metabolism, disease, and aging. Inspired by the natural repair mechanism in vivo, we demonstrate for the first time the construction of a self-directed replication system for label-free and real-time sensing of repair glycosylases with zero background. The presence of DNA glycosylase can catalyze the excision repair of the damaged base, successively autostarting the self-directed replication through recycling polymerization extension and strand-displacement DNA synthesis for the generation of exponentially amplified dsDNAs. The resultant dsDNA products can be label-free and real-time monitored with SYBR Green I as the fluorescent indicator. Owing to the high efficiency of self-directed exponential replication and the absolute zero background resulting from the efficient inhibition of nonspecific amplification induced by multiple primer-dependent amplification, this strategy exhibits high sensitivity with a detection limit of 1 × 10⁻⁸ U μL-1 in vitro and 1 cell in vivo, and it can be further used to screen inhibitors, quantify DNA glycosylase from diverse cancer cells, and even monitor various repair enzymes by simply changing the specific damaged base in the DNA template. Importantly, this assay can be performed in a label-free, real-time and isothermal manner with the involvement of only a single type of polymerase, providing a simple, robust and universal platform for repair enzyme-related biomedical research and clinical therapeutics.
This journal is © The Royal Society of Chemistry 2020.
Figures


Similar articles
-
Controllable Autocatalytic Cleavage-Mediated Fluorescence Recovery for Homogeneous Sensing of Alkyladenine DNA Glycosylase from Human Cancer Cells.Theranostics. 2019 Jun 9;9(15):4450-4460. doi: 10.7150/thno.35393. eCollection 2019. Theranostics. 2019. PMID: 31285772 Free PMC article.
-
Base excision repair mediated cascading triple-signal amplification for the sensitive detection of human alkyladenine DNA glycosylase.Analyst. 2019 May 7;144(9):3064-3071. doi: 10.1039/c9an00200f. Epub 2019 Mar 27. Analyst. 2019. PMID: 30916676
-
Base-Excision-Repair-Induced Construction of a Single Quantum-Dot-Based Sensor for Sensitive Detection of DNA Glycosylase Activity.Anal Chem. 2016 Aug 2;88(15):7523-9. doi: 10.1021/acs.analchem.6b00664. Epub 2016 Jul 22. Anal Chem. 2016. PMID: 27401302
-
[Quantitative PCR in the diagnosis of Leishmania].Parassitologia. 2004 Jun;46(1-2):163-7. Parassitologia. 2004. PMID: 15305709 Review. Italian.
-
New paradigms in the repair of oxidative damage in human genome: mechanisms ensuring repair of mutagenic base lesions during replication and involvement of accessory proteins.Cell Mol Life Sci. 2015 May;72(9):1679-98. doi: 10.1007/s00018-014-1820-z. Epub 2015 Jan 10. Cell Mol Life Sci. 2015. PMID: 25575562 Free PMC article. Review.
Cited by
-
Portable Heating System Based on a Liquid Metal Bath for Rapid PCR.ACS Omega. 2022 Jul 20;7(30):26165-26173. doi: 10.1021/acsomega.2c01824. eCollection 2022 Aug 2. ACS Omega. 2022. PMID: 35936432 Free PMC article.
-
A controlled T7 transcription-driven symmetric amplification cascade machinery for single-molecule detection of multiple repair glycosylases.Chem Sci. 2021 Mar 12;12(15):5544-5554. doi: 10.1039/d1sc00189b. Chem Sci. 2021. PMID: 34168791 Free PMC article.
-
CRISPR/Cas12a trans-cleavage triggered by cleavage ligation of dumbbell DNA for specific detection of human 8-oxoguanine DNA glycosylase activity.Mikrochim Acta. 2023 Nov 16;190(12):468. doi: 10.1007/s00604-023-06050-0. Mikrochim Acta. 2023. PMID: 37968435
-
Signal-on/signal-off bead-based assays for the multiplexed monitoring of base excision repair activities by flow cytometry.Anal Bioanal Chem. 2022 Mar;414(6):2029-2040. doi: 10.1007/s00216-021-03849-9. Epub 2022 Jan 23. Anal Bioanal Chem. 2022. PMID: 35066600
References
-
- Schärer O. D. Angew. Chem., Int. Ed. 2003;42:2946–2974. - PubMed
-
- Han S. H., Hahm S.-H., Tran A. H. V., Park J. W., Chung J. H., Park G. T., Han Y. S. Bull. Korean Chem. Soc. 2015;36:2451–2457.
-
- Leung C.-H., Zhong H.-J., He H.-Z., Lu L., Chan D. S.-H., Ma D.-L. Chem. Sci. 2013;4:3781–3795.
LinkOut - more resources
Full Text Sources

