. 2020 Feb 13;11(3):1365-1382.
doi: 10.1364/BOE.386419. eCollection 2020 Mar 1.

In vivo assessment of functional and morphological alterations in tumors under treatment using OCT-angiography combined with OCT-elastography

Affiliations

In vivo assessment of functional and morphological alterations in tumors under treatment using OCT-angiography combined with OCT-elastography

Marina A Sirotkina et al. Biomed Opt Express. .

Abstract

Emerging methods of anti-tumor therapies require new approaches to tumor response evaluation, especially enabling label-free diagnostics and in vivo utilization. Here, to assess the tumor early reaction and predict its long-term response, for the first time we apply in combination the recently developed OCT extensions - optical coherence angiography (OCA) and compressional optical coherence elastography (OCE), thus enabling complementary functional/microstructural tumor characterization. We study two vascular-targeted therapies of different types, (1) anti-angiogenic chemotherapy (ChT) and (2) photodynamic therapy (PDT), aimed to indirectly kill tumor cells through blood supply injury. Despite different mechanisms of anti-angiogenic action for ChT and PDT, in both cases OCA demonstrated high sensitivity to blood perfusion cessation. The new method of OCE-based morphological segmentation revealed very similar histological structure alterations. The OCE results showed high correlation with conventional histology in evaluating percentages of necrotic and viable tumor zones. Such possibilities make OCE an attractive tool enabling previously inaccessible in vivo monitoring of individual tumor response to therapies without taking multiple biopsies.


Conflict of interest statement

The authors declare that there are no conflicts of interest related to this article.

Figures

Fig. 1.
Fig. 1.
Schematic of OCA data acquisition and signal processing.
Fig. 2.
Fig. 2.
Schematic of OCE data acquisition and signal processing.
Fig. 3.
Fig. 3.
Design of experiments on chemotherapy (ChT).
Fig. 4.
Fig. 4.
Design of experiments on photodynamic therapy (PDT).
Fig. 5.
Fig. 5.
Effect of ChT on tumor CT26. (a) Monitoring of relative tumor volume changes for bevacizumab (n = 10) and control (n = 10) groups. Data are shown as mean ± SD. Asterisks * denote statistically significant difference between bevacizumab and control groups, p ≤ 0.05. (b) Histological images (H&E) of control and bevacizumab-treated tumors. Blue arrows indicate viable tumor cells; orange arrows indicate desquamation of the endothelium of the vascular wall and moderate plethora of blood vessels; black arrows indicate hemorrhages and edema; yellow arrows indicate ischemic necrosis of the tumor cells.
Fig. 6.
Fig. 6.
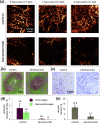
Monitoring of tumor’s blood vessel reaction to anti-angiogenic ChT with bevacizumab by means of (a) in vivo real time OCA imaging; (b) corresponding fluorescent images and (c) IHC images (CD31 staining of blood vessels) in control tumors and 5 days post start of ChT. (d) perfused vessels density, determined on OCA and fluorescent images, (e) vascular density, determined on IHC images.
Fig. 7.
Fig. 7.
In vivo OCE monitoring of tumor response to ChT for control and bevacizumab-treated tumors at 3 time points: (a) Stiffness-percentage graphs illustrating the shift of the normalized stiffness spectrum (total area under the curve is 100%) to lower values for bevacizumab-treated tumors (gray lines) in compered with control tumor (black lines); (b) Segmented OCE images demonstrating various tumor zones (viable tumor cells, dystrophic tumor cells, edema and necrosis of tumor cells); (c) Percentages of pixels (left vertical axes) belonging to different stiffness ranges for the control group and bevacizumab-treated one (blue, light blue, yellow and red columns). The dashed purple lines and right vertical axes show percentage of perfused vessels density. Asterisk * indicates statistically significant difference in the areas of necrotic tumor cells between the bevacizumab and control groups, p ≤ 0.05. The color palette on the right indicates the stiffness ranges corresponding to each color in the bar graphs and segmented OCE images.
Fig. 8.
Fig. 8.
Effect of PDT on CT26. (a) Monitoring of relative tumor volume changes for responders (n = 7), non-responders (n = 3) and control (n = 10) tumors. Data are shown as mean ± SD. Tumor growth was statistically significant inhibited by PDT in the responders. Asterisk * denotes statistically significant difference of responders and non-responders from control ones (p ≤ 0.05) and # denotes statistically significant difference of responders from non-responders (p ≤ 0.05). (b) H&E histological images of CT26 tumors. Black arrows indicate hemorrhage; green arrows indicate vascular thrombosis; blue arrows indicate viable tumor cells; white arrows show clusters of dystrophic tumor cells; yellow arrows show necrosis of tumor cells.
Fig. 9.
Fig. 9.
Monitoring of early tumor’s blood vessels reaction to vascular-targeted PDT by means of (a) in vivo real time OCA imaging, (b) corresponding fluorescent images and (c) IHC images (by CD31 staining) of blood vessels in control tumors and 24 hours post PDT, (d) – perfused vessels density, determined on OCA and fluorescence images, (e) vascular density, determined on IHC images.
Fig. 10.
Fig. 10.
In vivo OCE monitoring of tumor response to PDT: (a) Stiffness-percentage graphs illustrating the shift of the stiffness spectrum (total area under the curves is 100%), (b) Segmented OCE images demonstrated various tumor zones (viable tumor cells, dystrophic tumor cells, edema and necrosis of tumor cells); (c) Percentage of pixels (left vertical axes) belonging to the specific stiffness ranges for different morphological zones (blue, light blue, yellow and red columns). The dashed purple lines and right vertical axes show percentage of perfused vessels density. No significant stiffness changes were noted in the control tumors with strong dominance of viable tumor zone, whereas for non-responders and responders, the most stiff viable tumor zones (blue color) in (b) and (c) strongly diminished at day 6 post PDT, when responders showed total necrosis (red color) on the segmented OCE images. Asterisk * denotes statistically significant difference of responders from non-responders in percentage of the necrosis area, p ≤ 0.05. # denotes statistically significant difference of non-responders from responders in percentage of the viable tumor cells, p ≤ 0.05.

References

    1. Kang H., Lee H. Y., Lee K. S., Kim J. H., “Imaging-based tumor treatment response evaluation: review of conventional, new, and emerging concepts,” Korean J. Radiol. 13(4), 371–390 (2012).10.3348/kjr.2012.13.4.371 - DOI - PMC - PubMed
    1. Eisenhauer E. A., Therasse P., Bogaerts J., Schwartz L. H., Sargent D., Ford R., Dancey J., Arbuck S., Gwyther S., Mooney M., Rubinstein L., Shankar L., Dodd L., Kaplan R., Lacombe D., Verweij J., “New response evaluation criteria in solid tumours: revised RECIST guideline (version 1.1),” Eur. J. Cancer 45(2), 228–247 (2009).10.1016/j.ejca.2008.10.026 - DOI - PubMed
    1. Demidov V., Matveev L. A., Demidova O., Matveyev A. L., Zaitsev V. Y., Flueraru C., Vitkin I. A., “Analysis of low-scattering regions in optical coherence tomography: applications to neurography and lymphangiography,” Biomed. Opt. Express 10(8), 4207–4219 (2019).10.1364/BOE.10.004207 - DOI - PMC - PubMed
    1. Standish B. A., Lee K. K., Jin X., Mariampillai A., Munce N. R., Wood M. F., Wilson B. C., Vitkin I. A., Yang V. X., “Interstitial Doppler optical coherence tomography as a local tumor necrosis predictor in photodynamic therapy of prostatic carcinoma: an in vivo study,” Cancer Res. 68(23), 9987–9995 (2008).10.1158/0008-5472.CAN-08-1128 - DOI - PubMed
    1. Sirotkina M. A., Matveev L. A., Shirmanova M. V., Zaitsev V. Y., Buyanova N. L., Elagin V. V., Gelikonov G. V., Kuznetsov S. S., Kiseleva E. B., Moiseev A. A., Gamayunov S. V., Zagaynova E. V., Feldchtein F. I., Vitkin A., Gladkova N. D., “Photodynamic therapy monitoring with optical coherence angiography,” Sci. Rep. 7(1), 41506 (2017).10.1038/srep41506 - DOI - PMC - PubMed

LinkOut - more resources