

Splicing factor SRSF1 controls T cell homeostasis and its decreased levels are linked to lymphopenia in systemic lupus erythematosus
- PMID: 32206811
- PMCID: PMC7825486
- DOI: 10.1093/rheumatology/keaa094
Splicing factor SRSF1 controls T cell homeostasis and its decreased levels are linked to lymphopenia in systemic lupus erythematosus
Abstract
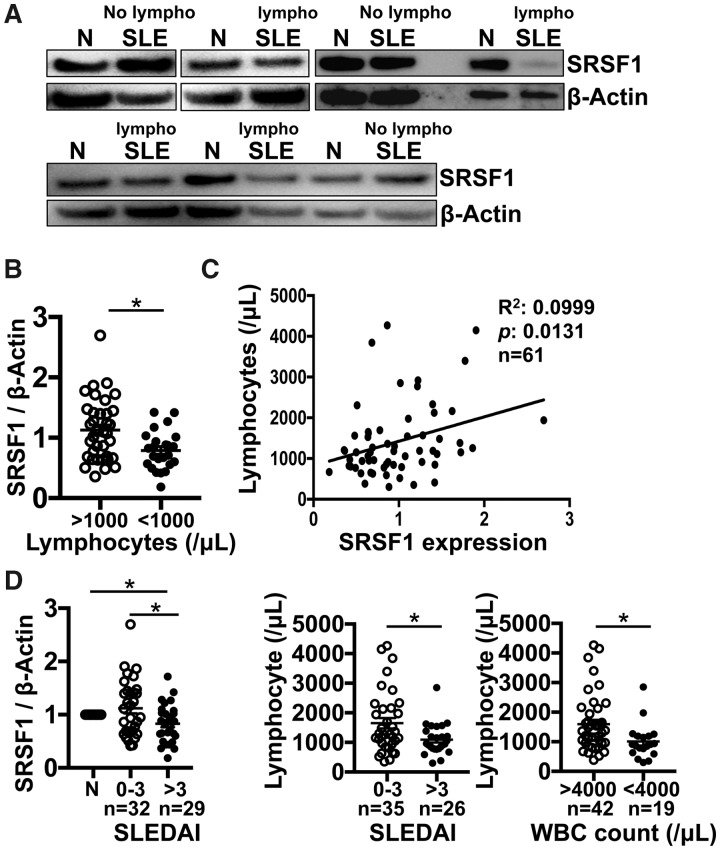
Objective: Lymphopenia is a frequent clinical manifestation and risk factor for infections in SLE, but the underlying mechanisms are not fully understood. We previously identified novel roles for the RNA-binding protein serine arginine-rich splicing factor 1 (SRSF1) in the control of genes involved in signalling and cytokine production in human T cells. SRSF1 is decreased in T cells from patients with SLE and associates with severe disease. Because SRSF1 controls the expression of apoptosis-related genes, we hypothesized that SRSF1 controls T cell homeostasis and, when reduced, leads to lymphopenia.
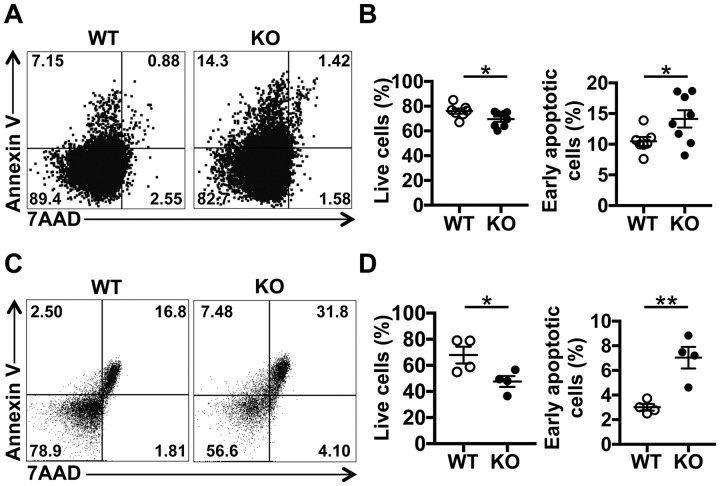
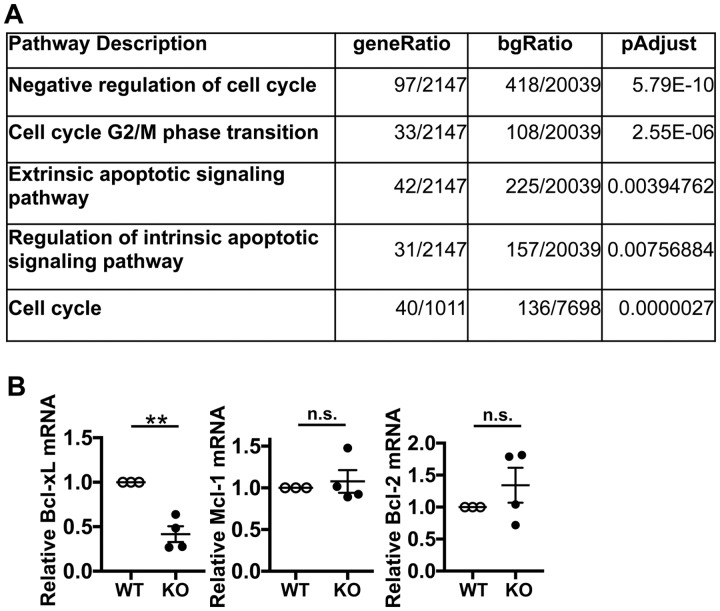
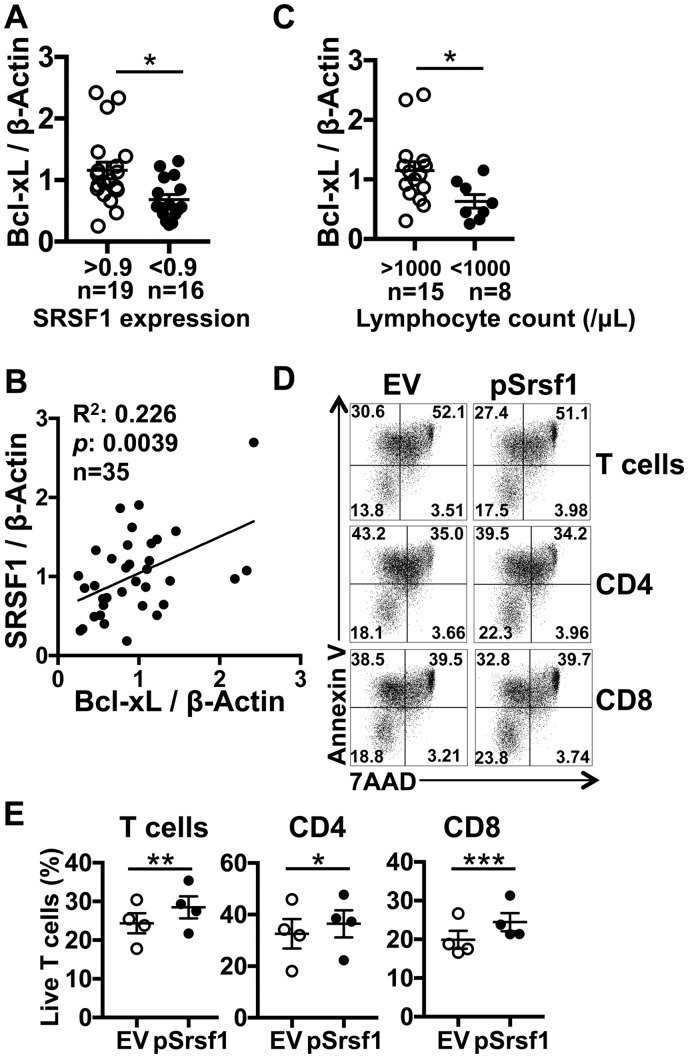
Methods: We evaluated SRSF1 expression in T cells from SLE patients by immunoblots and analysed its correlation with clinical parameters. T cell conditional Srsf1 knockout mice were used to evaluate lymphoid cells and apoptosis by flow cytometry. Quantitative PCR and immunoblots were used to assess Bcl-xL mRNA and protein expression. SRSF1 overexpression was performed by transient transfections by electroporation.
Results: We found that low SRSF1 levels correlated with lymphopenia in SLE patients. Selective deletion of Srsf1 in T cells in mice led to T cell lymphopenia, with increased apoptosis and decreased expression of the anti-apoptotic Bcl-xL. Lower SRSF1 expression correlated with low Bcl-xL levels in T cells and lower Bcl-xL levels associated with lymphopenia in SLE patients. Importantly, overexpression of SRSF1 rescued survival of T cells from patients with SLE.
Conclusion: Our studies uncovered a previously unrecognized role for SRSF1 in the control of T cell homeostasis and its reduced expression as a molecular defect that contributes to lymphopenia in systemic autoimmunity.
Keywords: Bcl-xL; SRSF1; T cells; homeostasis; lymphopenia; systemic lupus erythematosus.
© The Author(s) 2020. Published by Oxford University Press on behalf of the British Society for Rheumatology. All rights reserved. For permissions, please email: journals.permissions@oup.com.
Figures

Similar articles
-
Estrogen-Induced hsa-miR-10b-5p Is Elevated in T Cells From Patients With Systemic Lupus Erythematosus and Down-Regulates Serine/Arginine-Rich Splicing Factor 1.Arthritis Rheumatol. 2021 Nov;73(11):2052-2058. doi: 10.1002/art.41787. Epub 2021 Sep 29. Arthritis Rheumatol. 2021. PMID: 33982889 Free PMC article.
-
Decreased Expression of Serine/Arginine-Rich Splicing Factor 1 in T Cells From Patients With Active Systemic Lupus Erythematosus Accounts for Reduced Expression of RasGRP1 and DNA Methyltransferase 1.Arthritis Rheumatol. 2018 Dec;70(12):2046-2056. doi: 10.1002/art.40585. Epub 2018 Oct 1. Arthritis Rheumatol. 2018. PMID: 29905030
-
Ubiquitination regulates expression of the serine/arginine-rich splicing factor 1 (SRSF1) in normal and systemic lupus erythematosus (SLE) T cells.J Biol Chem. 2014 Feb 14;289(7):4126-34. doi: 10.1074/jbc.M113.518662. Epub 2013 Dec 24. J Biol Chem. 2014. PMID: 24368769 Free PMC article. Clinical Trial.
-
[Systemic lupus erythematosus and lymphopenia: Clinical and pathophysiological features].Rev Med Interne. 2017 Sep;38(9):603-613. doi: 10.1016/j.revmed.2017.01.005. Epub 2017 Feb 15. Rev Med Interne. 2017. PMID: 28214184 Review. French.
-
Metabolic regulation of organelle homeostasis in lupus T cells.Clin Immunol. 2012 Sep;144(3):200-13. doi: 10.1016/j.clim.2012.07.001. Epub 2012 Jul 13. Clin Immunol. 2012. PMID: 22836085 Free PMC article. Review.
Cited by
-
Glucocorticoids regulate the expression of Srsf1 through Hdac4/Foxc1 axis to induce apoptosis of osteoblasts.Commun Biol. 2025 Apr 4;8(1):566. doi: 10.1038/s42003-025-07989-x. Commun Biol. 2025. PMID: 40186004 Free PMC article.
-
Splicing factor SRSF1 limits IFN-γ production via RhoH and ameliorates experimental nephritis.Rheumatology (Oxford). 2021 Jan 5;60(1):420-429. doi: 10.1093/rheumatology/keaa300. Rheumatology (Oxford). 2021. PMID: 32810232 Free PMC article.
-
Development of a prediction model for in-hospital mortality in immunocompromised chronic kidney diseases patients with severe infection.BMC Nephrol. 2025 Feb 13;26(1):78. doi: 10.1186/s12882-025-04002-9. BMC Nephrol. 2025. PMID: 39948484 Free PMC article.
-
The RNA binding protein SRSF1 is a master switch of gene expression and regulation in the immune system.Cytokine Growth Factor Rev. 2021 Feb;57:19-26. doi: 10.1016/j.cytogfr.2020.10.008. Epub 2020 Nov 2. Cytokine Growth Factor Rev. 2021. PMID: 33160830 Free PMC article. Review.
-
RNA Methylation in Systemic Lupus Erythematosus.Front Cell Dev Biol. 2021 Jul 7;9:696559. doi: 10.3389/fcell.2021.696559. eCollection 2021. Front Cell Dev Biol. 2021. PMID: 34307373 Free PMC article. Review.
References
Publication types
MeSH terms
Substances
Grants and funding
LinkOut - more resources
Full Text Sources
Medical
Research Materials
