

Alcohol consumption in relation to carotid subclinical atherosclerosis and its progression: results from a European longitudinal multicentre study
- PMID: 32206896
- PMCID: PMC7867553
- DOI: 10.1007/s00394-020-02220-5
Alcohol consumption in relation to carotid subclinical atherosclerosis and its progression: results from a European longitudinal multicentre study
Abstract
Background/aim: The association between alcohol consumption and subclinical atherosclerosis is still unclear. Using data from a European multicentre study, we assess subclinical atherosclerosis and its 30-month progression by carotid intima-media thickness (C-IMT) measurements, and correlate this information with self-reported data on alcohol consumption.
Methods: Between 2002-2004, 1772 men and 1931 women aged 54-79 years with at least three risk factors for cardiovascular disease (CVD) were recruited in Italy, France, Netherlands, Sweden, and Finland. Self-reported alcohol consumption, assessed at baseline, was categorized as follows: none (0 g/d), very-low (0 - 5 g/d), low (> 5 to ≤ 10 g/d), moderate (> 10 to ≤ 20 g/d for women, > 10 to ≤ 30 g/d for men) and high (> 20 g/d for women, > 30 g/d for men). C-IMT was measured in millimeters at baseline and after 30 months. Measurements consisted of the mean and maximum values of the common carotids (CC), internal carotid artery (ICA), and bifurcations (Bif) and whole carotid tree. We used quantile regression to describe the associations between C-IMT measures and alcohol consumption categories, adjusting for sex, age, physical activity, education, smoking, diet, and latitude.
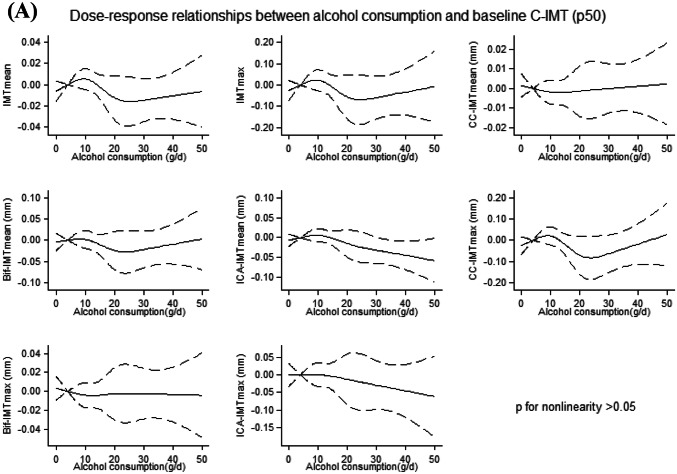
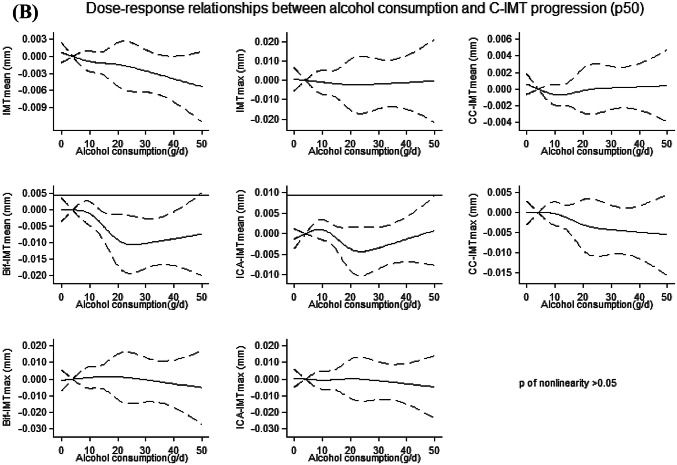
Results: Adjusted differences between median C-IMT values in different levels of alcohol consumption (vs. very-low) showed that moderate alcohol consumption was associated with lower C-IMTmax[- 0.17(95%CI - 0.32; - 0.02)], and Bif-IMTmean[- 0.07(95%CI - 0.13; - 0.01)] at baseline and decreasing C-IMTmean[- 0.006 (95%CI - 0.011; - 0.000)], Bif-IMTmean[- 0.016(95%CI - 0.027; - 0.005)], ICA-IMTmean[- 0.009(95% - 0.016; - 0.002)] and ICA-IMTmax[- 0.016(95%: - 0.032; - 0.000)] after 30 months. There was no evidence of departure from linearity in the association between alcohol consumption and C-IMT.
Conclusion: In this European population at high risk of CVD, findings show an inverse relation between moderate alcohol consumption and carotid subclinical atherosclerosis and its 30-month progression, independently of several potential confounders.
Keywords: Alcohol drinking; Atherosclerosis; Carotid intima-media thickness; Epidemiology; Progression.
Conflict of interest statement
The authors declare that there is no conflict of interest.
Figures
References
-
- Libby P, Ridker PM, Hansson GK. Progress and challenges in translating the biology of atherosclerosis. Nature. 2011;473(7347):317–325. - PubMed
-
- Pant S, et al. Inflammation and atherosclerosis–revisited. J Cardiovasc Pharmacol Ther. 2014;19(2):170–178. - PubMed
-
- Nezu T, et al. Carotid intima-media thickness for atherosclerosis. J Atheroscler Thromb. 2016;23(1):18–31. - PubMed
-
- Huang Y, et al. Moderate alcohol consumption and atherosclerosis : Meta-analysis of effects on lipids and inflammation. Wien Klin Wochenschr. 2017;129(21–22):835–843. - PubMed
Publication types
MeSH terms
Grants and funding
LinkOut - more resources
Full Text Sources
Medical
Miscellaneous
