. 2020 Mar 23;15(1):4.
doi: 10.1186/s13021-020-00139-2.

Mapping deep peat carbon stock from a LiDAR based DTM and field measurements, with application to eastern Sumatra

Affiliations

Mapping deep peat carbon stock from a LiDAR based DTM and field measurements, with application to eastern Sumatra

Ronald Vernimmen et al. Carbon Balance Manag. .

Abstract

Background: Reduction of carbon emissions from peatlands is recognized as an important factor in global climate change mitigation. Within the SE Asia region, areas of deeper peat present the greatest carbon stocks, and therefore the greatest potential for future carbon emissions from degradation and fire. They also support most of the remaining lowland swamp forest and its associated biodiversity. Accurate maps of deep peat are central to providing correct estimates of peat carbon stocks and to facilitating appropriate management interventions. We present a rapid and cost-effective approach to peat thickness mapping in raised peat bogs that applies a model of peat bottom elevation based on field measurements subtracted from a surface elevation model created from airborne LiDAR data.

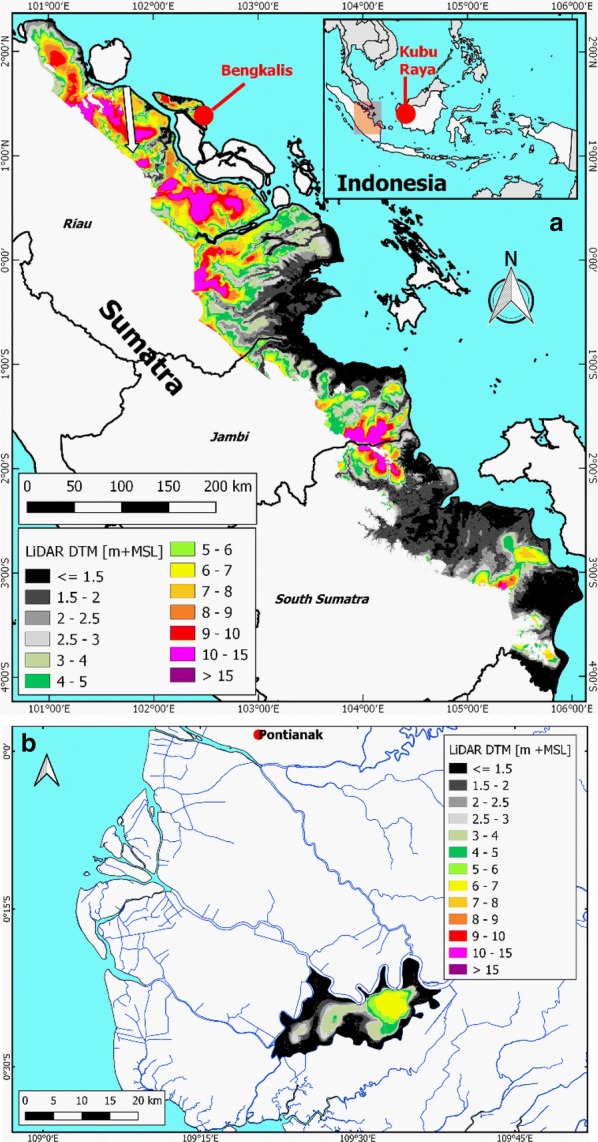
Results: In two raised peat bog test areas in Indonesia, we find that field peat thickness measurements correlate well with surface elevation derived from airborne LiDAR based DTMs (R2 0.83-0.88), confirming that the peat bottom is often relatively flat. On this basis, we created a map of extent and depth of deep peat (> 3 m) from a new DTM that covers two-thirds of Sumatran peatlands, applying a flat peat bottom of 0.61 m +MSL determined from the average of 2446 field measurements. A deep peat area coverage of 2.6 Mha or 60.1% of the total peat area in eastern Sumatra is mapped, suggesting that deep peat in this region is more common than shallow peat and its extent was underestimated in earlier maps. The associated deep peat carbon stock range is 9.0-11.5 Pg C in eastern Sumatra alone.

Conclusion: We discuss how the deep peat map may be used to identify priority areas for peat and forest conservation and thereby help prevent major potential future carbon emissions and support the safeguarding of the remaining forest and biodiversity. We propose rapid application of this method to other coastal raised bog peatland areas in SE Asia in support of improved peatland zoning and management. We demonstrate that the upcoming global ICESat-2 and GEDI satellite LiDAR coverage will likely result in a global DTM that, within a few years, will be sufficiently accurate for this application.

Keywords: Below-ground carbon stock; ICESat-2 DTM; LiDAR; Lowland; Peat; Peat thickness; Sumatra.


Conflict of interest statement

SEP was a member of the scientific advisory board for the IPP competition but only joined the author team for this paper after the IPP competition had concluded. The other authors declare no competing interests.

Figures

Fig. 1
Fig. 1
a Eastern Sumatra lowland DTM area [69] where peat was mapped in this study. Indicated with red dots the areas where the mapping methodology was validated. The ICESat-2 profile location over Giam Siak Kecil—Bukit Batu Biosphere Reserve shown in Fig. 12 is shown with the white arrow. b The LiDAR DTM for the Kubu Raya study area
Fig. 2
Fig. 2
Illustration of how peat thickness is determined as the difference between the peat surface and depth of the peat bottom (interface with the mineral substrate)
Fig. 3
Fig. 3
Peat extent boundary (red line) in the Bengkalis study area that was delineated based on visual interpretation of (a) background RGB composite (spectral bands 6-7-5) Landsat-1 image of 5 October 1972 and peat thickness measurements (black and white dots). For comparison, the peat extent boundary is also shown on (b) Sentinel-2 background RGB image of 4 August 2016 (spectral bands 11-8-5). Note that nearly all peat was still forested in 1972
Fig. 4
Fig. 4
Peat thickness measurement locations in Bengkalis (a) and Kubu Raya (b) study areas (red lines). In the background airborne LiDAR derived DTMs (Bengkalis: [71]; Kubu Raya: [70]). Locations of cross sections shown in Fig. 6 are indicated with white arrows. The ICESat-2 profile location over Bengkalis shown in Fig. 12 is shown with the red arrow
Fig. 5
Fig. 5
Peat thickness measurements plotted against elevation as determined from the airborne LiDAR DTM for the a Bengkalis (n = 219) and b Kubu Raya (n = 180) study areas
Fig. 6
Fig. 6
Cross sections over the a Bengkalis and b Kubu Raya peat domes, showing LiDAR derived surface elevation (DTM) and the peat bottom as derived from field measurements. Locations of cross sections are shown in Fig. 4
Fig. 7
Fig. 7
Peat thickness models for a Bengkalis and b Kubu Raya as derived from airborne LiDAR based DTM and applying a constant peat bottom elevation of 0.41 and 0.30 m +MSL, respectively (Table 1). Peat thickness difference as calculated from the measurements and the peat thickness model is also shown
Fig. 8
Fig. 8
Maximum deep peat areas in eastern Sumatra, mapped by subtracting a flat peat bottom of 0 m +MSL from the airborne LiDAR based DTM for eastern Sumatra (Fig. 1). Location of peat bottom measurement locations are shown with the white (peat bottom below 2 m +MSL) and purple (peat bottom above 2 m +MSL) dots. The DTM extent applied in the analysis is indicated by coloured (brown and grey) areas
Fig. 9
Fig. 9
Most likely deep peat areas in eastern Sumatra (Table 1), mapped by subtracting a flat peat bottom of 0.61 m +MSL from the airborne LiDAR based DTM for eastern Sumatra (Fig. 1). Probable peat extent according to [56] is shown as black dots. The DTM extent applied in the analysis is indicated by coloured (brown and grey) areas
Fig. 10
Fig. 10
Map of land surface elevation in the Eastern part of South Sumatra, and peat extent [56]. Grey dots indicate locations where peat thickness measured between 2013 and 2016 is less than 3 m and black dots greater than 3 m. White dots are locations without peat
Fig. 11
Fig. 11
a 3D model of eastern Sumatra DTM (Fig. 1) superimposed with the modelled deep peat areas and 2012 forest cover [86]. The airborne LiDAR based lowland DTM was merged with a SRTM based DTM for upland areas, to show the full landscape; elevations above 10 m +MSL have sharply reduced vertical scale, by a factor 5. Shown as well the location of surface elevation profile (black line) shown in (b) Surface elevation cross section along entire eastern Sumatra DTM, at approximately 20–70 km from the coastline. Most likely deep peat surface (> 3 m) is shown assuming a peat bottom at 0.61 m +MSL. Indicated are the six major peat domes along the East Sumatra coast, from North to South: Senepis, Giam Siak Kecil—Bukit Batu Biosphere Reserve, Kampar Peninsula, Kerumutan in Riau, Berbak and Sembilang National Parks in Jambi and South Sumatra and OKI in South Sumatra Province. Note that the peat swamp forest on Kampar Peninsula and Senepis are not formally protected
Fig. 12
Fig. 12
Cross section over a Bengkalis Island and b the Giam Siak Kecil—Bukit Batu Biosphere Reserve covering peat domes along ICESat-2 flight lines, showing airborne LiDAR derived surface elevation (DTM; [69] and ICESat-2 terrain height. As current raw ICESat-2 data is referenced to the ellipsoid and requires vertical correction, it was provisionally referenced to mean sea level (MSL) by matching it to the DTM. Location of the cross sections is shown for a in Fig. 4 and b in Fig. 1

References

    1. Hooijer A, Page S, Canadell JG, Silvius M, Kwadijk J, Wösten H, et al. Current and future CO2 emissions from drained peatlands in Southeast Asia. Biogeosciences. 2010;7:1505–1514. doi: 10.5194/bg-7-1505-2010. - DOI
    1. Page SE, Rieley JO, Banks CJ. Global and regional importance of the tropical peatland carbon pool. Glob Change Biol. 2011;17:798–818. doi: 10.1111/j.1365-2486.2010.02279.x. - DOI
    1. Miettinen J, Hooijer A, Vernimmen R, Liew SC, Page SE. From carbon sink to carbon source: extensive peat oxidation in insular Southeast Asia since 1990. Environ Res Lett. 2017;12:024014. doi: 10.1088/1748-9326/aa5b6f. - DOI
    1. Gaveau DLA, Salim MA, Hergoualc’h K, Locatelli B, Sloan S, Wooster M, et al. Major atmospheric emissions from peat fires in Southeast Asia during non-drought years: evidence from the 2013 Sumatran fires. Sci Rep. 2014;4:6112. doi: 10.1038/srep06112. - DOI - PMC - PubMed
    1. Huijnen V, Wooster MJ, Kaiser JW, Gaveau DLA, Flemming J, Parrington M, et al. Fire carbon emissions over maritime southeast Asia in 2015 largest since 1997. Sci Rep. 2016;6:26886. doi: 10.1038/srep26886. - DOI - PMC - PubMed

LinkOut - more resources