

ECE2 regulates neurogenesis and neuronal migration during human cortical development
- PMID: 32207244
- PMCID: PMC7202216
- DOI: 10.15252/embr.201948204
ECE2 regulates neurogenesis and neuronal migration during human cortical development
Abstract
During embryonic development, excitatory projection neurons migrate in the cerebral cortex giving rise to organised layers. Periventricular heterotopia (PH) is a group of aetiologically heterogeneous disorders in which a subpopulation of newborn projection neurons fails to initiate their radial migration to the cortex, ultimately resulting in bands or nodules of grey matter lining the lateral ventricles. Although a number of genes have been implicated in its cause, currently they only satisfactorily explain the pathogenesis of the condition for 50% of patients. Novel gene discovery is complicated by the extreme genetic heterogeneity recently described to underlie its cause. Here, we study the neurodevelopmental role of endothelin-converting enzyme-2 (ECE2) for which two biallelic variants have been identified in two separate patients with PH. Our results show that manipulation of ECE2 levels in human cerebral organoids and in the developing mouse cortex leads to ectopic localisation of neural progenitors and neurons. We uncover the role of ECE2 in neurogenesis, and mechanistically, we identify its involvement in the generation and secretion of extracellular matrix proteins in addition to cytoskeleton and adhesion.
Keywords: cerebral organoids; endothelin-converting enzyme-2; human cortical development; neuronal migration disorders; periventricular heterotopia.
© 2020 The Authors. Published under the terms of the CC BY 4.0 license.
Conflict of interest statement
The authors declare that they have no conflict of interest.
Figures
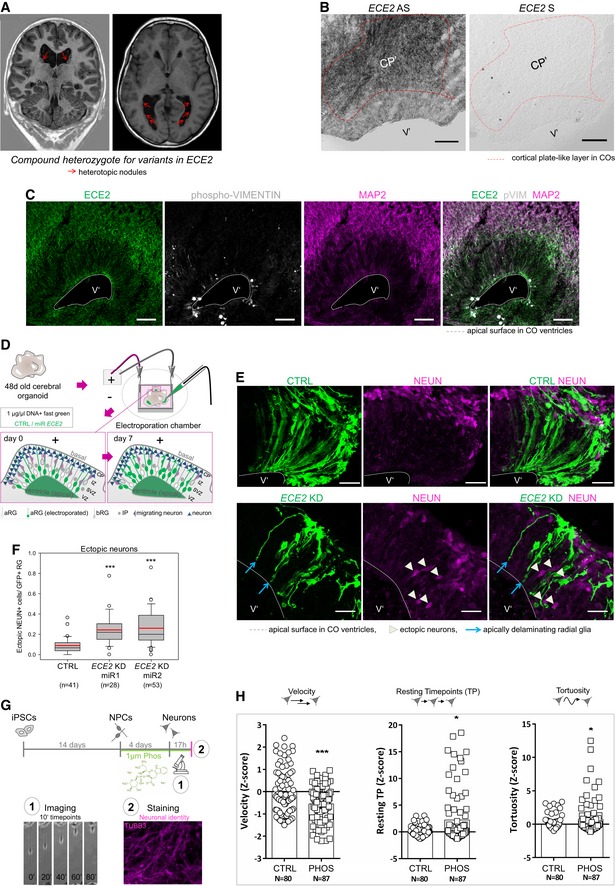
Coronal and axial brain MRI of the patient with compound heterozygote mutations in ECE2 shows nodules of heterotopic neurons lining the lateral ventricles.
ECE2 expression on RNA level. In situ hybridisation for ECE2 mRNA in 50‐day‐old cerebral organoids (COs) shows higher signal in the cortical plate‐like zone (CP′; scale bar = 100 μm).
ECE2 expression on protein level. Immunohistochemistry (IHC) for ECE2 in 50‐day‐old COs shows accumulation in the CP’ and at the apical surface (scale bar = 50 μm).
Scheme showing the electroporation of DNA into ventricles of COs and the organisation of different cell types within the germinal zone. DNA is injected into the ventricle‐like lumen and taken up by aRG’ via their apical processes. At 7 days post electroporation (dpe), the transfected construct can additionally be found in IP’s and neurons upon differentiation of transfected aRG’ (green) (aRG’, apical radial glia; bRG’, basal radial glia; CP’, cortical plate; IP’, intermediate progenitor; IZ’, intermediate zone; SVZ’, subventricular zone; VZ’, ventricular zone).
COs transfected with microRNAs targeting ECE2 (KD) or scrambled negative control (CTRL) and GFP and analysed 7 days later reveal an increase in ectopic neurons upon ECE2 KD (transfected cells are shown in green, NEUN+ neuronal nuclei in magenta; scale bar = 25 μm).
Graph depicting the number of ectopically located NEUN+ cells in CTRL and KD‐electroporated COs 7 dpe, in each ventricle normalised to the electroporated radial units, using two different microRNAs targeting ECE2. Data shown as box plot (mean = red line, median = black line, box represents 25th and 75th percentiles, whiskers extend to 10th and 90th percentiles, all outliers are shown; n = number of ventricles analysed; ***P < 0.001 in the Kruskal–Wallis one‐way ANOVA on ranks and Dunn's pairwise multiple comparison).
Scheme depicting the experimental set‐up of neuronal differentiation and time‐lapse imaging under treatment with the ECE2‐inhibitor PHOS 42.
Graphs showing different parameters of neuronal migration dynamics, tracked via live imaging. Upon ECE2 inhibition, significant decrease in velocity, increase in resting TP and increase in tortuosity are observed. Data shown as z‐scores (CTRL, DMSO control; PHOS, phosphoramidon; Resting; TP, resting time points; N, number of individual neurons analysed from two batches; Resting TP: *P = 0.024; tortuosity: *P = 0.035, ***P < 0.001 in two‐tailed chi‐square test).
- A, B
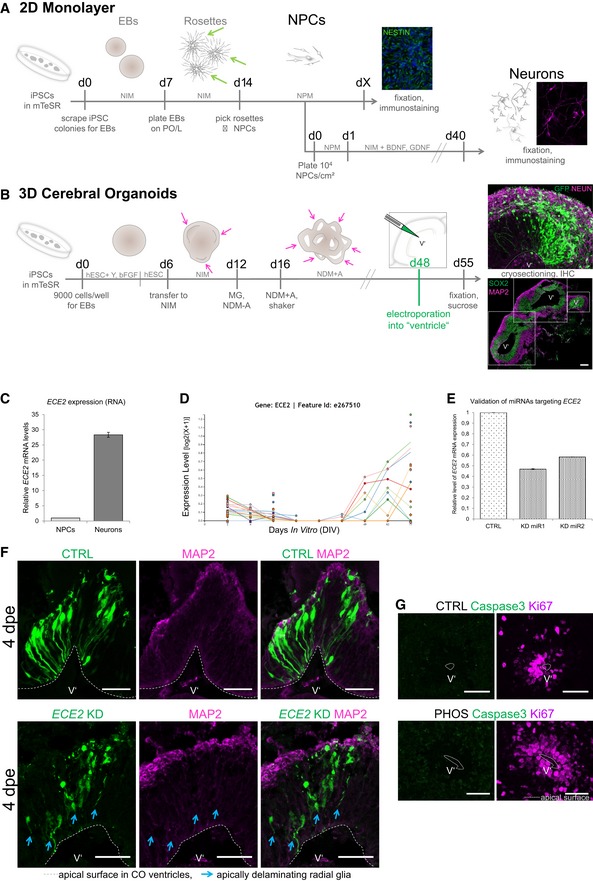
Schemes depicting the generation of NPCs and neurons in 2D (A) 31 via picking of rosettes (green arrows) and in 3D in cerebral organoids (COs, B) 32. For abbreviations, see Materials and Methods section. Single neuroepithelial regions are marked with pink arrows and with dotted boxes in (B) (scale bar = 200 μm).
- C
qPCR of in vitro‐generated iPSC‐derived NPCs vs. neurons shows higher ECE2 mRNA expression in neurons.
- D
RNA sequencing data for ECE2 at different stages of neuronal differentiation from iPSCs (
http://stemcell.libd.org/scb/ ) 40. - E
Validation of microRNAs targeting ECE2 reveals a KD efficiency of about 40–50% of control levels.
- F
Immunostaining of COs at 4 dpe upon ECE2 KD shows delamination of transfected aRG, in contrast to bipolar morphology of aRG in the control condition (aRG, apical radial glia; dpe, days postelectroporation; transfected cells are shown in green, MAP2+ neuronal processes in magenta; scale bars = 50 μm).
- G
IHC for cleaved caspase‐3 shows no difference in cell death upon ECE2 inhibition with PHOS for 14 days in COs (scale bars = 50 μm).
- A
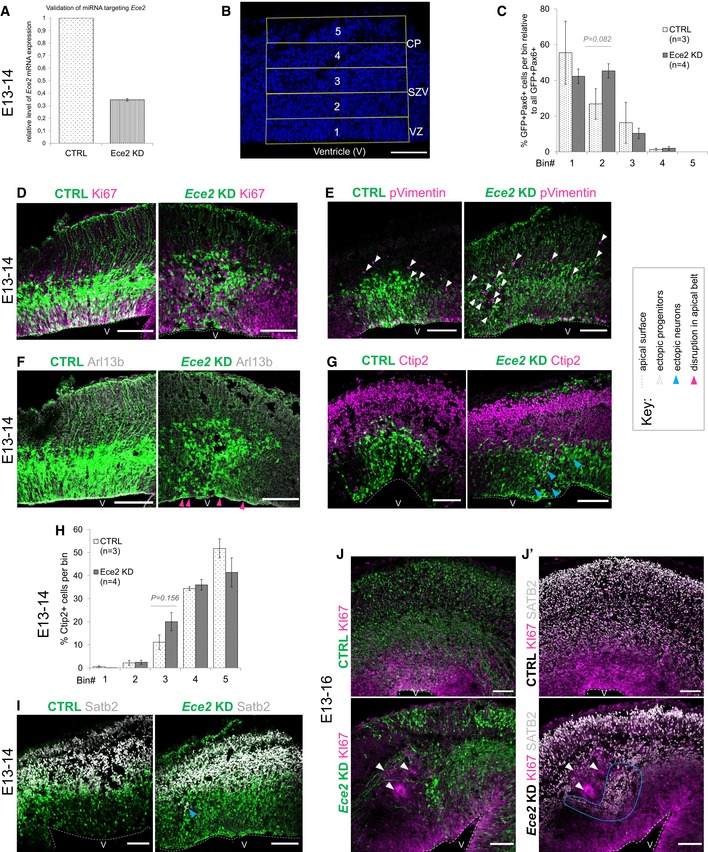
Validation of microRNA targeting Ece2 by qPCR reveals a KD efficiency of about 65% relative to control mRNA levels.
- B
Binning strategy of brains at 1 dpe: Division of the thickness of the developing cortex into five equally sized bins from VZ to CP.
- C–I
1 dpe upon Ece2 KD, proliferative progenitors acquire ectopic positions (C–E). Some deep layer (G and H) and upper layer (I) neurons show the same tendency. (C) Quantification of distribution of Pax6+‐transfected progenitors upon Ece2 KD relative to CTRL shows tangential shift to bin2 (n = 3 CTRL and 4 Ece2 KD brains; P = 0.082 in one‐way ANOVA; data shown as mean ± SEM). (H) Quantification of ectopic deep layer neurons at 1 dpe shows trend to ectopic, less basal position upon Ece2 KD (n = 3 CTRL and 4 Ece2 KD brains; P = 0.156 in one‐way ANOVA; data shown as mean ± SEM). (F) aRG morphology is changed, and the apical surface shows patches lacking apically localised Arl13b at 1 dpe.
- J, J’
Example images at 3 dpe showing delaminated ectopic progenitors form rosettes and nodules.
- A
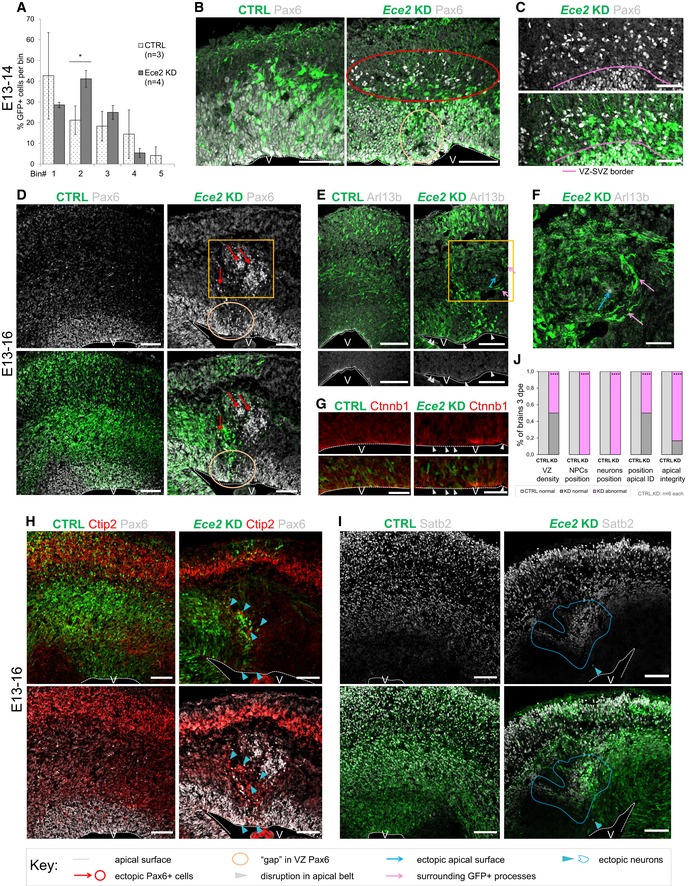
Quantification of distribution of GFP+‐transfected cells at 1 dpe upon CTRL and Ece2 KD by IUE (n = 3 CTRL and 4 Ece2 KD brains; *P = 0.044 in one‐way ANOVA and Tukey's multiple pairwise comparison; data shown as mean ± SEM).
- B, C
Ece2 KD leads to ectopic non‐transfected Pax6+ progenitors at 1 dpe (E13–E14). (B) IHC staining of GFP (transfected cells) and Pax6 at 1 dpe showing ectopic Pax6+ progenitors (red circle) and a reduction in their apical localisation (yellow circle). (C) High magnification images of GFP and Pax6 showing that ectopic progenitors are mostly not transfected.
- D–J
E13–16 Ece2 KD. (D) GFP‐Pax6+ progenitors delaminate upon Ece2 KD (red arrows), leaving behind a region free of Pax6+ cells in the VZ (yellow circle) and forming ectopic rosettes (yellow box). (E, G) Reduction in apical Arl13b and β‐catenin in the electroporation site (white arrowheads) indicates loss of apical belt integrity and disruption of apico‐basal polarity upon Ece2 KD. (F) Inside the nodule, which is surrounded by thickened GFP+ processes (pink arrows), Arl13b staining shows the formation of an ectopic apical surface (blue arrow; enlargement of boxed area from D and E). (H) Deep layer and (I) upper layer neurons localise next to ectopic rosettes, forming nodules of ectopic neurons (blue arrowheads for single ectopic neurons and blue circle for large nodule). (J) Quantification at 3 dpe, counting the proportion of brains with reduced density of Pax6 in the VZ, ectopic progenitors or neurons, and changes in apico‐basal polarity (including ectopic apical surface formation and reduction in apically localised apical markers; n = 6 brains per condition; exact binomial test: ****P < 0.0001).
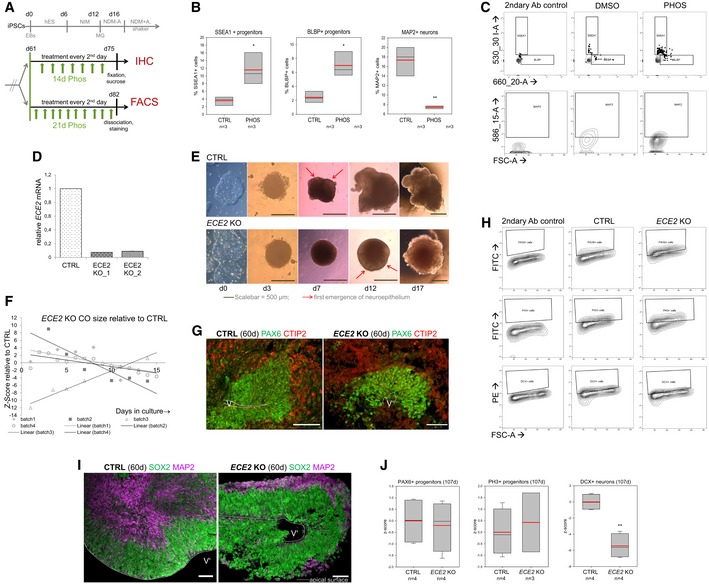
Scheme depicting the timeline of chronic PHOS treatment in COs prior to IHC or FACS analysis (hES, NIM, NDM−/+A: media for CO generation, see Materials and Methods).
FACS analysis of PHOS‐treated COs shows an increase in neural progenitors and a decrease in neurons. Data shown as z‐scores (n = samples of three pooled COs each; box plots: mean = red line, median = black line, box represents 25th and 75th percentiles, whiskers extend to 10th and 90th percentiles, all outliers are shown; *P < 0.05; **P < 0.01 in one‐way ANOVA and Tukey's pairwise multiple comparison).
FACS plots illustrating gating strategies for SSEA‐, BLBP‐ and MAP2‐gated cells in CTRL‐ and PHOS‐treated COs. Gates were established using secondary antibody only as isotype control.
qPCR confirms the absence of ECE2 mRNA in two clones of ECE2 KO iPSCs (data shown as mean ± SEM from triplicates).
Brightfield (BF) images of ECE2 KO and isogenic control iPSCs and of COs generated from them.
Size measurement ECE2 KO vs. CTRL COs revealed no consistent difference (data shown as z‐scores; n = 4 batches of COs with at least 10 COs each per time point, area measured from 2D BF images in Fiji 82).
Example images of IHC for PAX6+ dorsal neural progenitors (green) and CTIP2+ deep layer neurons (red) in CTRL and ECE2 KO COs.
FACS plots illustrating the gating strategies for PAX6‐, PH3‐ and MAP2‐gated cells in 60‐day‐old CTRL and ECE2 KO COs. Gates were established from the secondary‐only control.
Example images of progenitor zone (SOX2, green) and neuronal layer (MAP2, magenta) staining by IHC in CTRL and ECE2 KO COs.
FACS analysis of 107‐day‐old COs gated for PAX6+ or PH3+ progenitors or DCX+ neurons shows no difference in progenitors, but a reduction in neurons upon ECE2 KO also at this later stage.
- A
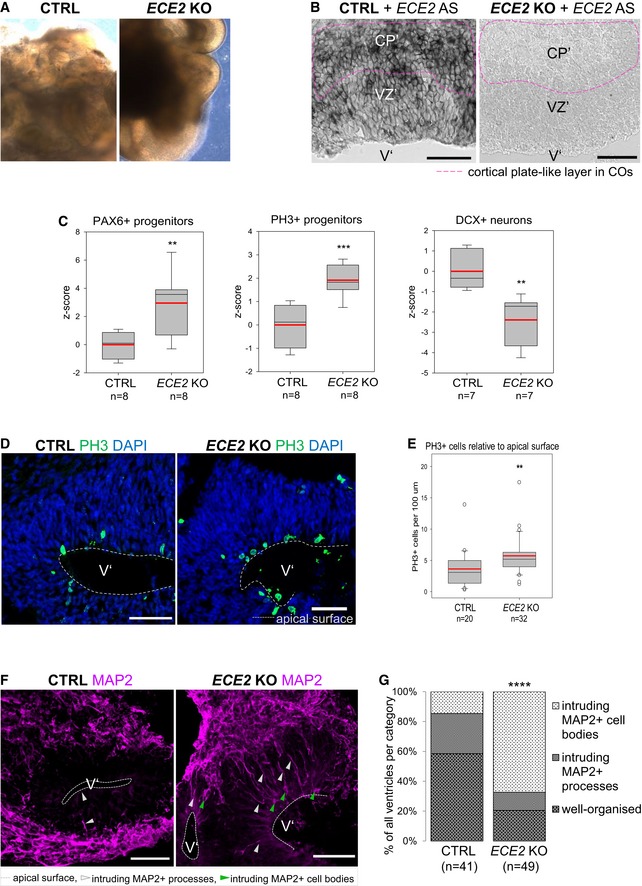
Brightfield images of 60‐day‐old CTRL and ECE2 KO COs show normal formation of neuroepithelial structures.
- B
ISH for ECE2 confirms the absence of ECE2 mRNA in 60‐day‐old ECE2 KO COs (pink dotted line indicates position of the CP’).
- C
FACS analysis of 60‐day‐old ECE2 KO COs reveals an increase in progenitors and decrease in neurons (n = 7–8 samples of three pooled organoids each from three different batches; **P < 0.01; ***P < 0.001 in one‐way ANOVA and Tukey's pairwise multiple comparison).
- D
Example images of IHC for PH3+ cells in 60‐day‐old CTRL and ECE2 KO COs.
- E
Quantification of PH3+ cycling cells in 60‐day‐old COs, normalised to length of the apical surface of ventricle‐like structures, shows an increase upon ECE2 KO (data shown as box plots with median as black line, mean as red line; n = number of analysed ventricles from two batches of COs; one‐way ANOVA: **P = 0.004).
- F, G
In ECE2 KO COs, more ventricles are disorganised in terms of neuronal localisation as revealed from MAP2+ cell bodies in the progenitor zone (n = number of ventricles from two independent batches; two‐tailed Mann–Whitney U‐test (U = 458) and chi‐square test: = 25.42, ****P < 0.0001).
- A
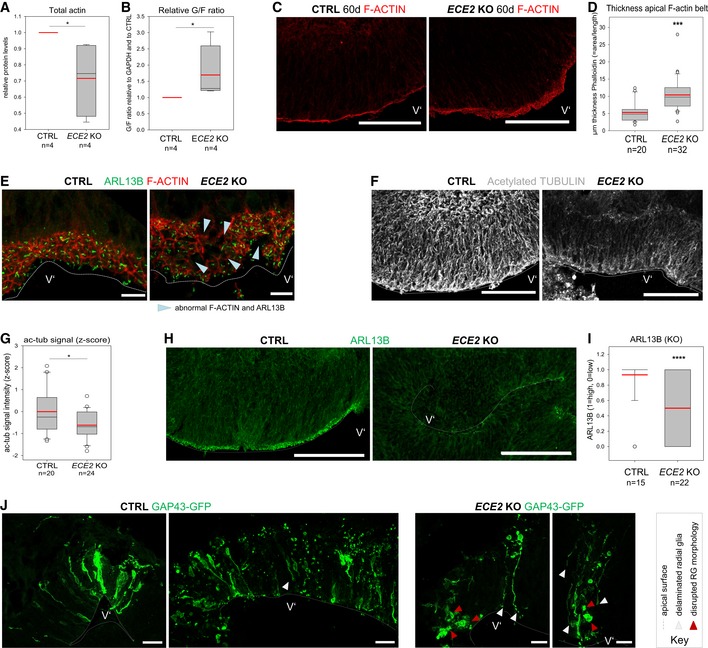
Quantification of actin levels from Western blot of whole CO lysate reveals a reduction in ECE2 KO COs (n = 4 independent batches of CTRL and ECE2 KO COs with three pooled COs each sample; *P = 0.021 in the Kruskal–Wallis one‐way analysis of variance on ranks and Dunn's pairwise multiple comparison).
- B
Fractionation of G‐actin and F‐actin from CTRL and ECE2 KO COs and analysis via Western blot additionally reveal an increase in G‐ at the expense F‐actin upon ECE2 KO, suggesting a reduction in F‐actin belt integrity (n = 4 independent batches of CTRL and ECE2 KO COs with three pooled COs each; *P = 0.021 in Kruskal–Wallis one‐way analysis of variance on ranks and Dunn's pairwise multiple comparison).
- C, D
The thickness of the apical F‐actin belt is increased in ECE2 KO COs. (C) Example images of apical F‐actin belt in 60‐day‐old CTRL and ECE2 KO COs with F‐actin labelled by Alexa Fluor 594‐conjugated Phalloidin (scale bar = 100 μm). (D) Quantification of the thickness of apical F‐actin belt in Fiji 82 by measuring the area of F‐actin and dividing by the length of apical surface reveals significant increase in ECE2 KO COs (box plots: mean = red line, median = black line, box represents 25th and 75th percentiles, whiskers extend to 10th and 90th percentiles, all outliers are shown; n = number of analysed ventricles in two batches; Kruskal–Wallis one‐way ANOVA on ranks and Dunn's pariwise multiple comparison: ***P < 0.001).
- E
IHC for ARL13B and F‐actin in 60‐day‐old CTRL and ECE2 KO COs shows disruption of honeycomb‐like structure of the apical adherens belt and of apico‐basal polarity in terms of apically localised primary cilium in ECE2 KO COs (scale bar = 10 μm).
- F, G
The microtubule cytoskeleton is changed in COs upon ECE2 KO. (F) Example images of ac‐tub IHC in CTRL vs. ECE2 KO COs (scale bar = 100 μm). (G) Quantification of ac‐tub in ventricles of ECE2 KO COs by measurement of the mean grey value in Fiji shows significant reduction upon ECE2 KO (n = number of analysed ventricles; *P = 0.019 in one‐way ANOVA and Tukey's pairwise multiple comparison).
- H, I
Apico‐basal polarity is impaired upon ECE2 KO as visible in example images of ARL13B IHC in CTRL vs. KO COs (H; scale bar = 100 μm). (I) Quantification of germinal zones for normally high (“1”) vs. reduced (“0”) apical ARL13B reveals a reduction in the proportion of normal ventricles in the absence of ECE2 (n = number of analysed ventricles from two batches; ****P < 0.0001 in exact binomial test).
- J
Analysis of CTRL and ECE2 KO COs at 1 dpe with GAP43‐GFP reveals RG that delaminated (white arrowheads) and/or lost their bipolar morphology (red arrowheads) in the KO COs (scale bar = 25 μm).
- A
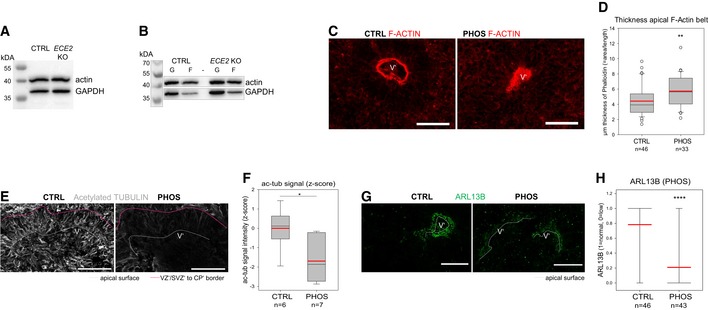
Example Western blot for total actin levels in COs with GAPDH as control.
- B
Example Western blot for actin levels after fractionation of G‐ and F‐actin, using GAPDH as loading control.
- C, D
The thickness of the apical F‐actin belt is increased in PHOS‐treated COs. (C) Example images of PHOS‐ and CTRL‐treated COs with F‐actin labelled by Alexa Fluor 594‐conjugated Phalloidin. (D) The thickness of the F‐actin belt was assessed in Fiji 82 by measuring the area of F‐actin and dividing by the length of apical surface (box plot: mean = red line, median = black line, box represents 25th and 75th percentiles, whiskers extend to 10th and 90th percentiles, all outliers are shown; n = number of analysed ventricles in 2 batches; Kruskal–Wallis one‐way ANOVA on ranks and Dunn's pariwise multiple comparison: **P = 0.003; ***P < 0.001).
- E, F
The microtubule cytoskeleton is changed upon ECE2 inhibition. (E) Example images of ac‐tub IHC in CTRL‐ vs. PHOS‐treated COs. (F) Quantification of ac‐tub signal as mean grey value in neuroepithelial regions of PHOS‐treated COs shows significant reduction upon ECE2 inhibition (n = number of analysed ventricles; *P = 0.021 in one‐way ANOVA and Tukey's pairwise multiple comparison).
- G, H
Apico‐basal polarity is impaired upon ECE2 inhibition as visible in example images of ARL13B IHC in CTRL vs. PHOS (G) as assessed by quantification of germinal zones (H) for normally high (“1”) vs. reduced (“0”) apical ARL13B, revealing a reduction in normal ventricles in the absence of ECE2 (n = number of analysed ventricles from two batches; ****P < 0.0001 in exact binomial test).
- A, B
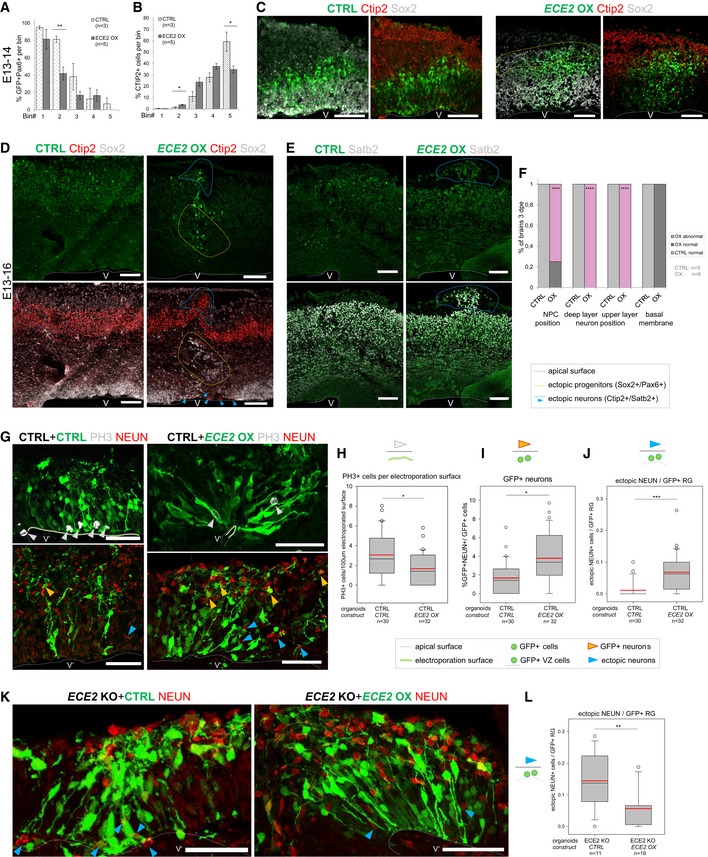
Binning analysis at 1 dpe after forced expression of ECE2 in the developing mouse cortex reveals ectopic positioning of Pax6+GFP+ neural progenitors with significantly reduced localisation to bin2 (A) and increased localisation of Ctip2+ deep layer neurons to bin2 with reduction in bin5 (B) (for binning strategy, see Fig EV2B; n = 3 CTRL and 5 ECE2 OX brains E13–14; data shown as bars with mean ± SEM; *P < 0.05 and **P < 0.01 in Student's t‐test).
- C
Example images E13–14 of IHC for Pax6 and Ctip2 upon CTRL and ECE2 OX conditions (scale bar = 100 μm; electroporated cells shown in green).
- D–F
E13–16 images and analysis of ECE2 OX in the developing mouse cortex reveal ectopic positioning of Sox2+ (D) progenitors and Ctip2+ deep‐ (D) and Satb2+ upper layer neurons (E) (scale bars = 100 μm; electroporated cells shown in green). (F) Quantification at 3 dpe, counting the proportion of brains with normal vs. abnormal positioning of Sox2+ neural progenitors and Ctip2+ and Satb2+ neurons and that of brains with intact vs. disrupted basal membrane (n = 5 CTRL and 8 ECE2 OX brains; exact binomial test: ****P < 0.0001).
- G–L
ECE2 OX in COs (electroporated cells shown in green; scale bars = 50 μm; n = number of CO ventricles analysed from two batches). (G) Example images of COs 7 days after CTRL or ECE2 OX electroporation and IHC for PH3+ mitotic cells and NEUN+ neuronal nuclei. (H) Quantification of PH3+ cells relative to electroporated apical surface length reveals a reduction upon ECE2 OX in CTRL CO background (*P = 0.046 in Kruskal–Wallis one‐way analysis of variance on ranks and Dunn's pairwise multiple comparison). (I) Quantification of GFP+ neurons as proportion of all GFP+ cells reveals an increase upon ECE2 OX in COs (*P = 0.021 in Kruskal–Wallis one‐way analysis of variance on ranks and Dunn's pairwise multiple comparison). (J) Quantification of ectopic neurons localising to the VZ’ relative to electroporated radial units (GFP+ cells in the VZ’) reveals a significant increase upon ECE2 OX (***P < 0.001 in Kruskal–Wallis one‐way analysis of variance on ranks and Dunn's pairwise multiple comparison). (K, L) Forced expression of ECE2 in ECE2 KO COs rescues neuronal positioning. (K) Example images of CTRL‐ and ECE2‐electroporated ECE2 KO COs at 7 dpe. (L) Quantification of ectopic neurons relative to electroporated radial units reveals a decrease upon ECE2 OX in ECE2 KO COs, thus rescuing the neuronal positioning phenotype in the absence of ECE2 OX (**P = 0.002 in Kruskal–Wallis one‐way analysis of variance on ranks and Dunn's pairwise comparison).
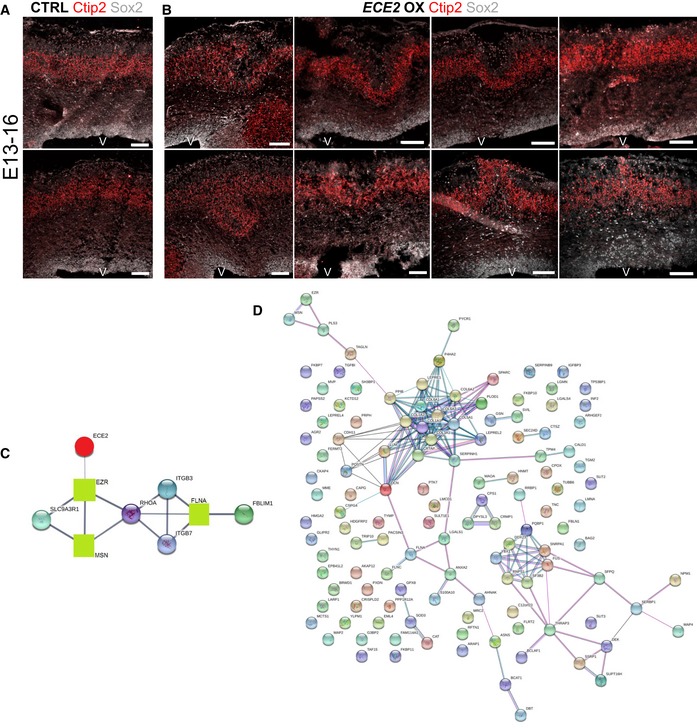
- A, B
(A) Example images of CTRL‐electroporated mouse brains E13–16 and (B) example images of mouse brains at 3 dpe after forced expression of ECE2 with IHC for Sox2+ neural progenitors and Ctip2+ deep layer neurons reveal ECE2’s role in neuronal positioning.
- C
Protein interaction analysis 52 shows network with ECE2 (red circle) and three interacting proteins that were identified as downregulated upon KO (green squares), including the known PH gene FLNA.
- D
Network analysis 52 reveals that downregulated proteins in ECE2 KO COs are part of a tightly interconnected PPI network with ECM proteins as the biggest subnetwork.
- A
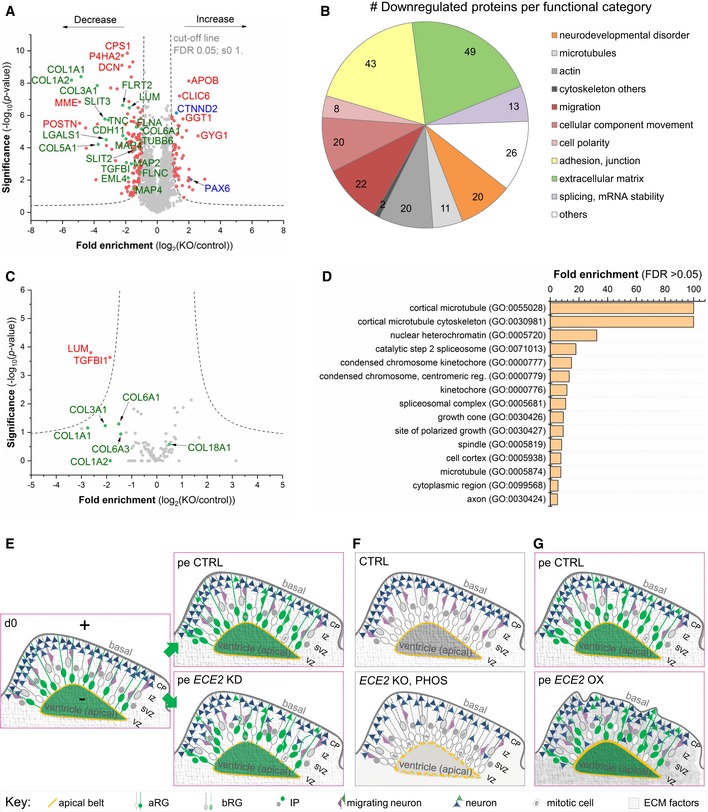
Volcano plot visualises the proteomic analysis from 60‐day‐old CO lysates showing proteins with significantly lower and higher expression upon ECE2 KO (n = 3 batches of 60‐day‐old CTRL and ECE2 KO COs; FDR 0.05; s0 1; dashed lines indicating the cut‐off; names of example proteins are shown).
- B
Pie chart with proteins downregulated in ECE2 KO COs sorted by relevant categories (Number in the elements = number of proteins falling into each category, with numerous proteins falling into several ones) 50, 51, 52.
- C
Volcano plot of proteomic analysis of cell culture supernatant from 55‐day‐old CTRL and ECE2 KO COs shows two significantly downregulated proteins (red) in the secretome (n = 3 batches of CTRL and ECE2 KO COs; FDR 0.05; s0 1; dashed lines indicating the cut‐off). Non‐significantly changed proteins of interest are highlighted in green below the cut‐off curves.
- D
GO cellular component analysis of proteins with dysregulated phosphorylation sites (either found exclusively in CTRL or KO COs or up‐ or downregulated in ECE2 KO COs relative to CTRL) identified in whole CO proteome analysis.
- E–G
Schemes summarising identified phenotypes in in vivo and in vitro model systems upon acute ECE2 KD (E) or chronic inhibition or KO (F) or upon acute ECE2 OX (G) and thus the molecular action of ECE2 (aRG, apical radial glia; bRG, basal radial glia; CP, cortical plate; ECM, extracellular matrix; IP, intermediate progenitor; IZ, intermediate zone; pe, postelectroporation; SVZ, subventricular zone; VZ, ventricular zone.).
References
-
- Götz M, Huttner WB (2005) The cell biology of neurogenesis. Nat Rev Mol Cell Biol 6: 777–788 - PubMed
-
- Kriegstein AR, Noctor SC (2004) Patterns of neuronal migration in the embryonic cortex. Trends Neurosci 27: 392–399 - PubMed
-
- Taverna E, Götz M, Huttner WB (2014) The cell biology of neurogenesis: toward an understanding of the development and evolution of the neocortex. Annu Rev Cell Dev Biol 30: 465–502 - PubMed
-
- Nadarajah B, Brunstrom J, Grutzendler J, Wong R, Pearlman A (2001) Two modes of radial migration in early development of the cerebral cortex. Nat Neurosci 4: 143–150 - PubMed
Publication types
MeSH terms
Grants and funding
LinkOut - more resources
Full Text Sources
Other Literature Sources
Molecular Biology Databases
