. 2020 May 4;219(5):e201905018.
doi: 10.1083/jcb.201905018.

CENP-F stabilizes kinetochore-microtubule attachments and limits dynein stripping of corona cargoes

Affiliations

CENP-F stabilizes kinetochore-microtubule attachments and limits dynein stripping of corona cargoes

Philip Auckland et al. J Cell Biol. .

Abstract

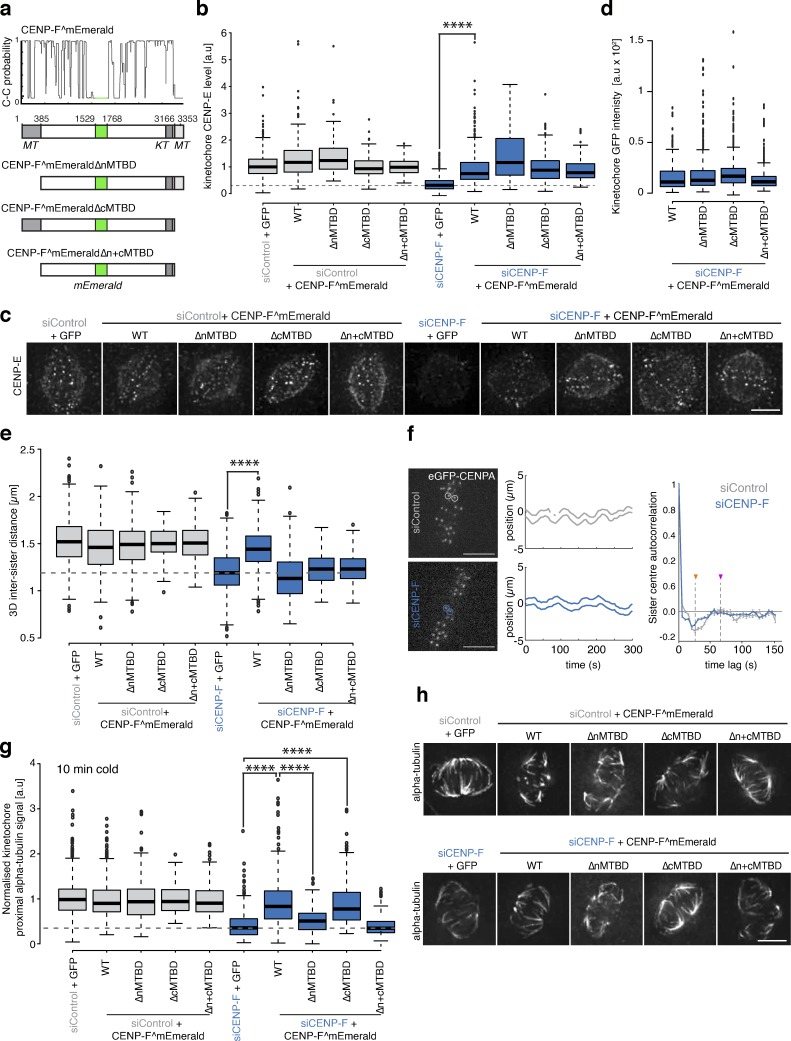
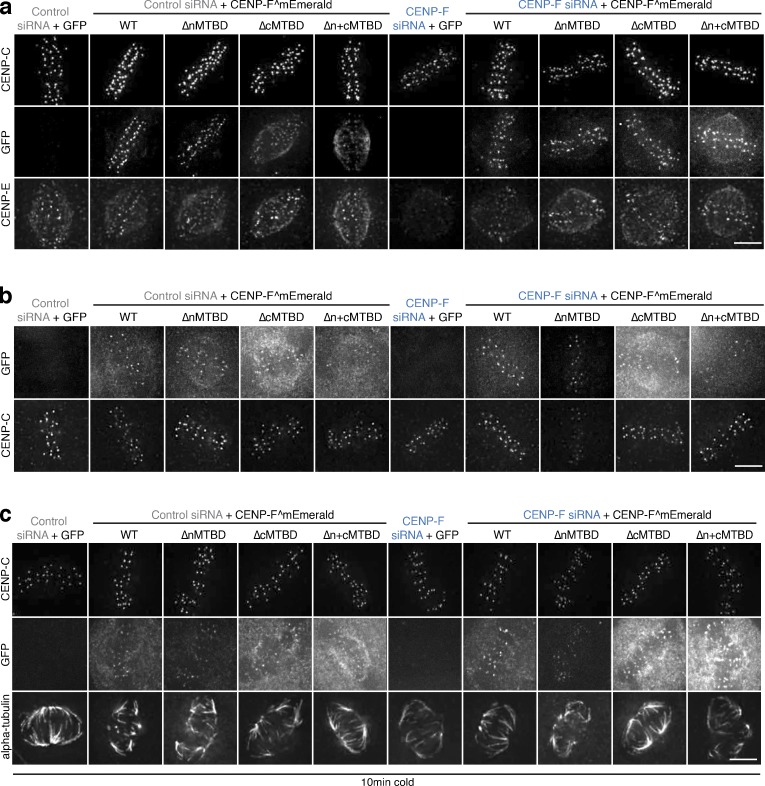
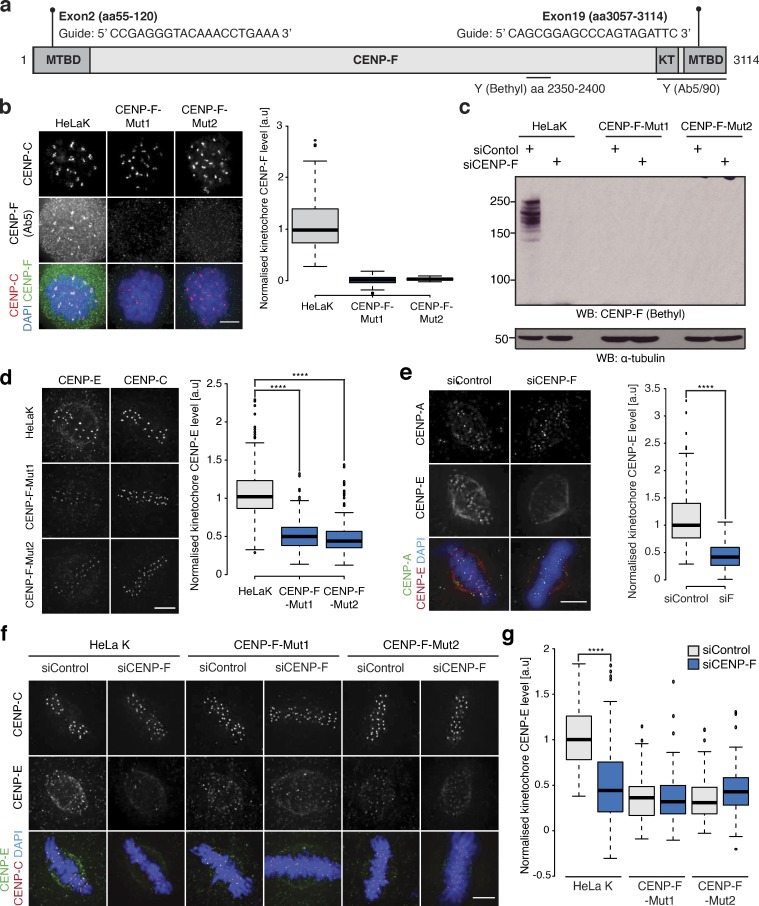
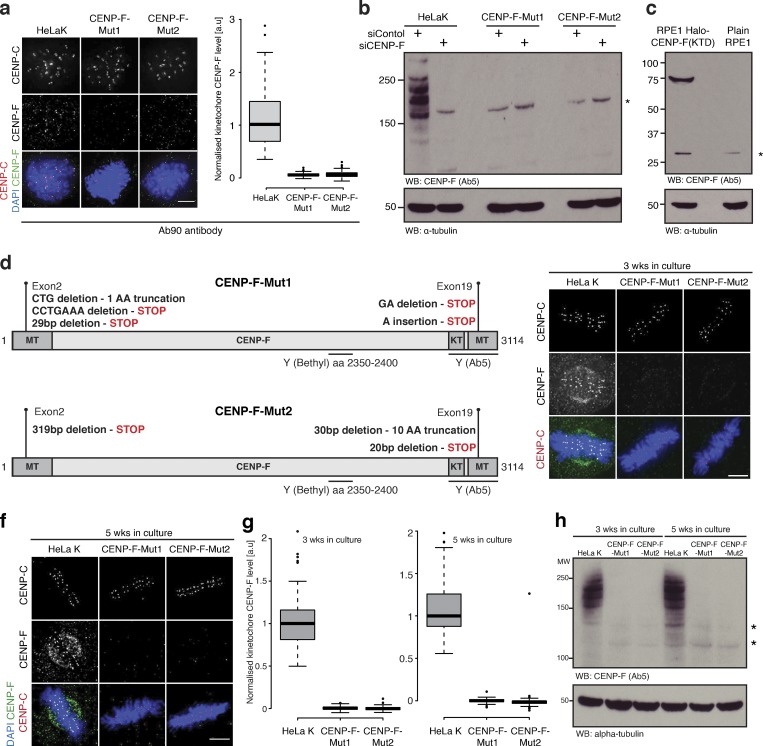
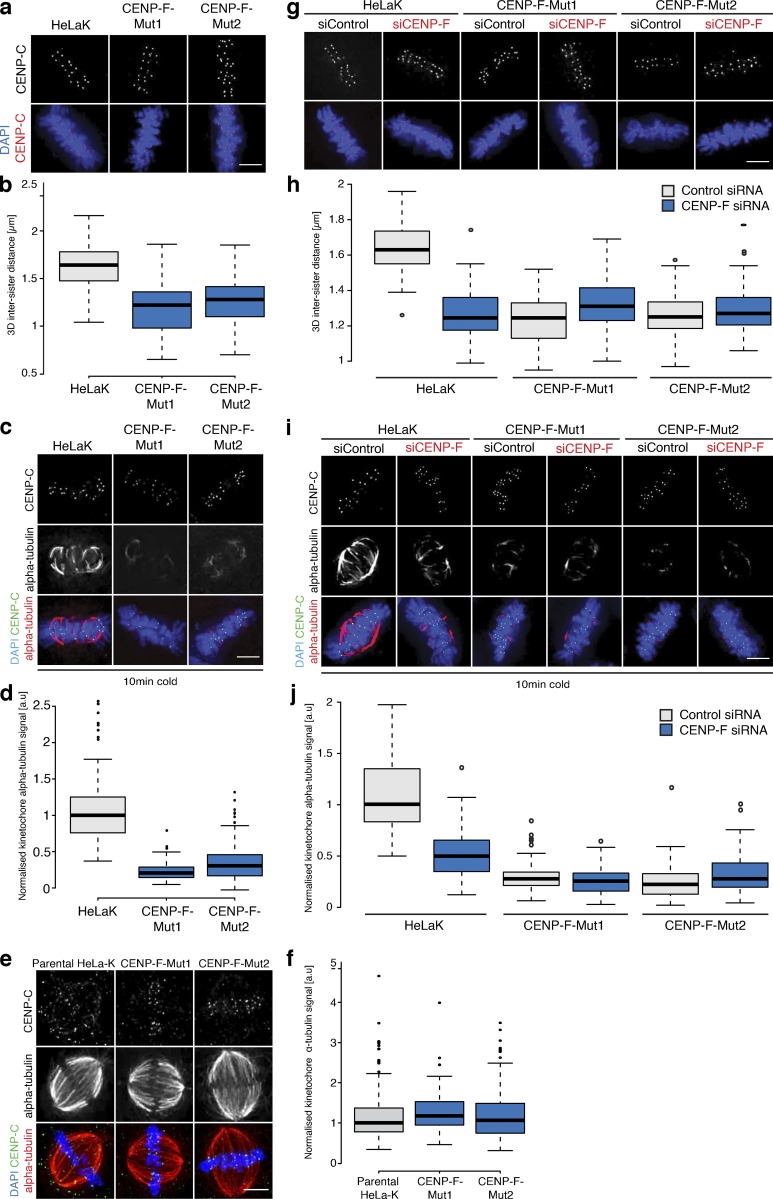
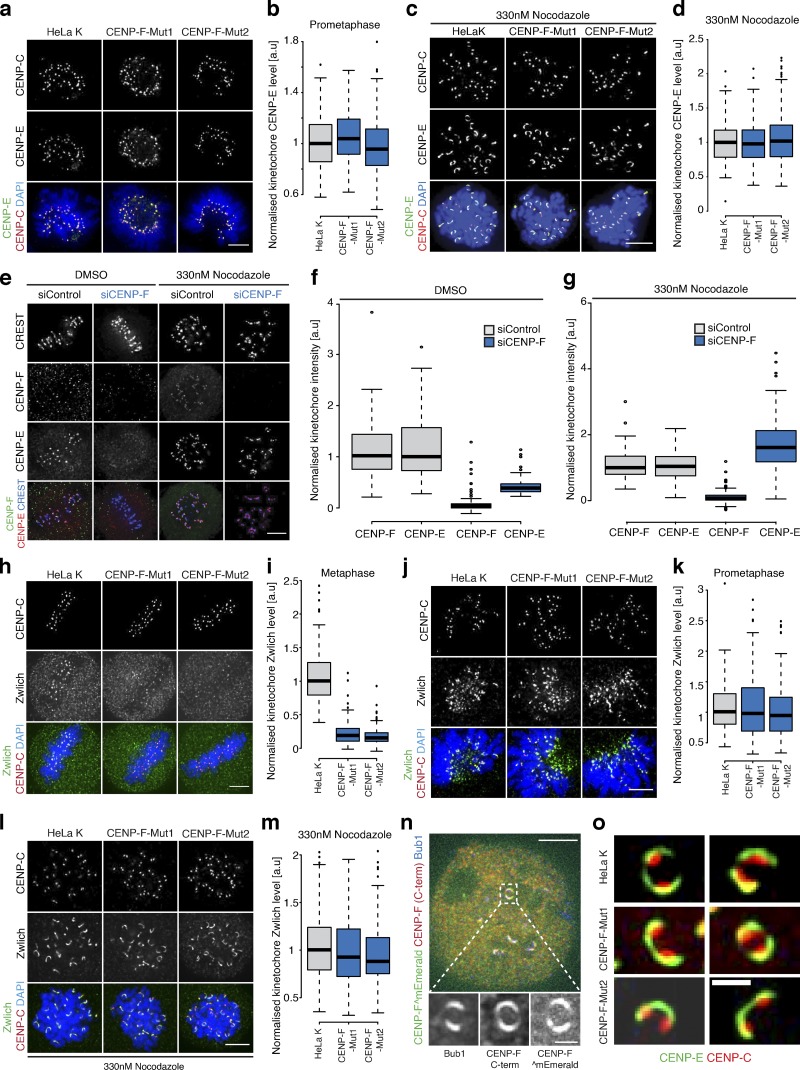
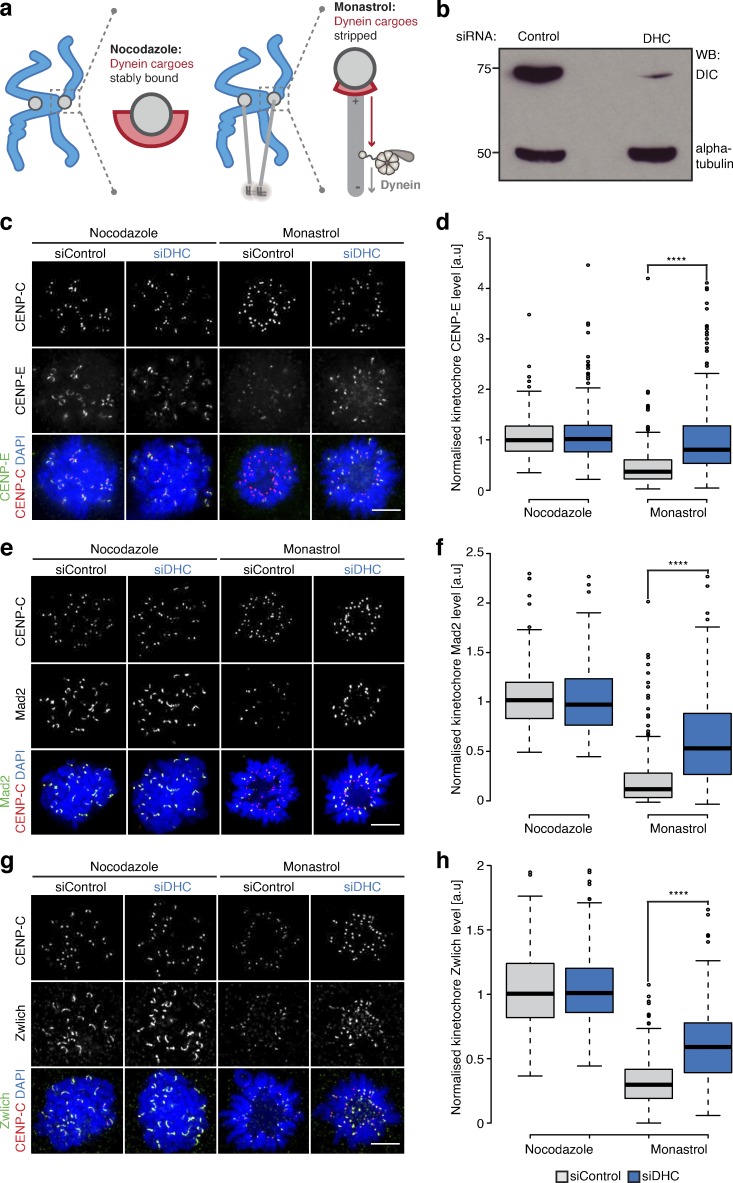
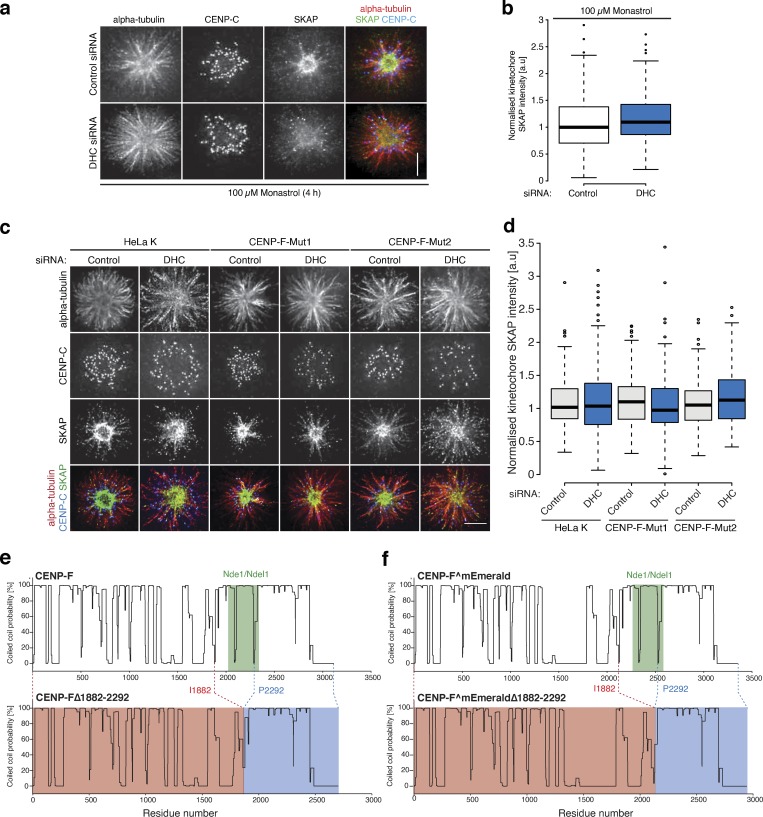
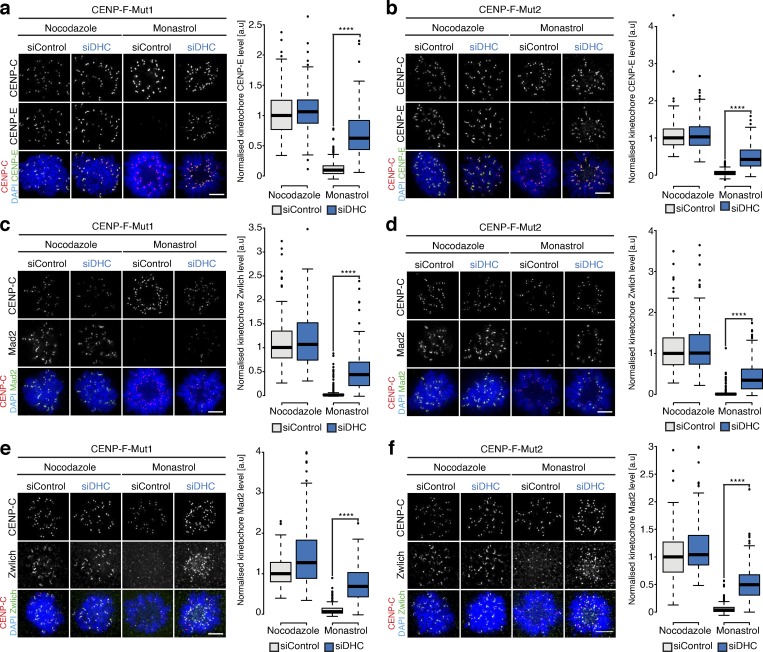
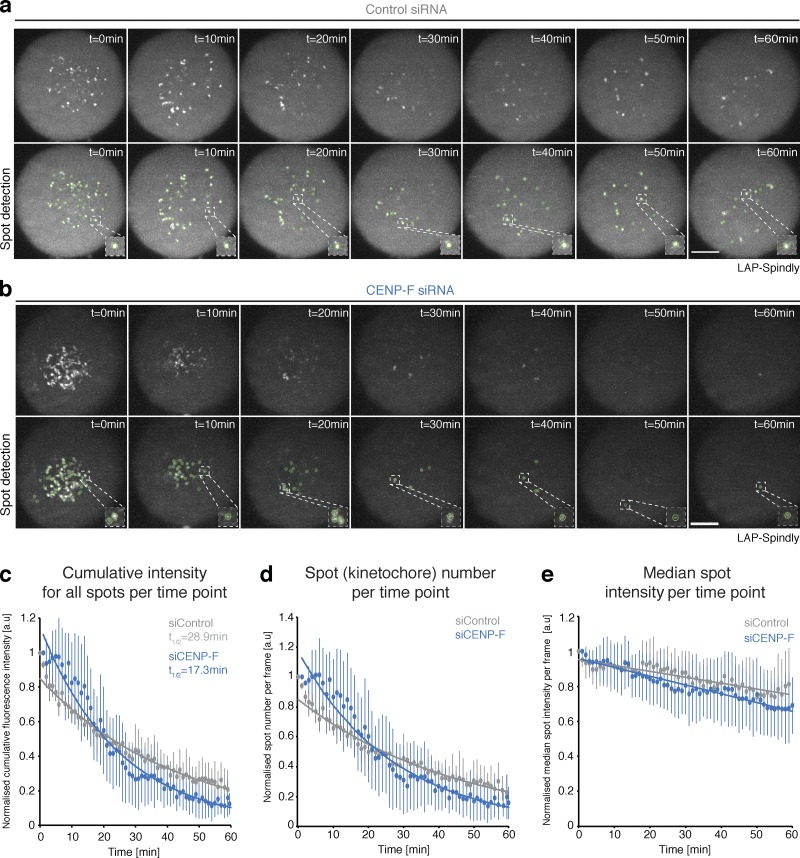
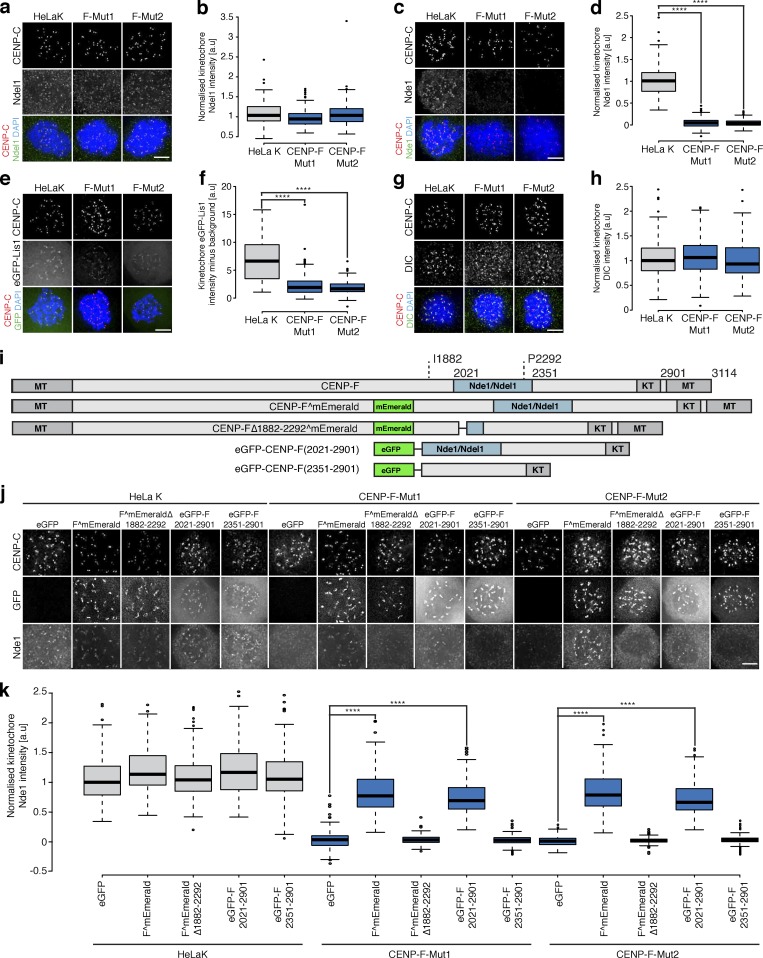
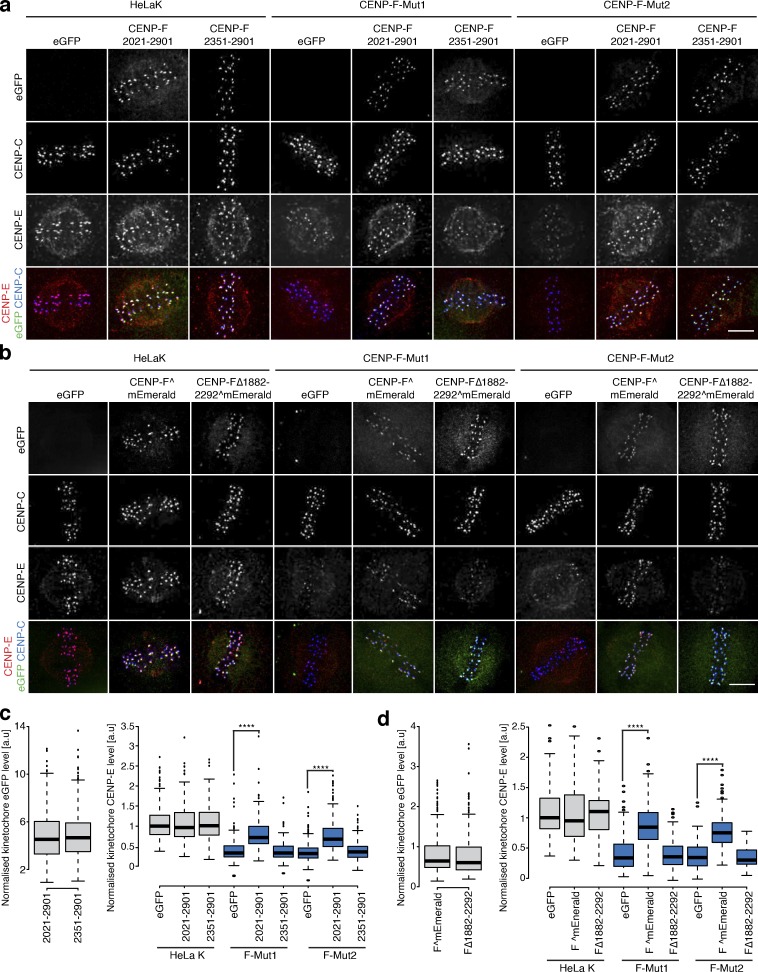
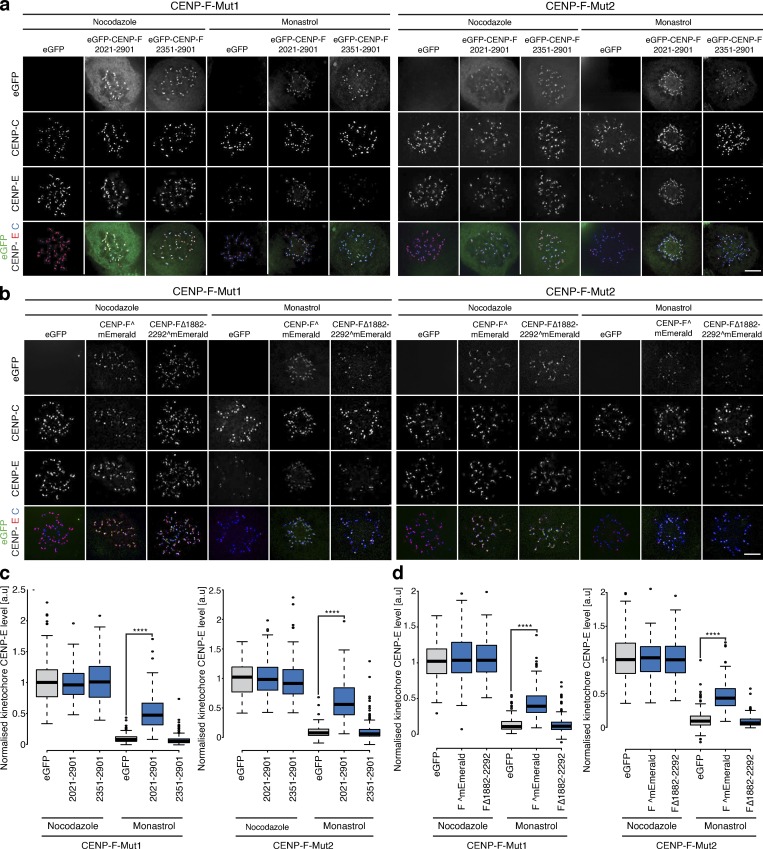
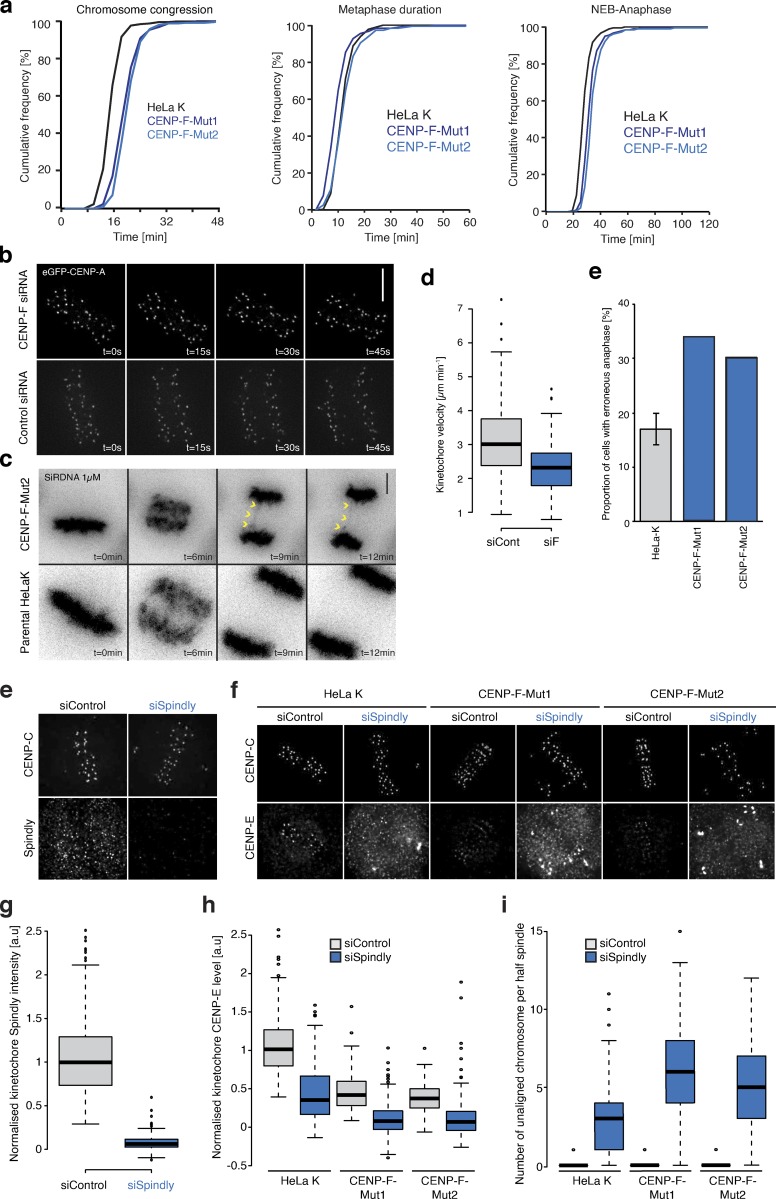
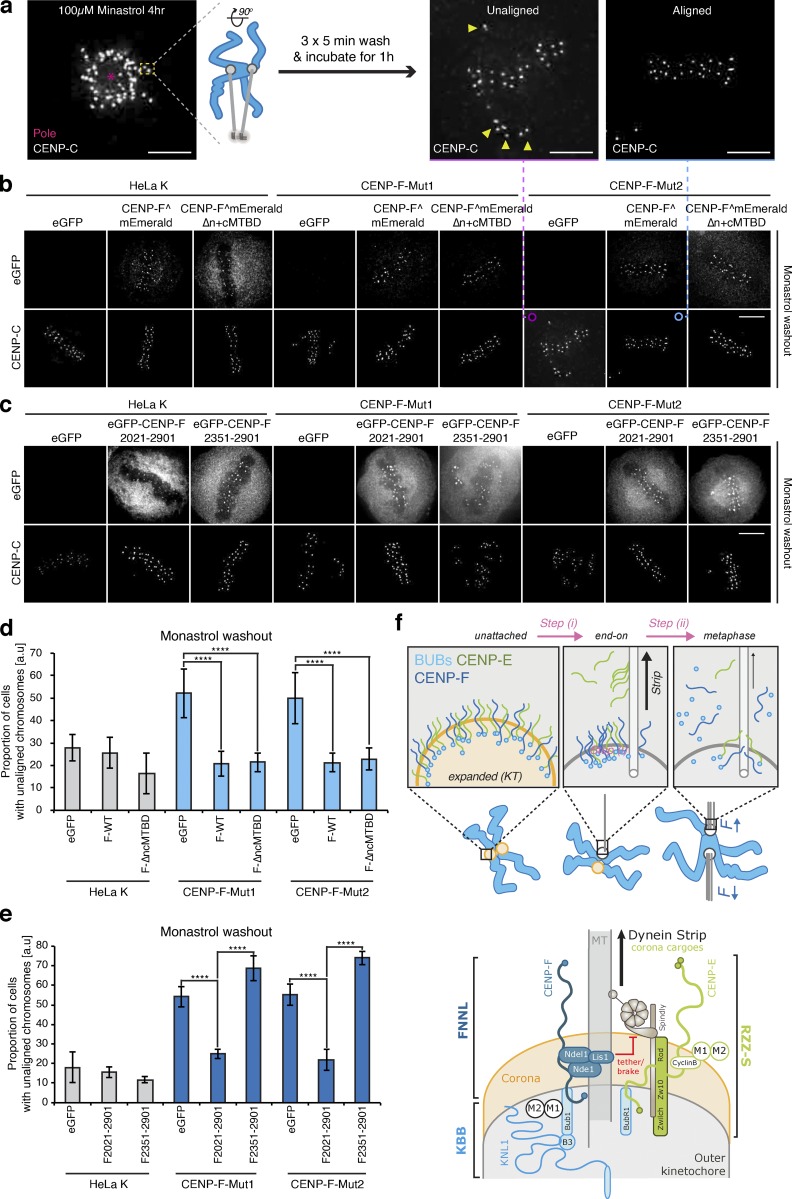
Accurate chromosome segregation demands efficient capture of microtubules by kinetochores and their conversion to stable bioriented attachments that can congress and then segregate chromosomes. An early event is the shedding of the outermost fibrous corona layer of the kinetochore following microtubule attachment. Centromere protein F (CENP-F) is part of the corona, contains two microtubule-binding domains, and physically associates with dynein motor regulators. Here, we have combined CRISPR gene editing and engineered separation-of-function mutants to define how CENP-F contributes to kinetochore function. We show that the two microtubule-binding domains make distinct contributions to attachment stability and force transduction but are dispensable for chromosome congression. We further identify a specialized domain that functions to limit the dynein-mediated stripping of corona cargoes through a direct interaction with Nde1. This antagonistic activity is crucial for maintaining the required corona composition and ensuring efficient kinetochore biorientation.


Figures

Figure 1.
Figure 1.
CENP-F MTBDs are required for K-K tension and stable microtubule attachment. (a) Top: Coiled-coil prediction of the CENP-F^mEmerald protein. Bottom: Schematic showing the position of the microtubule- and kinetochore-binding domains in CENP-F^mEmerald and mutant versions. (b) Quantification of kinetochore CENP-E intensity relative to CENP-C in the rescue experiment shown in c and Fig. S1 a. (c) Immunofluorescence microscopy images of HeLa-K cells treated with either control or CENP-F siRNA, transfected with CENP-F^mEmerald or a microtubule-binding mutant and stained with DAPI and antibodies against CENP-C and CENP-E. Scale bar, 5 µm. Only the CENP-E channel is shown. (d) Quantification of kinetochore eGFP intensity in HeLa-K cells transfected with either CENP-F^mEmerald or a microtubule-binding mutant. (e) Quantification of the CENP-C–based intersister distance in the CENP-F rescue experiment depicted in Fig. S1 b. Dotted gray line indicates the intersister distance in cells treated with CENP-F siRNA and transfected with an empty vector. (f) Quantification of kinetochore oscillatory movements in control and CENP-F siRNA–treated cells using KiT software (Olziersky et al., 2018). Left: Example images of eGFP-CENP-A–expressing HeLa cells and corresponding charts showing tracks from example sister pairs (circled). Right: Autocorrelation plot based on the oscillations of eGFP-CENP-A kinetochores. The orange and purple arrowheads indicate the half and full periods in control cells, respectively (control siRNA: 23 cells, 783 sisters; CENP-F siRNA, 33 cells, 1,137 sisters). Scale bar, 5 µm. (g) Quantification of the kinetochore proximal α-tubulin intensity relative to CENP-C in the cold-stable CENP-F rescue experiment depicted in panel h and Fig. S1 c. Dotted gray line indicates the α-tubulin intensity in cells treated with CENP-F siRNA and rescued with an empty vector. (h) Immunofluorescence microscopy images of the cold-stable CENP-F rescue experiment. HeLa-K cells were treated with either control or CENP-F siRNA and transfected with CENP-F^mEmerald or a microtubule-binding mutant before incubation on ice and fixation. Cells were stained with DAPI and antibodies against CENP-C and α-tubulin. Only the α-tubulin channel is shown. Scale bar, 5 µm. In b, d, e, and g, boxes depict the median and first and third quartiles, and whiskers represent Q1 and Q3 ± 1.5× interquartile range. ****, P < 0.0001.
Figure S1.
Figure S1.
CENP-F microtuuble binding mutant rescues. (a) Immunofluorescence microscopy images of the CENP-E rescue experiment with CENP-F MTBD mutants. HeLa-K cells were treated with control or CENP-F siRNA and rescued with an empty vector, CENP-F^mEmerald, CENP-F^mEmeraldΔnMTBD, CENP-F^mEmeraldΔcMTBD, or CENP-F^mEmeraldΔn+cMTBD before being stained with DAPI and antibodies against CENP-C and CENP-E. Scale bar, 5 µm. (b) Immunofluorescence microscopy images of the K-K distance rescue experiment with CENP-F MTBD mutants. HeLa-K cells were treated with control or CENP-F siRNA and rescued with an empty vector, CENP-F^mEmerald, CENP-F^mEmeraldΔnMTBD, CENP-F^ΔcMTBD, or CENP-F^GFPΔn+cMTBD before being stained with DAPI and an antibody against CENP-C. Scale bar, 5 µm. (c) Immunofluorescence microscopy images of the cold-stable rescue experiment with CENP-F MTBD mutants. HeLa-K cells were treated with control or CENP-F siRNA and rescued with an empty vector, CENP-F^mEmerald, CENP-F^GFPΔnMTBD, CENP-F^GFPΔcMTBD, or CENP-F^GFPΔn+cMTBD before being incubated on ice for 10 min and stained with DAPI and antibodies against CENPC and α-tubulin. Scale bar, 5 µm.
Figure 2.
Figure 2.
CENP-F CRISPR mutants phenocopy CENP-F RNAi. (a) Schematic showing the CRISPR guide targets and antibody epitopes in CENP-F. (b) Left: Immunofluorescence microscopy images of HeLa-K, CENP-F-Mut1, and CENP-F-Mut2 cells arrested in 330 nM nocodazole for 16 h and stained with antibodies against CENP-C and CENP-F (Ab5). Scale bar, 5 µm. Right: Quantification of kinetochore CENP-F(Ab5) intensity relative to CENP-C in HeLa-K, CENP-F-Mut1, and CENP-F-Mut2 cells arrested in 330 nM nocodazole for 16 h. (c) Immunoblot of liquid-N2 extracts collected from HeLa-K, CENP-F-Mut1, and CENP-F-Mut2 cells treated with either control or CENP-F siRNA and arrested in 330 nM nocodazole for 16 h. The membrane was probed with antibodies against CENP-F(Bethyl) and α-tubulin. (d) Left: Immunofluorescence microscopy images of HeLa-K, CENP-F-Mut1, and CENP-F-Mut2 cells stained with DAPI and antibodies against CENP-E and CENP-C. Scale bar, 5 µm. Right: Quantification of kinetochore CENP-E intensity relative to CENP-C in HeLa-K, CENP-F-Mut1, and CENP-F-Mut2 cells. (e) Left: Immunofluorescence microscopy images of HeLa-K cells treated with either control or CENP-F siRNA and stained with DAPI and antibodies against CENP-E and CENP-A. Scale bar, 5 µm. Right: Quantification of kinetochore CENP-E intensity relative to CENP-A in cells treated with either control or CENP-F siRNA. (f) Immunofluorescence microscopy images of HeLa-K, CENP-F-Mut1, and CENP-F-Mut2 cells treated with either control or CENP-F siRNA and stained with DAPI and antibodies against CENP-E and CENP-C. Scale bar, 5 µm. (g) Quantification of kinetochore CENP-E level relative to CENP-C in HeLa-K, CENP-F-Mut1, and CENP-F-Mut2 cells treated with control or CENP-F siRNA. In b, d, e, and g, boxes depict the median and first and third quartiles, and whiskers represent Q1 and Q3 ± 1.5× interquartile range. ****, P < 0.0001.
Figure S2.
Figure S2.
Characterisation of CENP-F-Mut1 and CENP-F-Mut2 cells. (a) Left: Immunofluorescence microscopy images of HeLa-K, CENP-F-Mut1, and CENP-FMut2 cells treated with 330 nM nocodazole for 16 h and stained with DAPI and antibodies against CENP-C and CENP-F(Ab90). Scale bar, 5 µm. Right: Quantification of kinetochore CENP-F intensity relative to CENP-C in HeLa-K, CENP-F-Mut1, and CENP-F-Mut2 cells arrested in 330 nM nocodazole for 16 h. (b) Immunoblot of liquid N2 protein extracts from HeLa-K, CENP-F-Mut1, and CENP-F-Mut2 cells treated with either control or CENP-F siRNA and arrested in nocodazole for 16 h. The membrane was probed with antibodies against CENP-F(Ab5) and α-tubulin. Asterisk indicates a nonspecific band. (c) Immunoblot of liquid N2 protein extracts from Rpe1 and Rpe1-Halo-CENP-F(KTD) cells arrested in nocodazole for 16 h. The membrane was probed with antibodies against CENP-F(Ab5) and α-tubulin. Asterisk indicates a nonspecific band. (d) Summary of CENP-F-Mut1 and CENP-F-Mut2 exon2 and exon19 sequencing. (e) Immunofluorescence microscopy images of HeLa-K, CENP-F-Mut1, and CENP-F-Mut2 cells cultured for 3 wk and stained with DAPI and antibodies against CENP-C and CENP-F (Ab5). Scale bar, 5 µm. (f) Immunofluorescence microscopy images of HeLa-K, CENP-F-Mut1, and CENP-F-Mut2 cells cultured for 5 wk and stained with DAPI and antibodies against CENP-C and CENP-F (Ab5). Scale bar, 5 µm. (g) Quantification of kinetochore CENP-F intensity relative to CENP-C in HeLa-K, CENP-F-Mut1, and CENP-F-Mut2 cells cultured for 3 (left) or 5 (right) wk. (h) Immunoblot of liquid N2 protein extracts from HeLa-K, CENP-F-Mut1, and CENP-F-Mut2 cells grown in culture for 3 or 5 wk and arrested in 330 nM nocodazole for 16 h. Membranes were probed with antibodies against CENP-F (Ab5) and α-tubulin. In a and g, boxes depict the median and first and third quartiles, and whiskers represent Q1 and Q3 ± 1.5× interquartile range. Asterisk indicates nonspecific bands.
Figure S3.
Figure S3.
CENP-F CRISPR mutants phenocopy CENP-F siRNA. (a) Immunofluorescence microscopy images of HeLa-K, CENP-F-Mut1, and CENP-F-Mut2 cells stained with DAPI and an antibody against CENP-C. Scale bar, 5 µm. (b) Quantification of the CENP-C–based intersister distance in HeLa-K, CENP-F-Mut1, and CENP-F-Mut2 cells. (c) Immunofluorescence microscopy images of HeLa-K, CENP-F-Mut1, and CENP-F-Mut2 cells incubated on ice for 10 min before being stained with DAPI and antibodies against CENP-C and α-tubulin. Scale bar, 5 µm. (d) Quantification of kinetochore proximal α-tubulin intensity in HeLa-K, CENP-F-Mut1, and CENP-F-Mut2 cells incubated on ice for 10 min. (e) Immunofluorescence microscopy images of untreated and glutaraldehyde-fixed HeLa-K, CENP-F-Mut1, or CENP-F-Mut2 cells stained with DAPI and antibodies against α-tubulin and CENP-C. Scale bar, 5 µm. (f) Quantification of kinetochore proximal α-tubulin intensity in untreated and glutaraldehyde-fixed HeLa-K, CENP-F-Mut1, or CENP-F-Mut2 cells. (g) Immunofluorescence microscopy images of HeLa-K, CENP-F-Mut1, and CENP-F-Mut2 cells treated with either control or CENP-F siRNA and stained with DAPI and an antibody against CENP-C. Scale bar, 5 µm. (h) Quantification of the CENP-C–based intersister distance in HeLa-K, CENP-FMut1, and CENP-F-Mut2 cells treated with either control or CENP-F siRNA. (i) Immunofluorescence microscopy images of HeLa-K, CENP-F-Mut1, and CENP-F-Mut2 cells treated with control or CENP-F siRNA, incubated on ice for 10 min, and stained with DAPI and antibodies against CENP-C and α-tubulin. Scale bar, 5 µm. (j) Quantification of kinetochore proximal α-tubulin intensity in HeLa-K, CENP-F-Mut1, and CENP-F-Mut2 cells treated with control or CENP-F siRNA and incubated on ice for 10 min. In b, d, f, h, and j, boxes depict the median and first and third quartiles, and whiskers represent Q1 and Q3 ± 1.5× interquartile range.
Figure 3.
Figure 3.
CENP-F controls corona localization in a microtubule-dependent manner. (a) Immunofluorescence microscopy images of early prometaphase HeLa-K, CNP-F-Mut1, and CENP-F-Mut2 cells stained with DAPI and antibodies against CENP-C and CENP-E. Scale bar, 5 µm. (b) Quantification of kinetochore CENP-E intensity relative to CENP-C in early prometaphase HeLa-K, CENP-F-Mut1, and CENP-F-Mut2 cells. (c) Immunofluorescence microscopy images of HeLa-K, CENP-F-Mut1, and CENP-Mut2 treated with 330 nM nocodazole for 16 h and stained with DAPI and antibodies against CENP-C and CENP-E. Scale bar, 5 µm. (d) Quantification of kinetochore CENP-E intensities relative to CENP-C in HeLa-K, CENP-F-Mut1, and CENP-Mut2 treated with 330 nM nocodazole for 16 h. (e) Immunofluorescence microscopy images of HeLa-K cells treated with control or CENP-F siRNA, incubated with DMSO or 330 nM nocodazole for 16 h and stained with DAPI, CREST antisera and antibodies against CENP-E and CENP-F. Scale bar, 5 µm. The CREST display intensities are not comparable between DMSO and nocodazole conditions. (f) Quantification of kinetochore CENP-E and CENP-F levels relative to CREST in HeLa-K cells treated with control or CENP-F siRNA and incubated with DMSO for 16 h. (g) Quantification of kinetochore CENP-E and CENP-F levels relative to CREST in HeLa-K cells treated with control or CENP-F siRNA and incubated with 330 nM nocodazole for 16 h. (h) Immunofluorescence microscopy images of metaphase HeLa-K, CENP-F-Mut1, and CENP-F-Mut2 cells stained with antibodies against CENP-C and Zwlich. Scale bar, 5 µm. (i) Quantification of kinetochore Zwlich level relative to CENP-C at kinetochores in metaphase HeLa-K, CENP-F-Mut1, and CENP-F-Mut2 cells. (j) Immunofluorescence microscopy images of early prometaphase HeLa-K, CENP-F-Mut1, and CENP-F-Mut2 cells stained with antibodies against CENP-C and Zwlich. Scale bar, 5 µm. (k) Quantification of kinetochore Zwlich intensities relative to CENP-C in prometaphase HeLa-K, CENP-F-Mut1, and CENP-F-Mut2 cells. (l) Immunofluorescence microscopy images of HeLa-K, CENP-F-Mut1, and CENP-Mut2 cells treated with 330 nM nocodazole for 16 h and stained with antibodies against CENP-C and Zwlich. Scale bar, 5 µm. (m) Quantification of kinetochore Zwlich intensities relative to CENP-C in HeLa-K, CENP-F-Mut1, and CENP-Mut2 cells treated with 330 nM nocodazole for 16 h. (n) Immunofluorescence microscopy images of HeLa-K cells transfected with CENP-F^mEmerald, arrested in 330 nM nocodazole for 16 h, and stained with antibodies against Bub1 and CENP-F C-terminus (Ab5). Insets show a zoom of an expanded kinetochore. Scale bars, 5 µm (upper); 1 µm (lower). (o) Immunofluorescence microscopy images of CENP-E crescents in HeLa-K, CENP-F-Mut1, and CENP-F-Mut2 cells arrested in 330 nM nocodazole for 16 h. Scale bar, 1µm. In b, d, f, g, i, k, and m, boxes depict the median and first and third quartiles, and whiskers represent Q1 and Q3 ± 1.5× interquartile range.
Figure 4.
Figure 4.
Quantitative assay for dynein-mediated stripping. (a) Schematic outlining the dynein-stripping assay. Briefly, we compare cells arrested in nocodazole, where dynein cargoes are stably bound, and monastrol, where dynein can transport cargoes away from the syntelic (end-on attached) kinetochores toward the monopole. (b) Immunoblot of liquid-N2 extracts collected from HeLa-K cells treated with control or DHC siRNA. The membrane was probed with antibodies against DIC and α-tubulin. (c) Immunofluorescence microscopy images from the dynein-stripping assay for CENP-E. Cells were treated with control or DHC siRNA, arrested in nocodazole or monastrol, and stained with DAPI and antibodies against CENP-E and CENP-C. Scale bar, 5 µM. (d) Quantification of the kinetochore CENP-E intensity relative to CENP-C in the dynein-stripping assay as depicted in c. (e) Immunofluorescence microscopy images of the dynein-stripping assay for Mad2. Cells were treated with control or DHC siRNA, arrested with nocodazole or monastrol, and stained with DAPI and antibodies against Mad2 and CENP-C. Scale bar, 5 µM. (f) Quantification of the kinetochore-bound Mad2 intensity relative to CENP-C in the dynein-stripping assay depicted in e. (g) Immunofluorescence microscopy images of the dynein-stripping assay for Zwlich. Cells were treated with control or DHC siRNA, arrested with nocodazole or monastrol, and stained with DAPI and antibodies against Zwlich and CENP-C. Scale bar, 5 µM. (h) Quantification of the kinetochore Zwlich intensity relative to CENP-C in the dynein-stripping assay as depicted in g. In d, f, and h, boxes depict the median and first and third quartiles, and whiskers represent Q1 and Q3 ± 1.5× interquartile range. ****, P < 0.0001.
Figure S4.
Figure S4.
SKAP controls for stripping assay and coiled-coil alignments for CENP-FΔ1882-2292. (a) Immunofluorescence microscopy images of HeLa-K cells treated with control or DHC siRNA, arrested in 100 µM monastrol for 4 h, and stained with antibodies against CENP-C, α-tubulin, and SKAP. Scale bar, 5 µm. (b) Quantification of kinetochore SKAP signal relative to CENP-C in HeLa-K cells treated with control or DHC siRNA and arrested in 100 µM monastrol for 4 h. (c) Immunofluorescence microscopy images of HeLa-K, CENP-F-Mut1, and CENP-F-Mut2 cells treated with control or DIC siRNA, arrested in 100 µM monastrol for 4 h, and stained with antibodies against CENP-C, α-tubulin, and SKAP. Scale bar, 5 µm. (d) Quantification of kinetochore SKAP signal relative to CENP-C in HeLa-K, CENP-F-Mut1, and CENP-F-Mut2 cells treated with control or DIC siRNA and arrested in 100 µM monastrol for 4 h. (e) COILS (https://embnet.vital-it.ch/software/COILS_form.html) coiled-coil prediction for CENP-F and CENP-FΔ1882–2292. (f) COILS coiled-coil prediction for CENP-F^mEmerald and CENP-FΔ1882–2292^mEmerald. In b and d, boxes depict the median and first and third quartiles, and whiskers represent Q1 and Q3 ± 1.5× interquartile range.
Figure 5.
Figure 5.
CENP-F functions to limit dynein stripping of the corona. (a) Left: Immunofluorescence microscopy images from the dynein-stripping assay for CENP-E in CENP-F-Mut1 cells. Cells were treated with control or DHC siRNA, arrested in nocodazole or monastrol, and stained with DAPI and antibodies against CENP-E and CENP-C. Scale bar, 5 µm. Right: Quantification of the kinetochore CENP-E intensity relative to CENP-C in the dynein-stripping assay. (b) Left: Immunofluorescence microscopy images of the dynein-stripping assay for CENP-E in CENP-F-Mut2 cells. Cells were treated with control or DHC siRNA, arrested in nocodazole or monastrol, and stained with DAPI and antibodies against CENP-E and CENP-C. Scale bar, 5 µm. Right: Quantification of the kinetochore CENP-E intensity relative to CENP-C in the dynein-stripping assay. (c) Left: Immunofluorescence microscopy images of the dynein-stripping assay for Mad2 in CENP-F-Mut1 cells. Cells were treated with control or DHC siRNA, arrested in nocodazole or monastrol, and stained with DAPI and antibodies against Mad2 and CENP-C. Scale bar, 5 µm. Right: Quantification of the kinetochore Mad2 intensity relative to CENP-C in the dynein-stripping assay. (d) Left: Immunofluorescence microscopy images of the dynein-stripping assay for Mad2 in CENP-F-Mut2 cells. Cells were treated with control or DHC siRNA, arrested in nocodazole or monastrol, and stained with DAPI and antibodies against Mad2 and CENP-C. Scale bar, 5 µm. Right: Quantification of the kinetochore Mad2 intensity relative to CENP-C in the dynein-stripping assay. (e) Left: Immunofluorescence microscopy images of the dynein-stripping assay for Zwlich in CENP-F-Mut1 cells. Cells were treated with control or DHC siRNA, arrested in nocodazole or monastrol, and stained with DAPI and antibodies against Zwlich and CENP-C. Scale bar, 5 µm. Right: Quantification of the kinetochore Zwlich intensity relative to CENP-C in the dynein-stripping assay. (f) Left: Immunofluorescence microscopy images of the dynein-stripping assay for Zwlich in CENP-F-Mut2 cells. Cells were treated with control or DHC siRNA, arrested in nocodazole or monastrol, and stained with DAPI and antibodies against Zwlich and CENP-C. Scale bar, 5 µm. Right: Quantification of the kinetochore Zwlich intensity relative to CENP-C in the dynein-stripping assay. Boxes depict the median and first and third quartiles, and whiskers represent Q1 and Q3 ± 1.5× interquartile range. ****, P < 0.0001.
Figure 6.
Figure 6.
Lattice light sheet imaging of Spindly dynamics in live cells. (a) Video stills of siControl-treated HeLa cells expressing doxycycline-inducible LAP-Spindly after nocodazole washout. Cells were arrested in 3.3 µM nocodazole for 4 h and washed once, and a full cell volume was acquired using a lattice light sheet microscope every 1 min for 1 h. Insets show zooms of single kinetochores from the detection panel. Scale bar, 5 µm. (b) Video stills of siCENP-F–treated HeLa cells expressing doxycycline-inducible LAP-Spindly after nocodazole washout. Cells were arrested in 3.3 µM nocodazole for 4 h and washed once, and a full cell volume was acquired using a lattice light sheet microscope every 1 min for 1 h. Insets show zooms of single kinetochores from the detection panel. Scale bar, 5 µm. (c) Quantification of the cumulative LAP-Spindly intensity for all kinetochores at each time point over the 60-min video for siControl- and siCENP-F–treated cells. Measurements were made using TrackMate in Fiji. Error bars are ±SD. (d) Quantification of the spot number at each time point over the 60-min video for siControl- and siCENP-F–treated cells. Measurements were made using TrackMate in Fiji. Errors bars are ±SD. (e) Quantification of the median spot intensity at each time point over the 60-min video for siControl- and siCENP-F–treated cells. Measurements were made using TrackMate in Fiji. Errors bars are ±SD.
Figure 7.
Figure 7.
CENP-F directly controls Nde1 loading to kinetochores. (a) Immunofluorescence microscopy images of HeLa-K, CENP-F-Mut1, and CENP-F-Mut2 cells arrested in 330 nM nocodazole for 16 h and stained with DAPI and antibodies against CENP-C and Ndel1. Scale bar, 5 µm. (b) Quantification of kinetochore Ndel1 levels relative to CENP-C in HeLa-K, CENP-F-Mut1, and CENP-F-Mut2 cells arrested in 330 nM nocodazole for 16 h. (c) Immunofluorescence microscopy images of HeLa-K, CENP-F-Mut1, and CENP-F-Mut2 cells arrested in 330 nM nocodazole for 16 h and stained with DAPI and antibodies against CENP-C and Nde1. Scale bar, 5 µm. (d) Quantification of kinetochore Nde1 levels relative to CENP-C in HeLa-K, CENP-F-Mut1, and CENP-F-Mut2 cells arrested in 330 nM nocodazole for 16 h. (e) Immunofluorescence microscopy images of HeLa-K, CENP-F-Mut1, and CENP-F-Mut2 cells expressing eGFP-Lis1, arrested in 330 nM nocodazole for 16 h, and stained with DAPI and an antibody against CENP-C. Scale bar, 5 µm. (f) Quantification of kinetochore eGFP-Lis1 levels after background subtraction in HeLa-K, CENP-F-Mut1, and CENP-F-Mut2 cells arrested in 330 nM nocodazole for 16 h. (g) Immunofluorescence microscopy images of HeLa-K, CENP-F-Mut1, and CENP-F-Mut2 cells arrested in 330 nM nocodazole for 16 h and stained with DAPI and antibodies against CENP-C and DIC. Scale bar, 5 µm. (h) Quantification of kinetochore DIC levels relative to CENP-C in HeLa-K, CENP-F-Mut1, and CENP-F-Mut2 cells arrested in 330 nM nocodazole for 16 h. (i) Cartoon schematic of Nde1-binding mutants. (j) Immunofluorescence microscopy images of HeLa-K, CENP-F-Mut1, and CENP-F-Mut2 cells transfected with eGFP, CENP-F^mEmerald, or the Nde1-binding mutants, arrested in 330 nM nocodazole for 16 h, and stained with antibodies against CENP-C and Nde1. Scale bar, 5 µm. (k) Quantification of kinetochore Nde1 levels relative to CENP-C in HeLa-K, CENP-F-Mut1, and CENP-F-Mut2 cells transfected with eGFP, CENP-F^mEmerald, or the Nde1-binding mutants and arrested in nocodazole. In b, d, f, h, and k, boxes depict the median and first and third quartiles, and whiskers represent Q1 and Q3 ± 1.5× interquartile range. ****, P < 0.0001.
Figure 8.
Figure 8.
CENP-F-Nde1 controls corona stripping by dynein in untreated cells. (a) Immunofluorescence microscopy images of HeLa-K, CENP-F-Mut1, and CENP-F-Mut2 cells transfected with an empty vector, eGFP-CENP-F(2021–2901), or eGFP-CENP-F(2351–2901) and stained with DAPI and antibodies against CENP-E and CENP-C. Scale bar, 5 µm. (b) Immunofluorescence microscopy images of HeLa-K, CENP-F-Mut1, and CENP-F-Mut2 cells transfected with an empty vector, CENP-F^mEmerald, or CENP-FΔ1882–2292^mEmerald and stained with DAPI and antibodies against CENP-E and CENP-C. Scale bar, 5 µm. (c) Left: Quantification of kinetochore eGFP intensities minus background in cells expressing eGFP-CENP-F(2021–2901) or eGFP-CENP-F(2351–2901). Right: Quantification of kinetochore CENP-E intensities relative to CENP-C in HeLa-K, CENP-F-Mut1, and CENP-F-Mut2 cells transfected with an empty vector, eGFP-CENP-F(2021–2901), or eGFP-CENP-F(2351–2901). (d) Left: Quantification of kinetochore eGFP intensities minus background in cells expressing CENP-F^mEmerald or CENP-FΔ1882–2292^mEmerald. Right: Quantification of kinetochore CENP-E intensities relative to CENP-C in HeLa-K, CENP-F-Mut1, and CENP-F-Mut2 cells transfected with an empty vector, CENP-F^mEmerald, or CENP-FΔ1882–2292^mEmerald. In c and d, boxes depict the median and first and third quartiles, and whiskers represent Q1 and Q3 ± 1.5× interquartile range. ****, P < 0.0001.
Figure 9.
Figure 9.
CENP-F-Nde1 controls corona stripping by dynein the nocodazole-monastrol assay. (a) Immunofluorescence microscopy images of the nocodazole-monastrol dynein-stripping assay in CENP-F-Mut1 and CENP-F-Mut2 cells transfected with an empty vector, eGFP-CENP-F(2021–2901), or eGFP-CENP-F(2351–2901) and stained with antibodies against CENP-E and CENP-C. Scale bar, 5 µm. (b) Immunofluorescence of the nocodazole-monastrol dynein-stripping assay in CENP-F-Mut1 and CENP-F-Mut2 cells transfected with an empty vector, CENP-F^mEmerald, or CENP-FΔ1882–2292^mEmerald and stained with antibodies against CENP-E and CENP-C. Scale bar, 5 µm. (c) Quantification of kinetochore CENP-E intensities relative to CENP-C in the nocodazole-monastrol assay depicted in a. (d) Quantification of kinetochore CENP-E intensities relative to CENP-C in the nocodazole-monastrol assay depicted in b. In c and d, boxes depict the median and first and third quartiles, and whiskers represent Q1 and Q3 ± 1.5× interquartile range. ****, P < 0.0001.
Figure S5.
Figure S5.
Loss of CENP-F perturbs mitotic progression and influences the Spindly dependent retention of CENP-E. (a) Cumulative frequency plots of congression time, metaphase duration, and nuclear envelope breakdown-anaphase in HeLa-K, CENP-F-Mut1, and CENP-F-Mut2 cells visualized with 1 µM SiRDNA. (b) Video stills of anaphase eGFP-CENP-A–expressing cells treated with either control or CENP-F siRNA. Scale bar, 5 µm. (c) Images of HeLa-K or CENP-F-Mut2 cells labeled with 1 µM SiRDNA progressing though anaphase. Yellow arrows indicate an error. Scale bar, 5 µm. (d) Quantification of anaphase kinetochore velocity in eGFP-CENP-A–expressing HeLa cells treated with control or CENP-F siRNA. Velocity measurements were taken from tracks of processive movement that lasted at least three time frames. (e) Quantification of anaphase error rates in HeLa-K, CENP-F-Mut1, and CENP-F-Mut2 cells. (f) Immunofluorescence microscopy images of HeLa-K cells treated with control or Spindly siRNA and stained with DAPI and antibodies against CENP-C and Spindly. Scale bar, 5 µm. (g) Quantification of kinetochore Spindly level relative to CENP-C in HeLa-K cells treated with control or Spindly siRNA. (h) Immunofluorescence microscopy images of HeLa-K, CENP-F-Mut1, and CENP-F-Mut2 cells treated with control or Spindly siRNA and stained with DAPI and antibodies against CENP-C and CENP-E. Scale bar, 5 µm. (i) Quantification of kinetochore CENP-E level relative to CENP-C in HeLa-K, CENP-F-Mut1, and CENP-F-Mut2 cells treated with control or Spindly siRNA. (j) Quantification of the number of unaligned chromosomes per half-spindle in HeLa-K, CENP-F-Mut1, and CENP-F-Mut2 cells treated with control or Spindly siRNA. In d, g, h, and i, boxes depict the median and first and third quartiles, and whiskers represent Q1 and Q3 ± 1.5× interquartile range.
Figure 10.
Figure 10.
Distinct functional contributions of Nde1 and MT binding by CENP-F. (a) Schematic depicting the monastrol release experiment. Scale bar, 5 µm. (b) Immunofluorescence microscopy images of HeLa-K, CENP-F-Mut1, and CENP-F-Mut2 cells transfected with eGFP, CENP-F^mEmerald, or CENP-FΔn+cMTBD^mEmerald, released from a monastrol block for 1 h, and stained with an antibody against CENP-C. Scale bar, 5 µm. (c) Immunofluorescence microscopy images of HeLa-K, CENP-F-Mut1, and CENP-F-Mut2 cells transfected with eGFP, eGFP-CENP-F(2021–2901), or eGFP-CENP-F(2351–2901), released from a monastrol block for 1 h, and stained with an antibody against CENP-C. Scale bar, 5 µm. (d) The proportion of HeLa-K, CENP-F-Mut1, and CENP-F-Mut2 cells transfected with eGFP, CENP-F^mEmerald, or CENP-FΔn+cMTBD^mEmerald with unaligned chromosomes 1 h after release from monastrol block. (e) The proportion of HeLa-K, CENP-F-Mut1, and CENP-F-Mut2 cells transfected with eGFP, eGFP-CENP-F(2021–2901), or eGFP-CENP-F(2351–2901) with unaligned chromosomes 1 h after release from monastrol block. (f) Top: A working model of coronal stripping as end-on attachments form and mature: as end-on attachments form (step i), Spindly-bound dynein motor complexes are released and begin striping cargoes (including CENP-E, Mad2, and Zwlich) from the kinetochore. As these sister-pairs biorient and align in metaphase (step ii), Bub1 is also lost, leading to a reduction in CENP-F and further dynein stripping. Bottom: Schematic depicting molecular basis for dynein recruitment and regulation at the kinetochore. Spindly-bound dynein is released after end-on attachment to strip a myriad of coronal cargoes (green). RZZ binds directly to Spindly, while the physical interactions that bridge CENP-E (which binds BubR1) and dynein motors is unknown. Mad2–Mad1 complexes bind Cyclin B in the corona, although how this bridges to dynein is also unknown. The CENP-F dynein brake/tether, which includes Nde1 and potentially Lis1, is loaded to kinetochores via the direct interaction of CENP-F with Bub1, a component of the KNL3-Bub3-Bub1 (KBB) pathway (light blue). CENP-F-Nde1-Ndel1-Lis1 (FNNL; dark blue) limits the strip rate to ensure kinetochores have the correct protein stoichiometry in the corona. In d and e, boxes depict the median and first and third quartiles, and whiskers represent Q1 and Q3 ± 1.5× interquartile range. ****, P < 0.0001.

References

    1. Allan L.A., Reis M., Liu Y., Huis in ’t Veld P., Kops G.J.P.L., Musacchio A., and Saurin A.T.. 2019. Cyclin B1 scaffolds MAD1 at the corona to activate the spindle assembly checkpoint. bioRxiv. doi:10.1101/726224 (Preprint posted August 5, 2019)
    1. Auckland P., Clarke N.I., Royle S.J., and McAinsh A.D.. 2017. Congressing kinetochores progressively load Ska complexes to prevent force-dependent detachment. J. Cell Biol. 216:1623–1639. 10.1083/jcb.201607096 - DOI - PMC - PubMed
    1. Bancroft J., Auckland P., Samora C.P., and McAinsh A.D.. 2015. Chromosome congression is promoted by CENP-Q- and CENP-E-dependent pathways. J. Cell Sci. 128:171–184. 10.1242/jcs.163659 - DOI - PMC - PubMed
    1. Baumbach J., Murthy A., McClintock M.A., Dix C.I., Zalyte R., Hoang H.T., and Bullock S.L.. 2017. Lissencephaly-1 is a context-dependent regulator of the human dynein complex. eLife. 6:e21768 10.7554/eLife.21768 - DOI - PMC - PubMed
    1. Berto A., and Doye V.. 2018. Regulation of Cenp-F localization to nuclear pores and kinetochores. Cell Cycle. 17:2122–2133. 10.1080/15384101.2018.1520569 - DOI - PMC - PubMed

Publication types