. 2020 Jun 2;21(6):570-580.
doi: 10.1080/15384047.2020.1739952. Epub 2020 Mar 25.

Chimeric cytokine receptor enhancing PSMA-CAR-T cell-mediated prostate cancer regression

Affiliations

Chimeric cytokine receptor enhancing PSMA-CAR-T cell-mediated prostate cancer regression

Shao Weimin et al. Cancer Biol Ther. .

Abstract

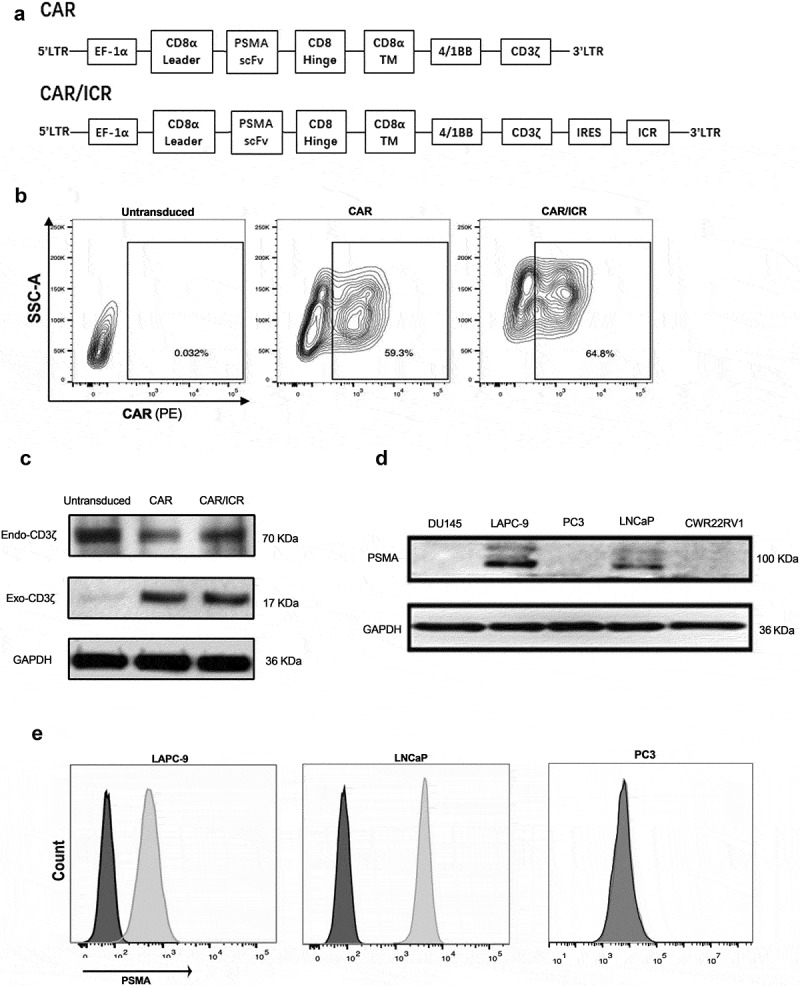
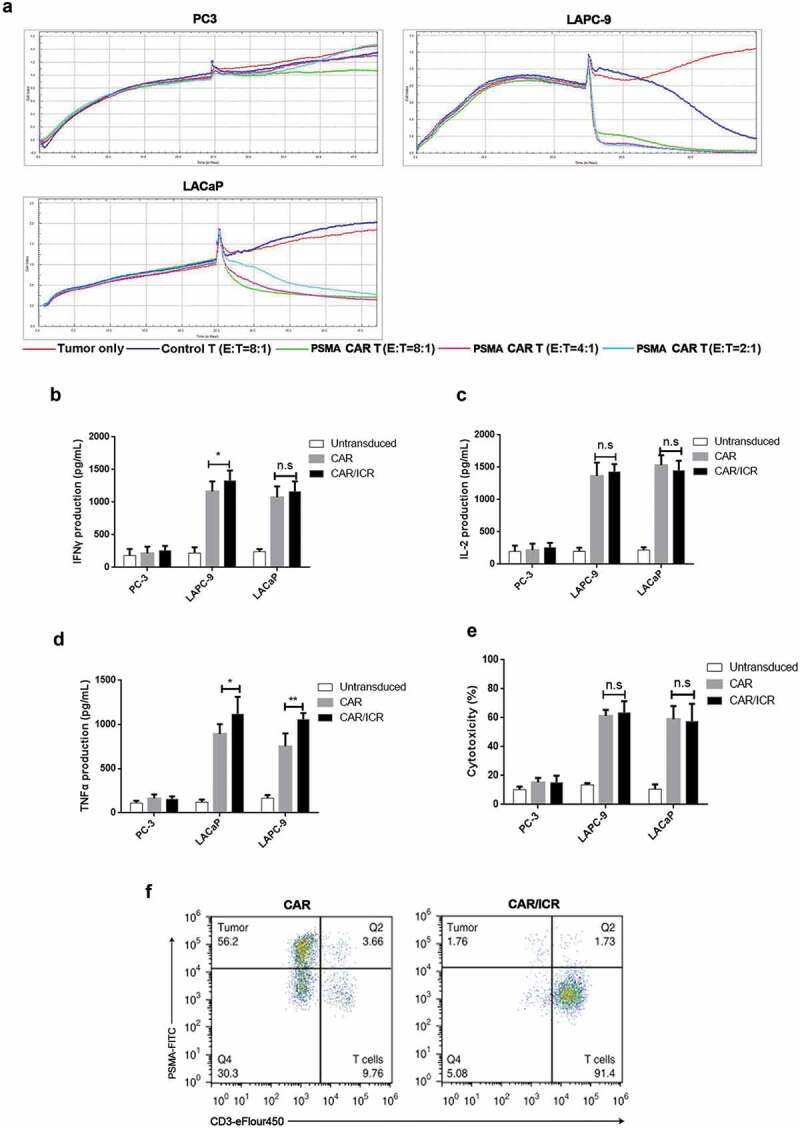
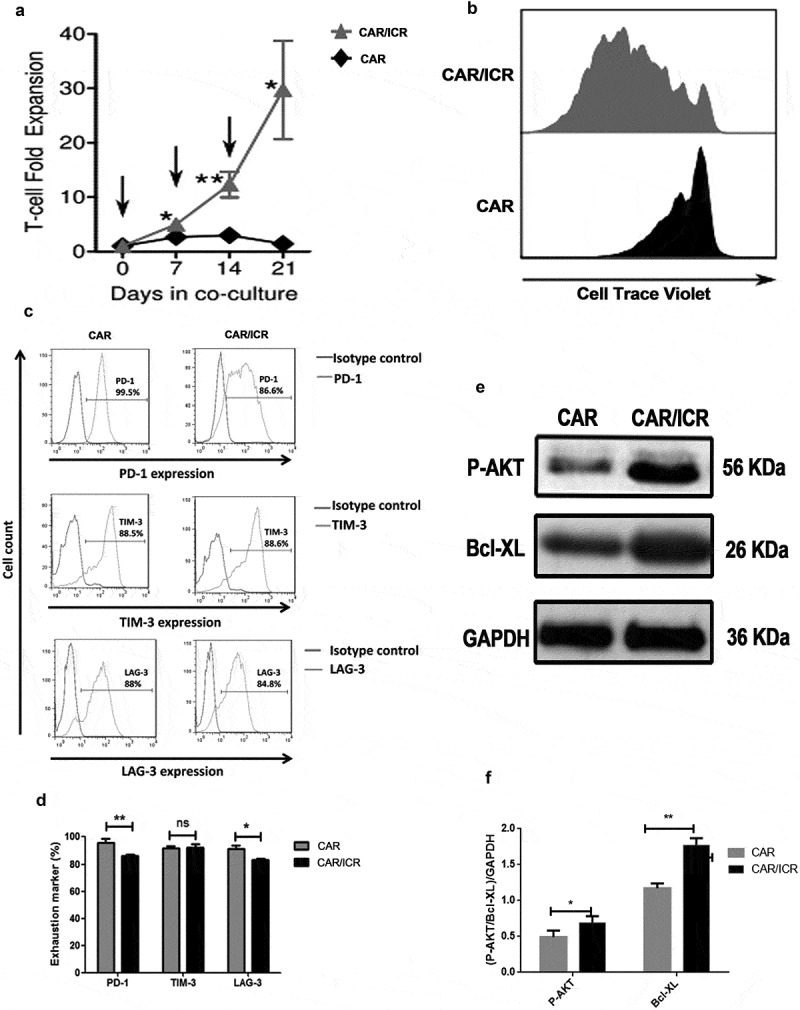
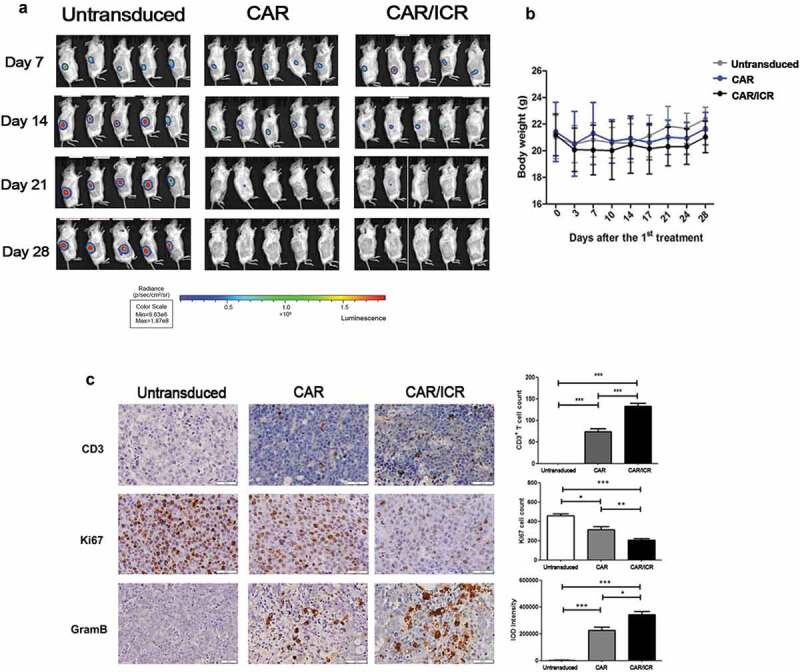
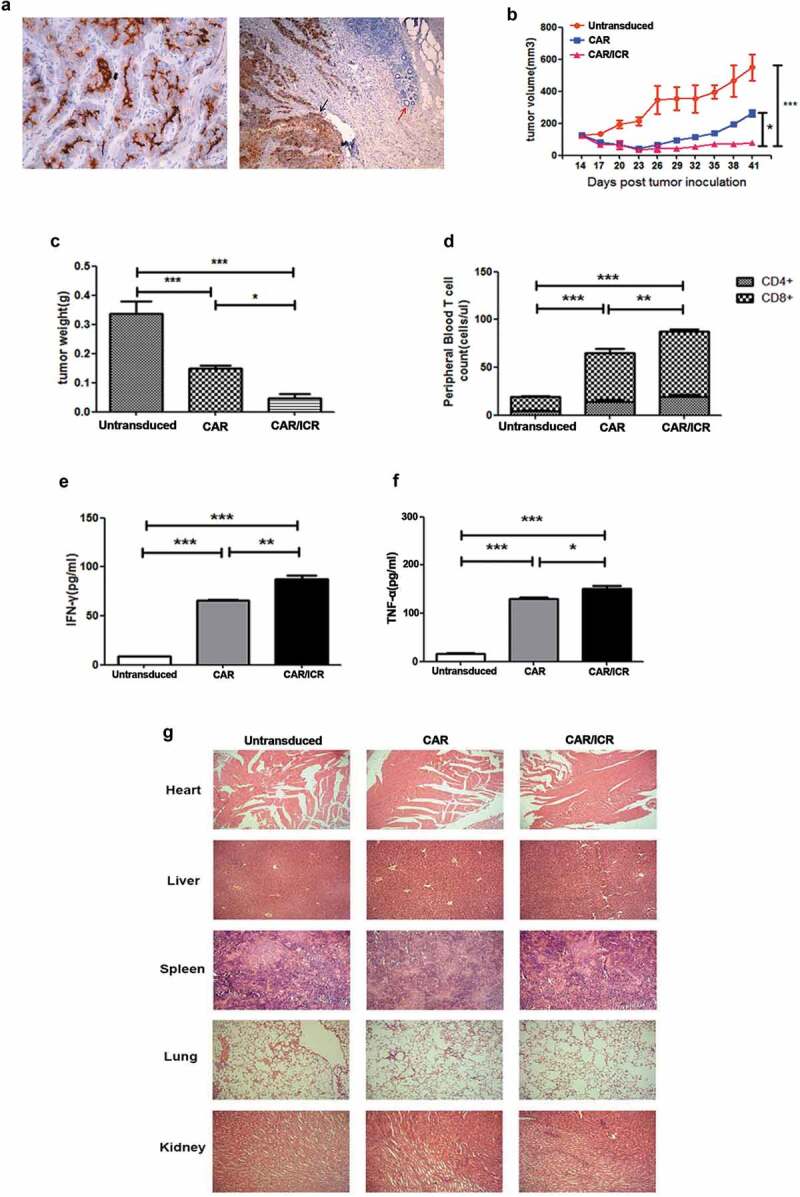
Objective: Chimeric antigen receptor T (CAR-T) cell therapy has demonstrated an unprecedented therapeutic efficacy in hematological malignancies; however, its effectiveness in solid tumors remains elusive. In order to enable CAR-T cells more effective to solid tumors, a inverted chimeric cytokine receptor (ICR) was designed, which is consists of the TGF-β extracellular domain, IL-7 receptor intracellular domain, and co-expression on CAR-T cells.Materials and Methods: We selected prostate specific membrane antigen (PSMA) as a target for CAR-T cells, constructed corresponding effector cells, and verified the anti-tumor activity of this enhanced PSMA-CAR-T cell by a series of repeated target cell stimulation experiments in vitro and the anti-tumor capabilities by using mice xenograft model in vivo.Results: In vitro experiments showed that co-expression of ICR could significantly enhance sustained anti-tumor capabilities of PSMA-CAR-T cells. Moreover, in vivo experiments also confirmed that the enhanced PSMA-CAR-T cells exhibited significant superior anti-tumor capabilities and could prolong the survival time in the xenograft and PDX models of prostate cancer.Conclusions: PSMA-CAR-T cells co-expressing ICR can be envisaged as a new therapeutic strategy for prostate cancer and support the translation of this enhanced approach in the clinical setting.

Keywords: Chimeric antigen receptor T; effector cells; prostate cancer; prostate specific membrane antigen; xenograft.


Figures

Figure 1.
Figure 1.
Selection of for target cells and construction of effector cells. a. Gene structure of effector cell CAR. b. The positive rate of CAR-T cells measured by flow cytometry 5 days after T cell transfection. c. CD3ζ detected by western blot. Exogenous CD3ζ was presented as a 70 kD band only in the lanes of CAR-T cells, and endogenous CD3ζ was presented as a 17 kD band in the lanes of control T-cells and CAR-T cells. GAPDH was used as the internal reference. d. The expression of PSMA antigen in prostate cancer cells as assessed by Western blot. PSMA was around 100 kD. GAPDH was used as an internal reference. e. The expression of PSMA in LAPC-9,LNCaP and PC3 cells as analyzed by flow cytometry. f. Western blot was used to detect the content of TGF-β1 in the cell culture supernatant.
Figure 2.
Figure 2.
Effects of ICR on in vitro activation and cytotoxicity of PSMA-CAR-T cells. a. Real-time cytotoxicity assay showed the proliferation of adherent cancer cells; each curve represented a well of cancer cells. Three different effector-target ratios were selected for PSMA-CAR-T cells (E: T ratio: 8:1, 4:1 and 2:1), while only one E: T ratio was chosen for the control T cells (8:1). At the initial stage, 1 × 104 tumor cells were inoculated into each well for 24 hours of incubation. In the second stage, T cells or the media were added to corresponding wells for 24 hours of further incubation. b. 1 × 104 target cells were co-incubated with effector cells at an effector-target ratio of 2:1 for 24 h, followed by the determination of secretion level of IFN-γ. (n = 3, bar value represents the dispersion degree, *, p < .05, **, p < .01). c. Determination of the secretion level of IL-2. (n = 3, bar value represents the dispersion degree, *, p < .05, **, p < .01). d. Determination of the secretion level of TNF-α. (n = 3, bar value represents the dispersion degree, *, p < .05, **, p < .01). e. 1 × 104 tumor cells were co-incubated with effector cells at an effector-target ratio of 2:1 for 6 h, followed by measurement of the level of LDH in the supernatant to characterize cytotoxicity (n = 3, bar value represents the dispersion degree, *, p < .05). F. Representative flow cytometry dot diagram indicated the lysis of target cells induced by CAR-T cells after 3 rounds of tumor cell stimulation.
Figure 3.
Figure 3.
ICR enhanced the viability of PSMA-CAR-T cells after repeated in vitro stimulation of tumor cells. a. Cumulative amplification of PSMA-CAR-T cells or PSMA-CAR-T cells co-expressing ICR during continuous co-culture. The arrow indicated the time at which T cells were re-stimulated by tumor cells. b. For proliferation analysis, PSMA-CAR-T cells and PSMA-CAR-T cells co-expressing ICR were collected at the end of the second tumor cell stimulation and labeled with Cell Trace Violet, at the 4th day, cells were collected after the third stimulation for flow cytometric analysis. c. After three rounds of antigen-specific stimulation with LAPC-9 cells, flow cytometry was performed to determine the expression of biomarkers representing cell depletion on the surface of T-cells, including PD-1, TIM-3, and LAG-3 antibodies. d. Bar graph of PD-1, TIM-3 and LAG-3 expression (n = 3, bar value represents the dispersion degree, ns not significant, p > .05, * p < .05, ** p < .01, * ** p < .001). e. After three rounds of antigen-specific stimulation with LAPC-9 cells, T cells were isolated and subjected to Western blot for measurement of the expression levels of p-Akt and Bcl-xL. F. The bar graph showed the quantitative densitometry results of the protein levels of phosphorylated Akt and Bcl-xL. (n = 3, bar value represents the dispersion degree, * p < .05, ** p < .01).
Figure 4.
Figure 4.
PSMA-CAR-T cells co-expressing ICR significantly enhanced the anti-tumor effects in the xenograft model. a. In vivo image of LAPC-9-luc xenograft model. b. Quantitative value of fluorescence intensity of tumors in vivo in each treatment group. c. Variations in the body weight of the xenograft model inoculated with tumor cells and after treatment (n = 5, bar value represents the dispersion degree). d. Immunohistochemical expression of CD3, Ki67, and granzyme B in tumor cells. Each datum represents three independent experiments (n = 3, bar value represent the dispersion degree, ns not significant, p > .05, * p < .05, ** p < .01, *** p < .001).
Figure 5.
Figure 5.
PSMA-CAR-T cells co-expressing ICR significantly enhanced the anti-tumor effects in the PDX model. a. Immunohistochemical analysis of PSMA antigen expression in patient-derived tissues. b. After the establishment of the PDX model, CAR-T cells were administered through the caudal vein for the experiment groups and untransduced T cells for the control group. Tumor volume was measured with a vernier calliper every 3 days. c. On the 41st day, mice were sacrificed and tumor weight was measured. d. 100 μL of peripheral blood of the mice was collected on the 7th day after the infusion of effector cells, and the number of CD4+ and CD8+ T cells was counted. e. Level of IFN-γ in the peripheral blood of mice. f. Levels of TNF-α in the peripheral blood of mice. Each datum represents 3 independent experiments (n = 6, bar value represent the dispersion degree, * p < .05, ** p < .01, *** p < .001). g. Safety analysis of major organs after CAR-T cell treatment. The hearts, livers, spleens, lungs, and kidneys of each group were embedded in paraffin and cut into sections, which were stained with hematoxylin and eosin. Images were taken at 10 × magnification.

References

    1. Vaidyanathan V, Karunasinghe N, Jabed A, Pallati R, Kao C, Wang A, Marlow G, Ferguson L.. Prostate cancer: is it a battle lost to age? Geriatrics (Basel). 2016;1(4):E27. doi:10.3390/geriatrics1040027. - DOI - PMC - PubMed
    1. Roudi R, Nemati H, Rastegar Moghadam M, Sotoudeh M, Narouie B, Shojaei A. Association of homeobox B13 (HOXB13) gene variants with prostate cancer risk in an Iranian population. Med J Islam Repub Iran. 2018;32:97. doi:10.14196/mjiri.32.128. - DOI - PMC - PubMed
    1. Schuster SJ. CD19-directed CAR T cells gain traction. Lancet Oncol. 2019;20(1):2–3. doi:10.1016/S1470-2045(18)30900-8. - DOI - PubMed
    1. Alayed Y, Cheung P, Chu W, Chung H, Davidson M, Ravi A, Helou J, Zhang L, Mamedov A, Commisso A, et al. Two StereoTactic ablative radiotherapy treatments for localized prostate cancer (2STAR): results from a prospective clinical trial. Radiother Oncol. 2019;135:86–90. doi:10.1016/j.radonc.2019.03.002. - DOI - PubMed
    1. Dierks T, Heijnsdijk EAM, Korfage IJ, Roobol MJ, de Koning HJ. Informed decision-making based on a leaflet in the context of prostate cancer screening. Patient Educ Couns. 2019;102(8):1483–1489. doi:10.1016/j.pec.2019.03.009. - DOI - PMC - PubMed

Publication types