. 2020 Apr 1;123(4):1566-1577.
doi: 10.1152/jn.00290.2019. Epub 2020 Mar 25.

Frontal scalp potentials foretell perceptual choice confidence

Affiliations

Frontal scalp potentials foretell perceptual choice confidence

Koeun Lim et al. J Neurophysiol. .

Abstract

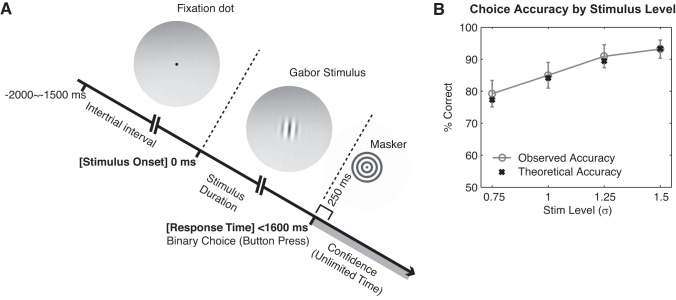
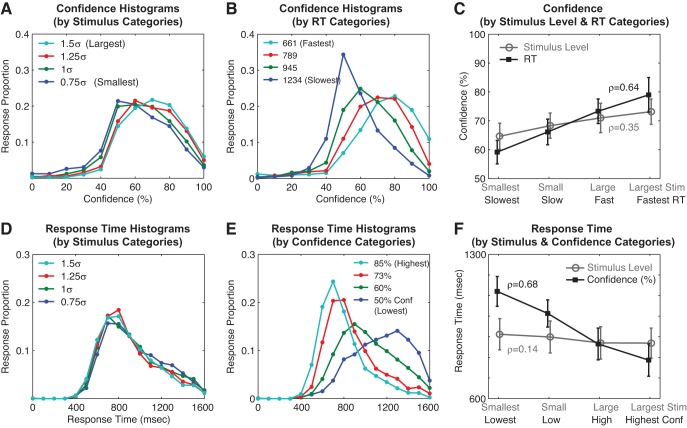
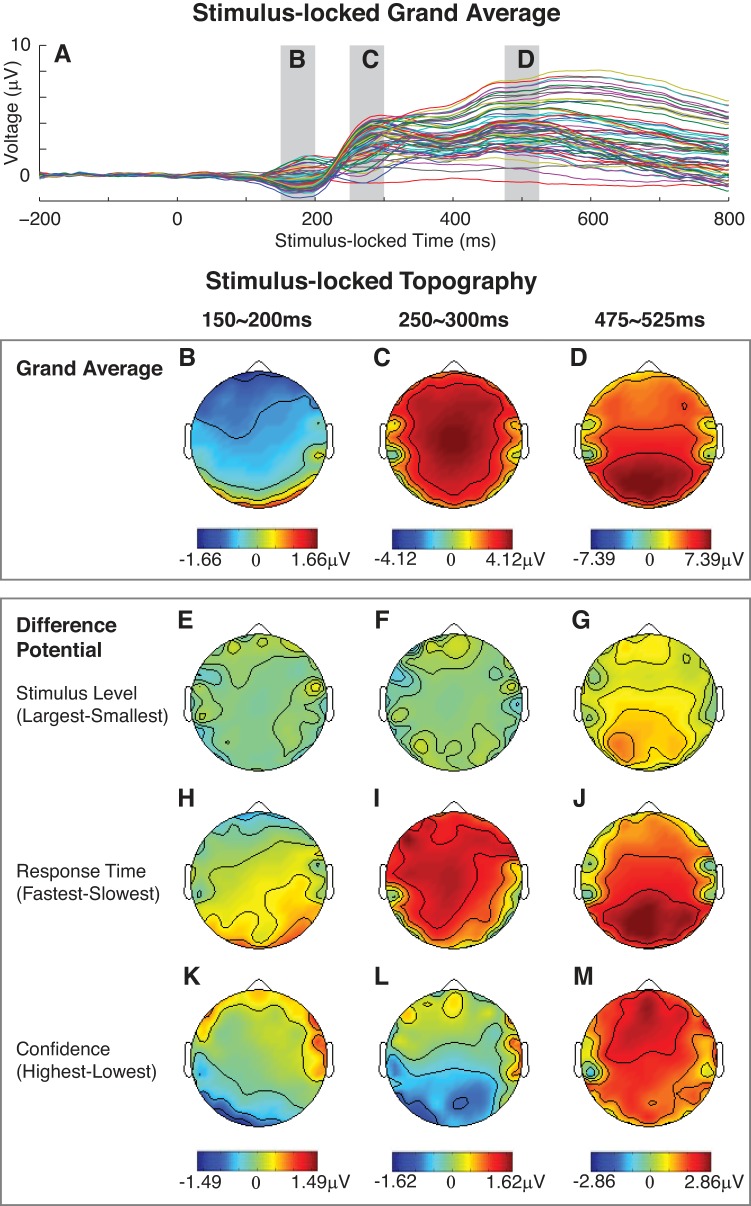
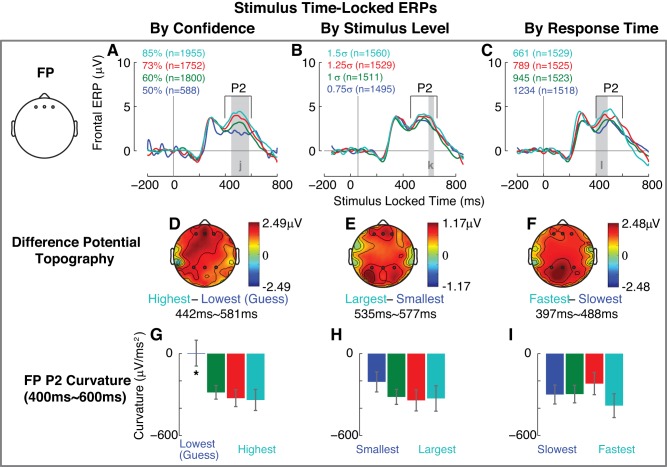
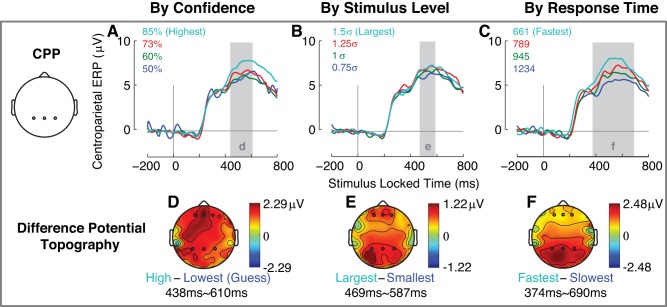
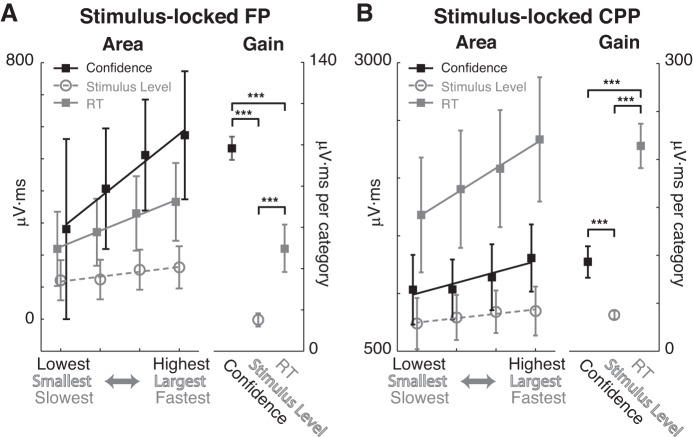
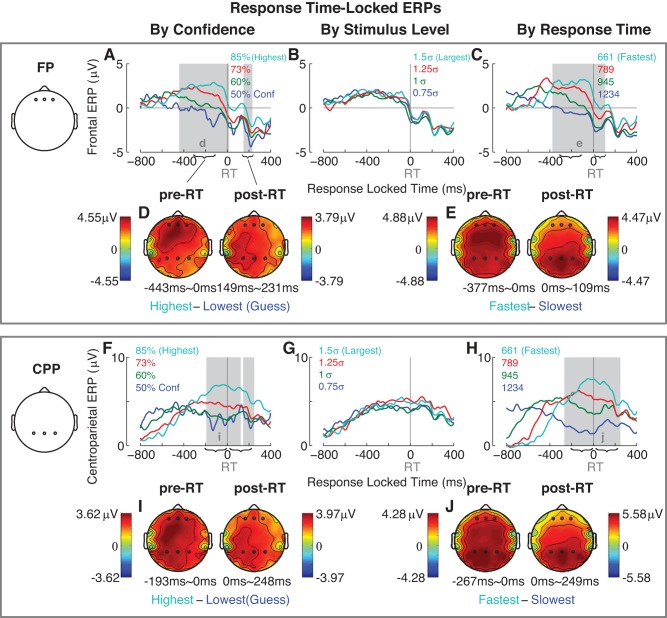
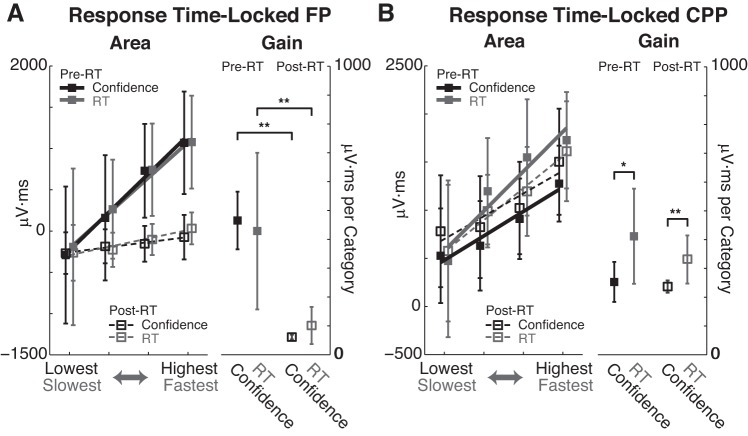
When making decisions, people naturally ask two implicit questions: how soon can I make a decision, and how certain am I? In perception, people's confidence (how certain?) shows a nonmonotonic relationship with response time (how soon?), such that choice confidence can either increase or decrease with response time. Although a frontoparietal network has been implicated as a neural substrate that binds choice confidence and action (e.g., response time), the dynamic interplay between choice behaviors within such a network has not been clarified. Here, we show that frontal event-related potentials (ERPs) reflect choice confidence before a decision. Specifically, we report a second positive peak of the stimulus-locked frontal ERP at ~500 ms that scales with confidence but not stimulus level, whereas the centroparietal ERP amplitude covaries inversely with response time. This frontal ERP component occurs before the response, which helps explain the inverse relationship between choice confidence and response time (i.e., higher confidence for shorter response time) when choice accuracy is emphasized over speed. Our findings provide the first early neural representation of confidence, consistent with the temporal precedence for its causal role in the current decision-making task: "I decided earlier because I am confident."NEW & NOTEWORTHY We report novel neural correlates of predecisional choice confidence in frontal scalp potential in humans. In conjunction with the centroparietal choice-action event-related potential component, this new frontal choice confidence component further elucidates the dynamics of the frontoparietal decision-making neural circuitry.

Keywords: ERP; SVV; choice confidence; decision-making; perception.


Conflict of interest statement

No conflicts of interest, financial or otherwise, are declared by the authors.

Figures

Fig. 1.
Fig. 1.
Experimental procedure and behavioral data. A: experimental procedure. B: choice accuracy as a function of stimulus (Stim) level. Four stimulus levels (0.75σ, 1σ, 1.25σ, and 1.5σ) were chosen based on each individual subject’s perceptual threshold (1σ). Black crosses show the theoretic signal-detection accuracy, and gray circles show the observed accuracy. Symbols show the mean across subjects of each subject’s median value, and error bars show 95% confidence intervals across 15 subjects.
Fig. 2.
Fig. 2.
Behavioral data showing the grand average across 15 subjects. AC: confidence histograms categorized by 4 stimulus (σ) categories (A) or 4 response-time (RT) categories (B). Confidence below 50% represents incorrect responses (Lim et al. 2017; Yi and Merfeld 2016). C: correlations between median confidence and other grouping variables [stimulus (Stim) levels in gray and response times in black]. DF: response-time histograms categorized by 4 stimulus categories (D) or 4 confidence (Conf) categories (E). F: correlations between median response time and other grouping variables (stimulus levels in gray and confidence in black). Symbols show the mean across subjects of each subject’s median value, and error bars show 95% confidence intervals across 15 subjects.
Fig. 3.
Fig. 3.
Stimulus-locked EEG time trace and topography. A: grand average time trace for all channels. Gray shades highlight 3 time intervals, approximately 150–200, 250–300, and 475–525 ms from the stimulus onset, respectively. AD: grand average topography. Blue indicates negative potential, and red indicates positive potential. EG: difference potential between largest and smallest stimulus levels. HJ: difference potential between fastest and slowest response times. KM: difference potential between highest and lowest confidence. Scale ± 1.49 μV for E, H, and K (approximately 150–200 ms); ± 1.62 μV for F, I, and L (approximately 250–300 ms); and ± 2.86 μV for G, J, and M (approximately 475–525 ms).
Fig. 4.
Fig. 4.
Frontal potentials (FPs) for each of 3 factors. AC: FPs for 4 categories of confidence (A), stimulus (B), and response time (C). FP P2 is marked with horizontal brackets (approximately 400–600 ms); gray intervals indicate significant event-related potential (ERP) differences (randomized cluster analysis). D and E: difference potential topography for confidence (P = 0.006; D), stimulus level (P = 0.011; E), and response time (P = 0.006; F). FP P2 curvatures for the 4 categories of confidence (G), stimulus (H), and response time (I) are shown. *Curvature is not significantly different from 0 (t = 0.048, P = 0.96).
Fig. 5.
Fig. 5.
The effects of confidence, stimulus level, and response time on stimulus-locked centroparietal potential (CPP). AC: CPPs categorized by confidence (A), stimulus levels (σ; B), and response time (C). Gray shade shows the time interval during which the difference potential between the 2 extreme categories (cyan and blue) is significant (2-sided t test, α = 0.05). DF: difference potential topographies for confidence (random cluster analysis, P = 0.002; D), stimulus level (P = 0.010; E), and response time (P < 0.001; F). ERP, event-related potential.
Fig. 6.
Fig. 6.
Stimulus-locked event-related potential components. Frontal potential (FP) area and slope (gain; A) and centroparietal potential (CPP) area and slopes (gain; B) as a function of confidence (black squares), stimulus (circles), and response-time (RT; gray squares) categories are shown. Lines show the repeated-measures linear mixed-effect model fits, markers show the mean across subjects, and error bars show 95% confidence intervals. Horizontal bars with triple asterisks indicate P ≤ 0.0001.
Fig. 7.
Fig. 7.
Response-time-locked event-related potentials (ERPs). AC: frontal ERPs for the 4 levels of confidence (Conf; A), stimulus level (σ; B), and response time (RT; C). Baseline correction was referenced to approximately 200–0 ms before the stimulus onset. Gray shades show the time interval during which the difference potential between the greatest (cyan curves) and smallest (blue curves) ERPs are significantly different from 0 (a randomized cluster procedure, P ≤ 0.002). Two clusters were identified between −443 and 231 ms for confidence (marked “d” in A), and one cluster was identified between −337 and 109 ms for response time (marked “e” in C). No cluster was found for stimulus level (B). D and E: pre- and post-response-time difference topographies between high and 50% confidence (D) and fastest and slowest response time (E) within the time interval based on the statistics in frontal potential (FP). Pre- and post-response-time clusters are indicated by horizontal bracket. FH: centroparietal ERPs for the 4 levels of confidence (F), stimulus level (G), and response time (H). Two clusters were identified between −193 and 248 ms for confidence (marked “i” in F), and one cluster was identified between −267 and 249 ms for response time (marked “j” in H). No cluster was found for stimulus level (G). I and J: pre- and post-response-time difference topographies between high and 50% confidence (I) and fastest and slowest response time (J) within the time interval based on the statistics in centroparietal potential (CPP).
Fig. 8.
Fig. 8.
Pre-response-time (Pre-RT) and post-response-time (Post-RT) event-related potential components. Response-time-locked frontal potential (FP) area and slopes (gain; A) and centroparietal potential (CPP) area and slopes (gain; B) for confidence (black squares), stimulus (circles), and response-time (gray squares) categories are shown. Pre-response-time components are marked with closed squares accompanied by solid lines, and post-response-time components are marked with open squares accompanied by dotted lines. Lines show the repeated-measures linear mixed-effect model fits, markers show the mean across subjects, and error bars show 95% confidence intervals. Horizontal bars with single asterisk indicate 0.01 < P ≤ 0.05, and double asterisks indicate 0.001 < P ≤ 0.01.

Similar articles

Cited by

References

    1. Audley RJ. A stochastic model for individual choice behavior. Psychol Rev 67: 1–15, 1960. doi:10.1037/h0046438. - DOI - PubMed
    1. Baccini M, Paci M, Del Colletto M, Ravenni M, Baldassi S. The assessment of subjective visual vertical: comparison of two psychophysical paradigms and age-related performance. Atten Percept Psychophys 76: 112–122, 2014. doi:10.3758/s13414-013-0551-9. - DOI - PubMed
    1. Baranski JV, Petrusic WM. Probing the locus of confidence judgments: experiments on the time to determine confidence. J Exp Psychol Hum Percept Perform 24: 929–945, 1998. doi:10.1037/0096-1523.24.3.929. - DOI - PubMed
    1. Boldt A, Yeung N. Shared neural markers of decision confidence and error detection. J Neurosci 35: 3478–3484, 2015. doi:10.1523/JNEUROSCI.0797-14.2015. - DOI - PMC - PubMed
    1. Brainard DH. The Psychophysics Toolbox. Spat Vis 10: 433–436, 1997. doi:10.1163/156856897X00357. - DOI - PubMed

Publication types

LinkOut - more resources