

Longitudinal trajectory patterns of plasma albumin and C-reactive protein levels around diagnosis, relapse, bacteraemia, and death of acute myeloid leukaemia patients
- PMID: 32209087
- PMCID: PMC7092519
- DOI: 10.1186/s12885-020-06754-z
Longitudinal trajectory patterns of plasma albumin and C-reactive protein levels around diagnosis, relapse, bacteraemia, and death of acute myeloid leukaemia patients
Abstract
Background: No study has evaluated C-reactive protein (CRP) and plasma albumin (PA) levels longitudinally in patients with acute myeloid leukaemia (AML).
Methods: We studied defined events in 818 adult patients with AML in relation to 60,209 CRP and PA measures. We investigated correlations between CRP and PA levels and daily CRP and PA levels in relation to AML diagnosis, AML relapse, or bacteraemia (all ±30 days), and death (─30-0 days).
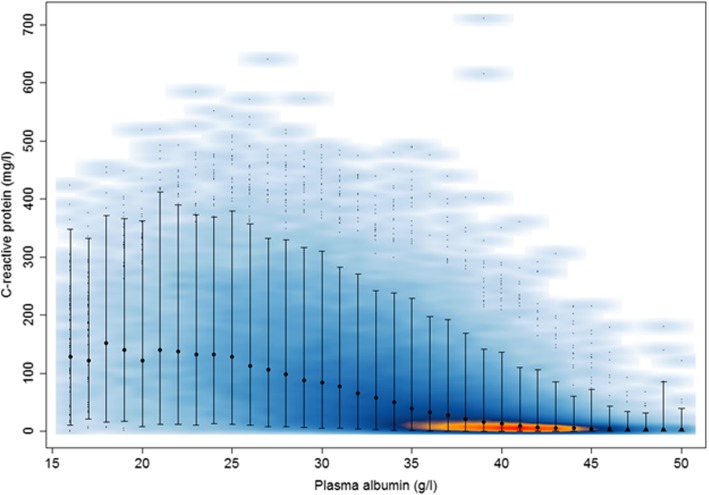
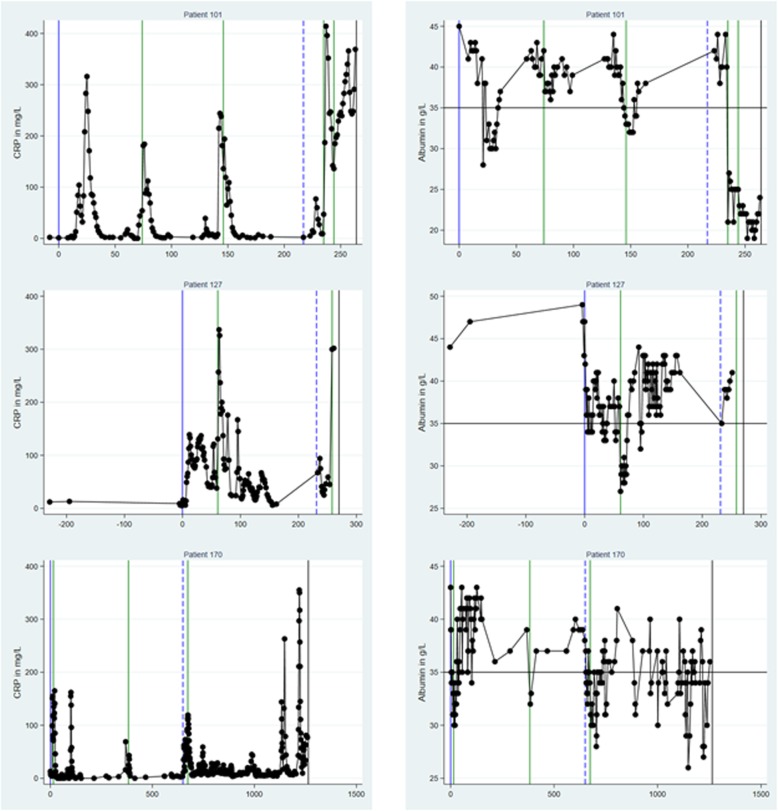
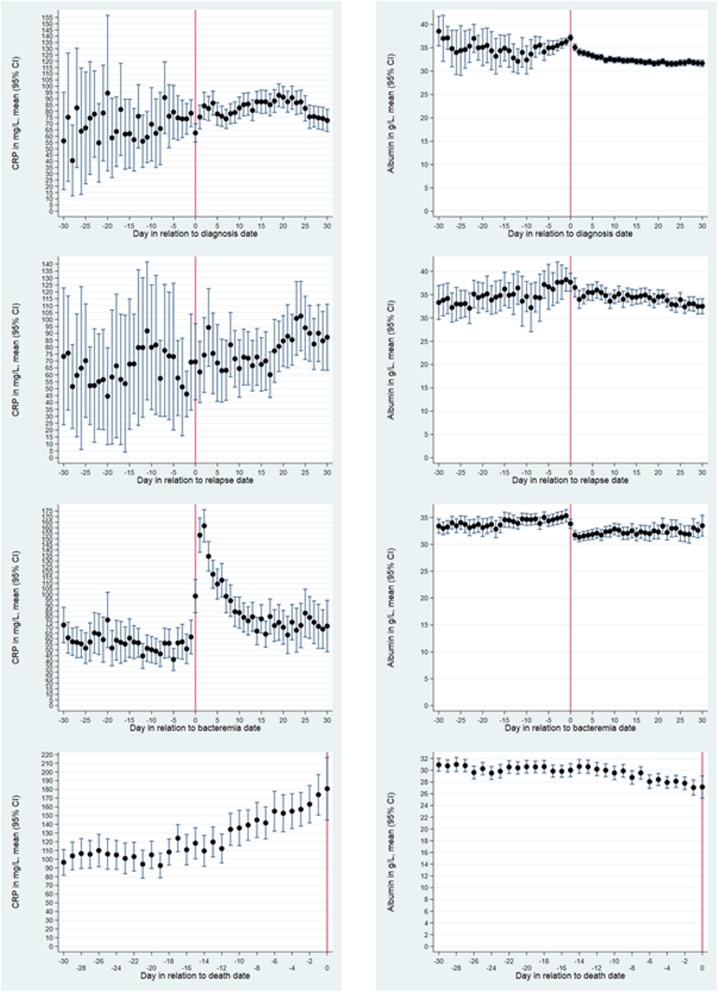
Results: On the AML diagnosis date (D0), CRP levels increased with higher WHO performance score (PS), e.g. patients with PS 3/4 had 68.1 mg/L higher CRP compared to patients with PS 0, adjusted for relevant covariates. On D0, the PA level declined with increasing PS, e.g. PS 3/4 had 7.54 g/L lower adjusted PA compared to PS 0. CRP and PA levels were inversely correlated for the PA interval 25-55 g/L (R = - 0.51, p < 10-5), but not for ≤24 g/L (R = 0.01, p = 0.57). CRP increases and PA decreases were seen prior to bacteraemia and death, whereas no changes occurred up to AML diagnosis or relapse. CRP increases and PA decreases were also found frequently in individuals, unrelated to a pre-specified event.
Conclusions: PA decrease is an important biomarker for imminent bacteraemia in adult patients with AML.
Keywords: Acute myeloid leukaemia; C-reactive protein; Infection; Inflammation; Plasma albumin.
Conflict of interest statement
RBD: Participation in advisory board meeting, Roche Diagnostics 2018 (outside this work). The remaining authors declare that they have no competing interests.
Figures
Similar articles
-
C-reactive protein and albumin kinetics before community-acquired bloodstream infections - a Danish population-based cohort study.Epidemiol Infect. 2020 Feb 26;148:e38. doi: 10.1017/S0950268820000291. Epidemiol Infect. 2020. PMID: 32100658 Free PMC article.
-
Contributing factors to the plasma albumin level at diagnosis of hematological malignancy.Hosp Pract (1995). 2020 Oct;48(4):223-229. doi: 10.1080/21548331.2020.1770511. Epub 2020 Jun 2. Hosp Pract (1995). 2020. PMID: 32484370
-
C-reactive protein and albumin kinetics after antibiotic therapy in community-acquired bloodstream infection.Int J Infect Dis. 2020 Jun;95:50-58. doi: 10.1016/j.ijid.2020.03.063. Epub 2020 Apr 3. Int J Infect Dis. 2020. PMID: 32251802
-
Hypoalbuminaemia as a marker of trans-capillary leakage in community-acquired bacteraemia patients.Epidemiol Infect. 2018 Apr;146(5):648-655. doi: 10.1017/S0950268818000274. Epub 2018 Feb 19. Epidemiol Infect. 2018. PMID: 29457576 Free PMC article.
-
Positive affect and peripheral inflammatory markers among adults: A narrative review.Psychoneuroendocrinology. 2021 Jan;123:104892. doi: 10.1016/j.psyneuen.2020.104892. Epub 2020 Oct 27. Psychoneuroendocrinology. 2021. PMID: 33130406 Free PMC article. Review.
Cited by
-
Geriatric nutritional risk index as a prognostic marker of pTNM-stage I and II esophageal squamous cell carcinoma after curative resection.Oncotarget. 2020 Jul 21;11(29):2834-2846. doi: 10.18632/oncotarget.27670. eCollection 2020 Jul 21. Oncotarget. 2020. PMID: 32754301 Free PMC article.
-
Comparative epidemiology of bacteraemia in two ageing populations: Singapore and Denmark.Epidemiol Infect. 2024 Apr 29;152:e74. doi: 10.1017/S0950268824000645. Epidemiol Infect. 2024. PMID: 38682588 Free PMC article.
-
The trace that is valuable: serum copper and copper to zinc ratio for survival prediction in younger patients with newly diagnosed acute myeloid leukaemia.BMC Cancer. 2023 Jan 5;23(1):14. doi: 10.1186/s12885-022-10486-7. BMC Cancer. 2023. PMID: 36604732 Free PMC article.
-
Impact of C-reactive protein and albumin levels on short, medium, and long term mortality in patients with diffuse large B-cell lymphoma.Ann Med. 2022 Dec;54(1):713-722. doi: 10.1080/07853890.2022.2046287. Ann Med. 2022. PMID: 35238275 Free PMC article.
-
Polymorphisms in the Genes Coding for TLRs, NLRs and RLRs Are Associated with Clinical Parameters of Patients with Acute Myeloid Leukemia.Int J Mol Sci. 2022 Aug 24;23(17):9593. doi: 10.3390/ijms23179593. Int J Mol Sci. 2022. PMID: 36076988 Free PMC article.
References
-
- Estey EH. Acute myeloid leukemia (AML) In: Estey EH, Appelbaum FR, editors. Leukemia and related disorders: integrated treatment approaches. 1. New York: Springer Science+Business Media; 2012. pp. 1–36.
-
- Stosor V, Zembower TR. Infectious complications in Cancer patients. 1. Switzerland: Springer; 2014.
-
- Vincent JL, Beumier M. Diagnostic and prognostic markers in sepsis. Expert Rev Anti-Infect Ther. 2013;11(3):265–275. - PubMed
-
- Wu CW, Wu JY, Chen CK, Huang SL, Hsu SC, Lee MT, et al. Does procalcitonin, C-reactive protein, or interleukin-6 test have a role in the diagnosis of severe infection in patients with febrile neutropenia? A systematic review and meta-analysis. Support Care Cancer. 2015;23(10):2863–2872. - PubMed
MeSH terms
Substances
LinkOut - more resources
Full Text Sources
Medical
Research Materials
Miscellaneous
