

Association between the cytokine storm, immune cell dynamics, and viral replicative capacity in hyperacute HIV infection
- PMID: 32209092
- PMCID: PMC7093991
- DOI: 10.1186/s12916-020-01529-6
Association between the cytokine storm, immune cell dynamics, and viral replicative capacity in hyperacute HIV infection
Abstract
Introduction: Immunological damage in acute HIV infection (AHI) may predispose to detrimental clinical sequela. However, studies on the earliest HIV-induced immunological changes are limited, particularly in sub-Saharan Africa. We assessed the plasma cytokines kinetics, and their associations with virological and immunological parameters, in a well-characterized AHI cohort where participants were diagnosed before peak viremia.
Methods: Blood cytokine levels were measured using Luminex and ELISA assays pre-infection, during the hyperacute infection phase (before or at peak viremia, 1-11 days after the first detection of viremia), after peak viremia (24-32 days), and during the early chronic phase (77-263 days). Gag-protease-driven replicative capacities of the transmitted/founder viruses were determined using a green fluorescent reporter T cell assay. Complete blood counts were determined before and immediately following AHI detection before ART initiation.
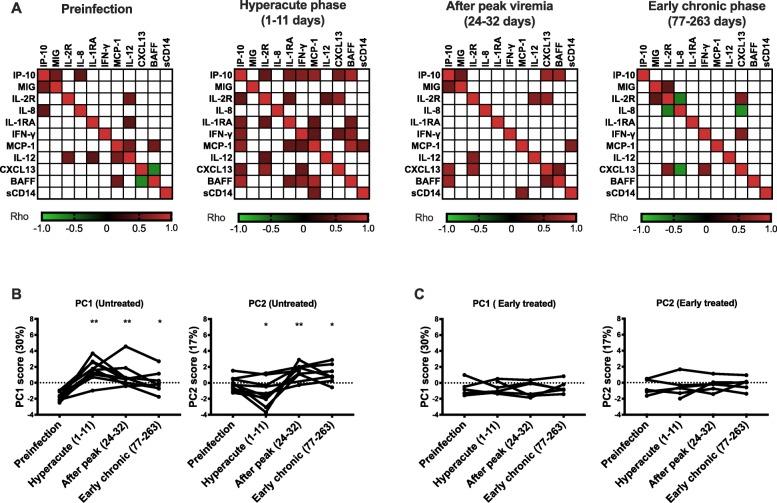
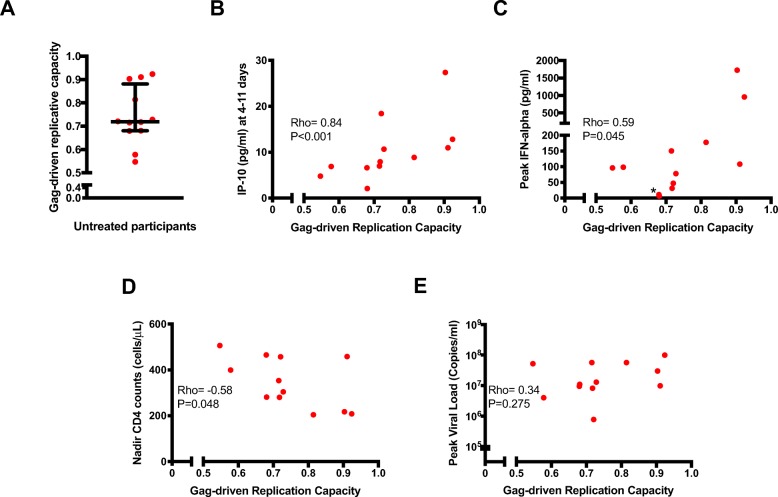
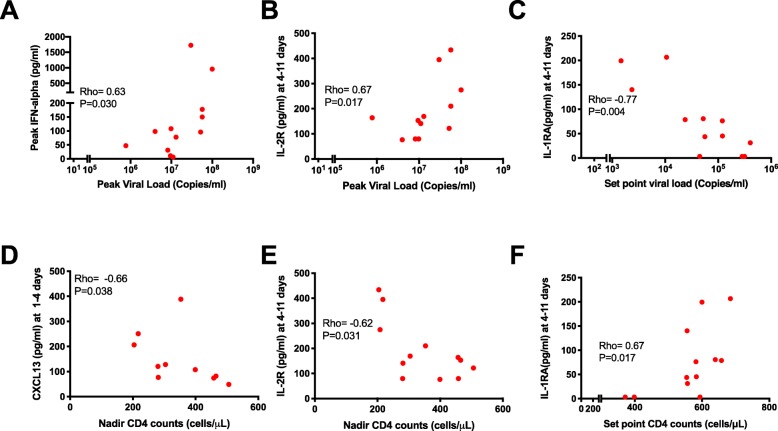
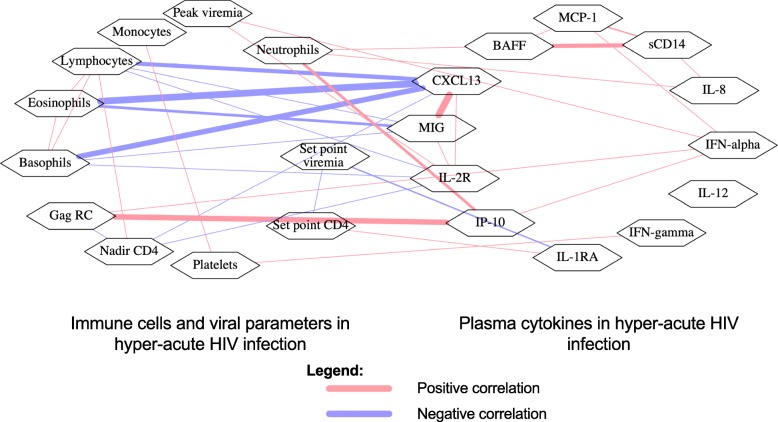
Results: Untreated AHI was associated with a cytokine storm of 12 out of the 33 cytokines analyzed. Initiation of ART during Fiebig stages I-II abrogated the cytokine storm. In untreated AHI, virus replicative capacity correlated positively with IP-10 (rho = 0.84, P < 0.001) and IFN-alpha (rho = 0.59, P = 0.045) and inversely with nadir CD4+ T cell counts (rho = - 0.58, P = 0.048). Hyperacute HIV infection before the initiation of ART was associated with a transient increase in monocytes (P < 0.001), decreased lymphocytes (P = 0.011) and eosinophils (P = 0.003) at Fiebig stages I-II, and decreased eosinophils (P < 0.001) and basophils (P = 0.007) at Fiebig stages III-V. Levels of CXCL13 during the untreated hyperacute phase correlated inversely with blood eosinophils (rho = - 0.89, P < 0.001), basophils (rho = - 0.87, P = 0.001) and lymphocytes (rho = - 0.81, P = 0.005), suggesting their trafficking into tissues. In early treated individuals, time to viral load suppression correlated positively with plasma CXCL13 at the early chronic phase (rho = 0.83, P = 0.042).
Conclusion: While commencement of ART during Fiebig stages I-II of AHI abrogated the HIV-induced cytokine storm, significant depletions of eosinophils, basophils, and lymphocytes, as well as transient expansions of monocytes, were still observed in these individuals in the hyperacute phase before the initiation of ART, suggesting that even ART initiated during the onset of viremia does not abrogate all HIV-induced immune changes.
Keywords: Acute HIV infection; Cytokine storm; Early ART; Replication capacity.
Conflict of interest statement
The authors declare that they have no competing interests.
Figures


Similar articles
-
Antigen Presenting Cells Contribute to Persistent Immune Activation Despite Antiretroviral Therapy Initiation During Hyperacute HIV-1 Infection.Front Immunol. 2021 Sep 24;12:738743. doi: 10.3389/fimmu.2021.738743. eCollection 2021. Front Immunol. 2021. PMID: 34630420 Free PMC article.
-
Viral kinetics in untreated versus treated acute HIV infection in prospective cohort studies in Thailand.J Int AIDS Soc. 2017 Jun 26;20(1):21652. doi: 10.7448/IAS.20.1.21652. J Int AIDS Soc. 2017. PMID: 28691436 Free PMC article.
-
HIV-1 persistence following extremely early initiation of antiretroviral therapy (ART) during acute HIV-1 infection: An observational study.PLoS Med. 2017 Nov 7;14(11):e1002417. doi: 10.1371/journal.pmed.1002417. eCollection 2017 Nov. PLoS Med. 2017. PMID: 29112956 Free PMC article.
-
Molecular biological assessment methods and understanding the course of the HIV infection.APMIS Suppl. 2003;(114):1-37. APMIS Suppl. 2003. PMID: 14626050 Review.
-
Immune activation during acute HIV infection and the impact of early antiretroviral therapy.Curr Opin HIV AIDS. 2016 Mar;11(2):163-72. doi: 10.1097/COH.0000000000000228. Curr Opin HIV AIDS. 2016. PMID: 26599167 Review.
Cited by
-
Darunavir Nanoformulation Suppresses HIV Pathogenesis in Macrophages and Improves Drug Delivery to the Brain in Mice.Pharmaceutics. 2024 Apr 19;16(4):555. doi: 10.3390/pharmaceutics16040555. Pharmaceutics. 2024. PMID: 38675216 Free PMC article.
-
SARS-CoV-2: lessons from both the history of medicine and from the biological behavior of other well-known viruses.Future Microbiol. 2021 Sep;16(14):1105-1133. doi: 10.2217/fmb-2021-0064. Epub 2021 Sep 1. Future Microbiol. 2021. PMID: 34468163 Free PMC article. Review.
-
Dynamics of Transforming Growth Factor (TGF)-β Superfamily Cytokine Induction During HIV-1 Infection Are Distinct From Other Innate Cytokines.Front Immunol. 2020 Nov 24;11:596841. doi: 10.3389/fimmu.2020.596841. eCollection 2020. Front Immunol. 2020. PMID: 33329587 Free PMC article.
-
A human-specific motif facilitates CARD8 inflammasome activation after HIV-1 infection.Elife. 2023 Jul 7;12:e84108. doi: 10.7554/eLife.84108. Elife. 2023. PMID: 37417868 Free PMC article.
-
HIV-1 Gag-protease-driven replicative capacity influences T-cell metabolism, cytokine induction, and viral cell-to-cell spread.mBio. 2025 Apr 9;16(4):e0356524. doi: 10.1128/mbio.03565-24. Epub 2025 Feb 25. mBio. 2025. PMID: 39998252 Free PMC article.
References
-
- Stacey AR, Norris PJ, Qin L, Haygreen EA, Taylor E, Heitman J, Lebedeva M, DeCamp A, Li D, Grove D, et al. Induction of a striking systemic cytokine cascade prior to peak viremia in acute human immunodeficiency virus type 1 infection, in contrast to more modest and delayed responses in acute hepatitis B and C virus infections. J Virol. 2009;83(8):3719–3733. doi: 10.1128/JVI.01844-08. - DOI - PMC - PubMed
-
- Pastor L, Parker E, Carrillo J, Urrea V, Fuente-Soro L, Respeito D, Jairoce C, Mandomando I, Blanco J, Naniche D. A cytokine pattern that differentiates preseroconversion from postseroconversion phases of primary HIV infection. J Acquir Immune Defic Syndr. 2017;74(4):459–466. doi: 10.1097/QAI.0000000000001272. - DOI - PubMed
-
- Pastor L, Casellas A, Ruperez M, Carrillo J, Maculuve S, Jairoce C, Paredes R, Blanco J, Naniche D. Interferon-gamma-inducible protein 10 (IP-10) as a screening tool to optimize human immunodeficiency virus RNA monitoring in resource-limited settings. Clin Infect Dis. 2017;65(10):1670–1675. doi: 10.1093/cid/cix600. - DOI - PMC - PubMed
-
- Muema DM, Macharia GN, Hassan AS, Mwaringa SM, Fegan GW, Berkley JA, Nduati EW, Urban BC. Control of viremia enables acquisition of resting memory B cells with age and normalization of activated B cell phenotypes in HIV-infected children. J Immunol. 2015;195(3):1082–1091. doi: 10.4049/jimmunol.1500491. - DOI - PMC - PubMed
Publication types
MeSH terms
Substances
Grants and funding
LinkOut - more resources
Full Text Sources
Medical
Research Materials
