. 2020 Mar 25:9:e51295.
doi: 10.7554/eLife.51295.

Identification of slit3 as a locus affecting nicotine preference in zebrafish and human smoking behaviour

Affiliations

Identification of slit3 as a locus affecting nicotine preference in zebrafish and human smoking behaviour

Judit García-González et al. Elife. .

Abstract

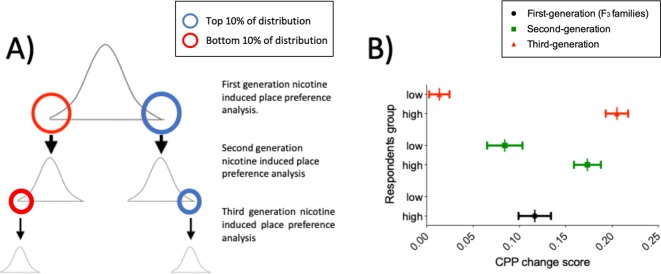
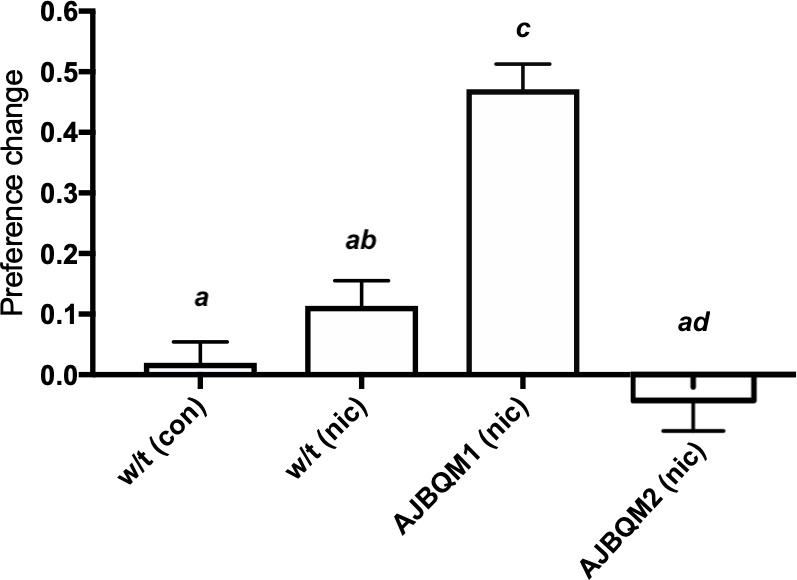
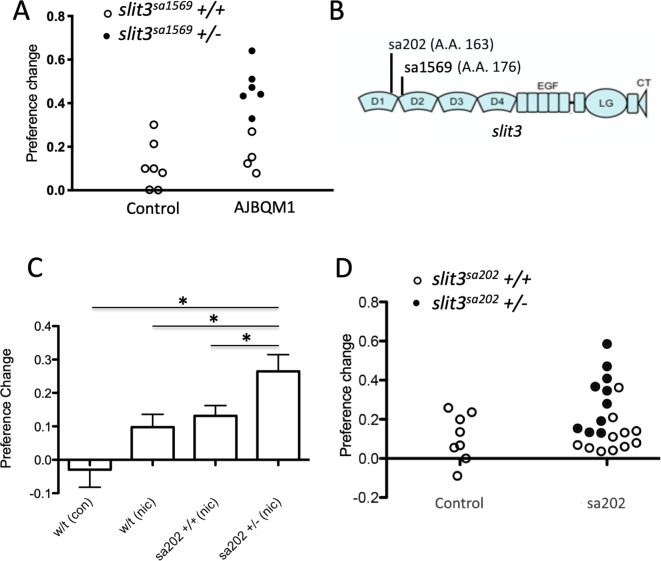
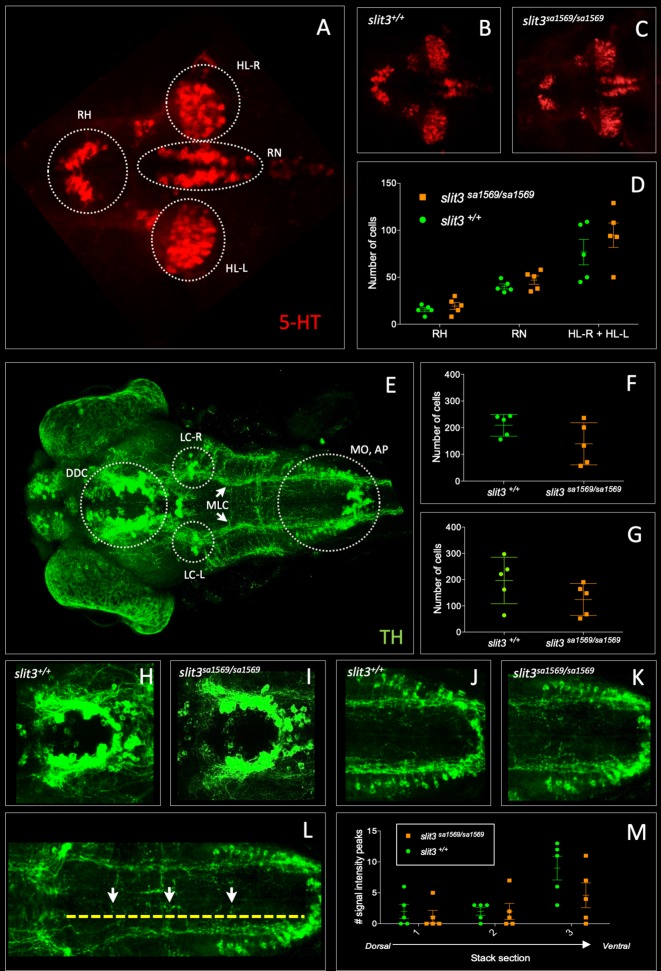
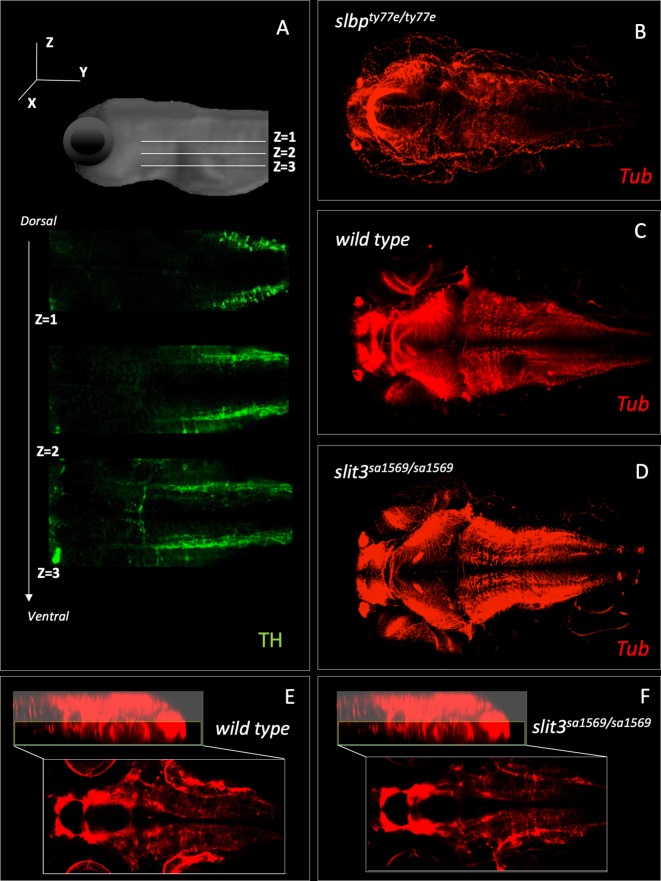
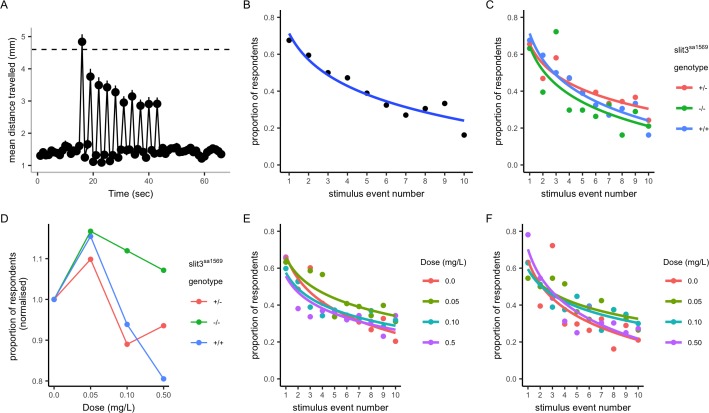
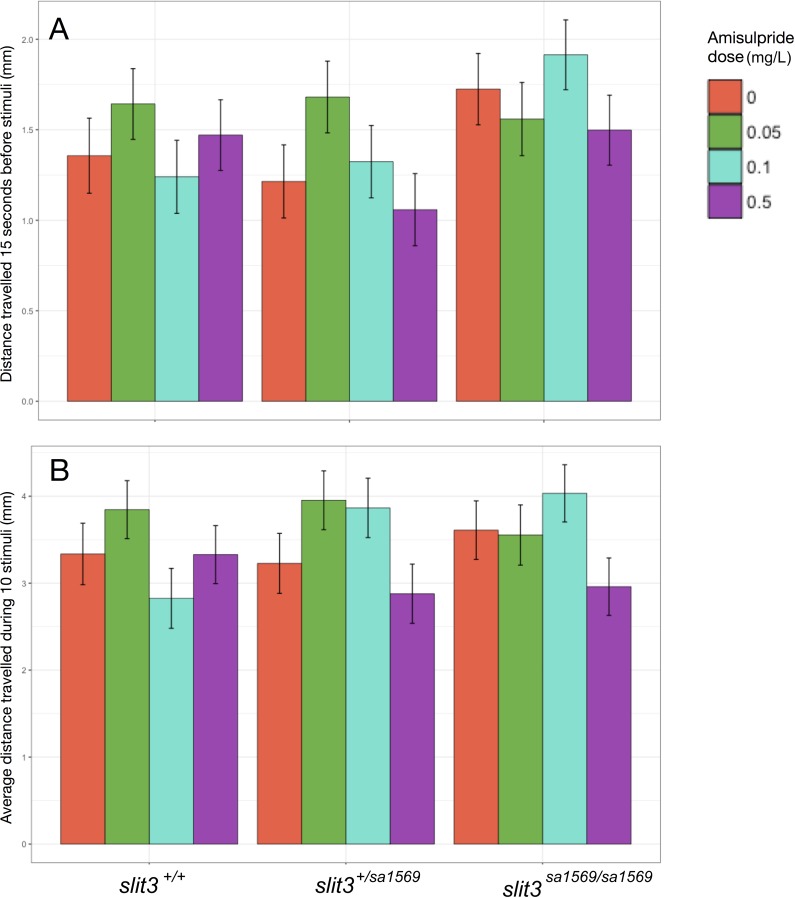
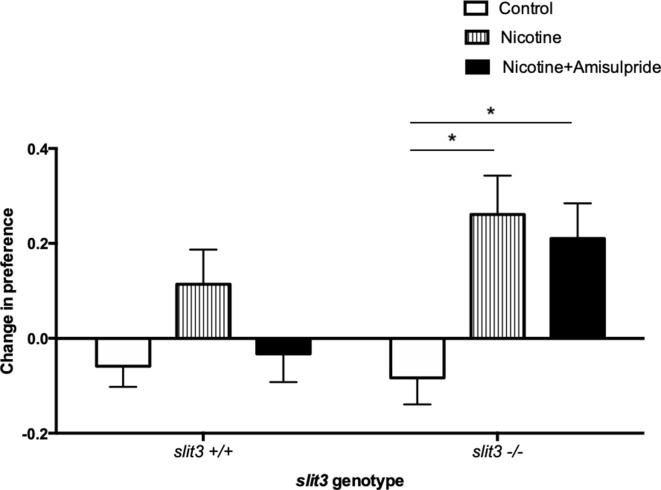
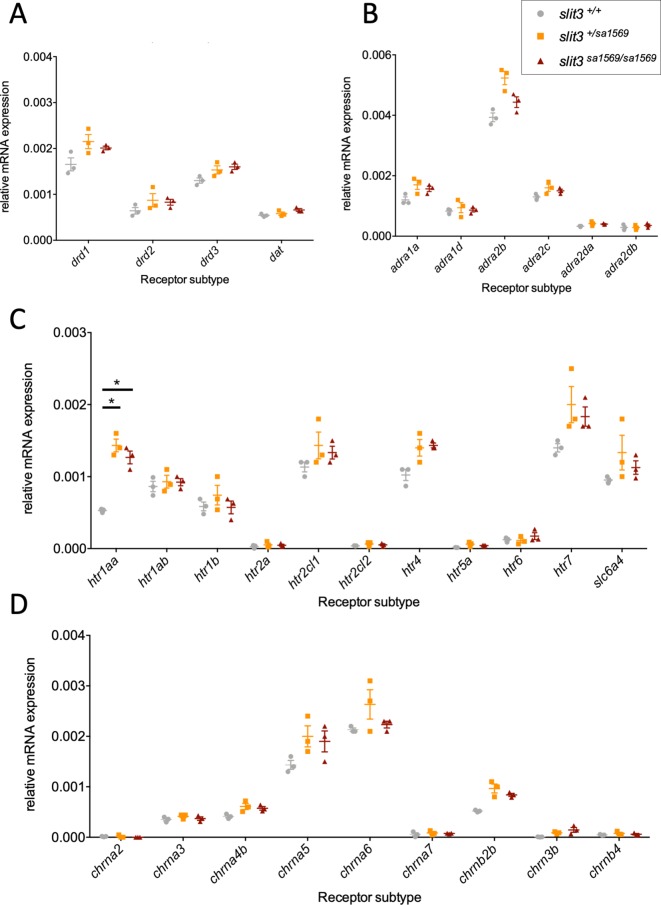
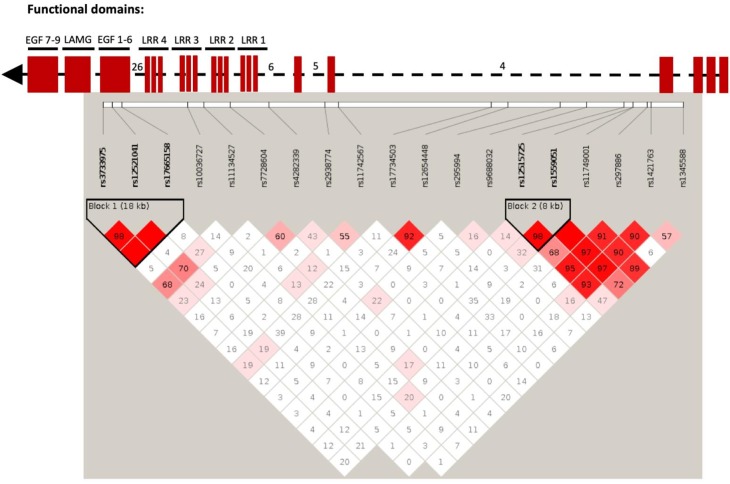
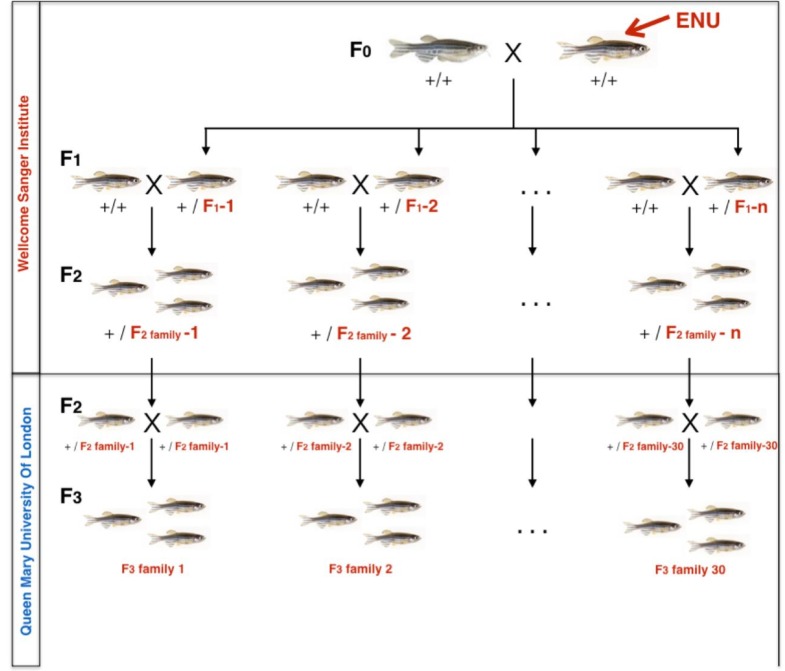
To facilitate smoking genetics research we determined whether a screen of mutagenized zebrafish for nicotine preference could predict loci affecting smoking behaviour. From 30 screened F3 sibling groups, where each was derived from an individual ethyl-nitrosurea mutagenized F0 fish, two showed increased or decreased nicotine preference. Out of 25 inactivating mutations carried by the F3 fish, one in the slit3 gene segregated with increased nicotine preference in heterozygous individuals. Focussed SNP analysis of the human SLIT3 locus in cohorts from UK (n=863) and Finland (n=1715) identified two variants associated with cigarette consumption and likelihood of cessation. Characterisation of slit3 mutant larvae and adult fish revealed decreased sensitivity to the dopaminergic and serotonergic antagonist amisulpride, known to affect startle reflex that is correlated with addiction in humans, and increased htr1aa mRNA expression in mutant larvae. No effect on neuronal pathfinding was detected. These findings reveal a role for SLIT3 in development of pathways affecting responses to nicotine in zebrafish and smoking in humans.

Keywords: acoustic startle; conditioned place preference; gene association; neuroscience; nicotine; slit3; smoking; zebrafish.


Conflict of interest statement

JG, AB, MP, RR, DJ, AS, MT, EB, DS, AM, JK, TP, VK, RW, CB No competing interests declared

Figures

Figure 1.
Figure 1.. 10 μM nicotine induced place preference in zebrafish is sensitive to inhibition by therapeutics effective in humans.
(A) Varenicline (nicotine partial agonist) and (B) Bupropion (norepinephrine and dopamine reuptake inhibitor with nicotine antagonist properties when metabolised). Bars represent mean and error bars represent + SEM. Asterisk (*) represents significance at p<0.05.
Figure 2.
Figure 2.. Nicotine CPP is heritable.
(A) Breeding and selection to assess heritability of nicotine-induced place preference in ENU-mutagenized zebrafish. To test whether nicotine preference is heritable, fish in the upper (blue circle) and lower (red circle) 10% of the change in preference distribution curve were inbred and screened for CPP (Second generation CPP assay). A similar approach was used for the third generation CPP assay. (B) CPP for nicotine is heritable. Mean preference change is increasingly distinct for the second and third generation CPP analysis. Plot represents mean and ± SEM. First generation (corresponding to the F3 families used for the screen) (n = 120): mean = 0.11; SD = 0.17. Second generation: Offspring of fish from upper 10% of the first generation screen (n = 92): mean = 0.17; SD = 0.14. Offspring of fish from lower 10% of the first generation screen (n = 64): mean = 0.08; SD = 0.15. Third generation. Offspring of fish from upper 10% of the second generation screen (n = 69): mean = 0.21; SD = 0.10. Offspring of fish from lower 10% of the second generation screen (n = 67): mean = 0.01; SD = 0.09.
Figure 3.
Figure 3.. AJBQM1 and AJBQM2 families show increased and decreased nicotine place preference.
AJBQM1 and AJBQM2 siblings, not included in the screen (n = 10 for AJBQM1; n = 14 for AJBQM2), AJBQM1 significantly differed from the parental strain, Tupfel longfin (TLF) wild type (w/t) saline control (n = 17) and wild type nicotine exposed fish (n = 7). AJBQM2 differed from wild type nicotine exposed fish but not wild type saline controls. Different superscript letters indicate significant difference between groups (p<0.05), same superscript letters indicate no significant differences between groups. Bars indicate Mean + SEM.
Figure 4.
Figure 4.. slit3 mutations segregate with nicotine place preference.
(A) Segregation of slit3sa1569 mutation with nicotine seeking. CPP change scores for individual un-mutagenized TLF wild type fish (n = 7) and AJBQM1 fish (n = 10). Following CPP analysis, fish were genotyped for 25 loss of function mutations contained within the family. Black dots indicate slit3sa1569/+ heterozygous mutant fish. White dots indicate slit3sa1569+/+ fish. Heterozygosity for slit3sa1569 segregates with increased nicotine seeking behaviour. (B) Position of ENU-induced mutations in zebrafish Slit3 protein. slit3sa1569 (A > G transition) disrupts a splice site in intron seven affecting translation at amino acid 176. slit3sa202 (G > T transversion) introduces a stop codon at amino acid 163. Both mutations truncate the protein before the leucine rich repeat domain 2 (D2), which interacts with membrane bound ROBO during SLIT-ROBO signalling. (C) Nicotine preference of slit3sa202 line. slit3sa202/+ fish (n = 18) show increased nicotine preference compared to wild type TLF controls (n = 8) (p=0.001) and wild type siblings slit3+/+ (n = 14) (p<0.05). Bars indicate mean + SEM. (D) Segregation of slit3sa202 allele with nicotine seeking. CPP change scores for individual un-mutagenised TLF wild type parent strain fish (n = 8) and slit3sa202 fish (n = 21). Black dots indicate slit3sa202/+ heterozygous mutant fish, white dots indicate slit3sa202+/+ fish. Mutations in slit3sa202 co-segregate with nicotine preference. Heterozygous slit3+/sa202 present increased place preference compared to slit3sa202+/+ siblings (n = 11).
Figure 5.
Figure 5.. Fluorescent immunohistochemistry in three-day old wild type slit3sa1569+/+ and homozygous mutant slit3sa1569/sa1569.
(A–D) Anti-5-HT, (E–M) anti-TH: (A) 5-HT-labelled neurons in wild type zebrafish brain. Circles indicate regions used for quantification of cell number in rostral hypothalamus (RH), inferior hypothalamic lobes (HL-R, HL-L) and raphe nucleus (RN). (B) Anti-5-HT labelled cells in slit3 wild type brain, (C) Anti-5-HT labelled cells in slit3sa1569 homozygous mutant brain. (D) Quantification of anti-5HT labelled cell number in wild type and slit3 mutant brains No significant differences were observed between wild type and slit3 mutant larvae. (E) Unprocessed maximum intensity projection of anti-TH-labelled whole mounted wild type zebrafish brain. Circles indicate areas used for quantification, or in the case of LC-R and LC-L, landmarks used as reference to determine the extension of the medial longitudinal catecholaminergic tract (MLC) used when quantifying the number of anti-TH labelled projections to the midline (panels L, M). (F) Cell quantification for diencephalic dopaminergic cluster (DDC). No significant differences were observed between wild type and slit3 mutant larvae. (G) Cell quantification for medulla oblongata interfascicular zone and vagal area, and area postrema (MO, AP). No significant differences were observed between wild type and slit3 mutant larvae. (H–K) Anti-TH labelled wild types and slit3sa1569. Zoomed-in visualization of diencephalic dopaminergic cluster (H–I) and medulla oblongata interfascicular zone and vagal area (J–K). (L–M) Quantification of catecholaminergic projections projecting to the midline. Examples of projections are indicated with yellow arrows. Projections were assessed from posterior to anterior using the locus coerulus and posterior extent of the raphe nucleus as landmarks (Panel L, yellow line) and from dorsal to ventral (Panel M, stacks 1–3). Figure 5—figure supplement 1 shows individual planes. n = 5 samples per genotype group.
Figure 5—figure supplement 1.
Figure 5—figure supplement 1.. Fluorescent immunohistochemistry in three-day old wild type and homozygous mutant slit3sa1569 labelled with tyrosine hydroxylase (A) and tubulin (B–F).
(A) Example of three Z-planes used to quantify catecholaminergic projections crossing the midline. (Stacks 1–3). (B) Anti-tubulin staining of slbpty77e/ty77e mutant larvae, known to have fewer neurons and axonal defects (Turner et al., 2019). (C–D) Anti-tubulin staining of wild type and homozygous mutant slit3sa1569. (E–F) Zoom-in of C-D for midline in the ventral forebrain, where slit3 is known to be expressed (Miyasaka et al., 2005).
Figure 6.
Figure 6.. Habituation response in the presence and absence of amisulpride.
(A–B) Response and habituation to 10 stimuli with two seconds interval between stimuli in wild type, drug free zebrafish. Mean distances travelled were measured in one second time bins. Line indicates 4.6 mm, which corresponds to mean basal distance moved per second plus 2 standard deviations of the mean and was used to define respondents. The percentage of fish responding to the stimuli decreases with stimulus/tap number (Main effects of tap number p<0.05) 68% respond to the first tap; 16% respond to the last tap. Respondents are defined as fish moving more than 4.6 mm. (C) Proportion of responders across the ten stimuli in drug free individuals from each genotype: there was no significant effect of genotype on response across taps (p=0.34) or responsiveness (p=0.35) in drug free fish. (D) Mean percentage of responders across the ten stimuli (± SEM). Data are stratified by slit3sa1569 genotype and amisulpride dose normalised to response in absence of drug. The effect of amisulpride on habituation varies by genotype. (E, F) Proportion of individuals responding in each amisulpride dose condition in wild type and homozygous mutant fish, respectively. The interaction between amisulpride dose and stimulus event number had a significant effect on the proportion of responsive individuals in wild type individuals (p<0.05) but not homozygous mutants (p=0.16).
Figure 6—figure supplement 1.
Figure 6—figure supplement 1.. Average distance moved before (Figure 1A) and during startle stimuli (Figure 1B) in wild type and slit3sa1569 mutant five-day-old zebrafish larvae.
(A) Basal distance moved as function of amisulpride dose and slit3 genotype. The effect of dose and genotype and their interaction was tested in a linear mixed model. Timepoint, well where the fish were placed and plate were also included as fixed factors and the fish ID as random factor. (B) Distance moved during taps as function of amisulpride dose and slit3 genotype. Dose and genotype and their interaction were examined in a linear mixed model including stimulus number, well, plate used and distance moved before stimuli as fixed factors and Fish ID as random factor. Zebrafish larvae did not differ in the distance travelled before or during startle stimuli as a function of amisulpride dose nor genotype (p>0.05). Bars represent estimated marginal means ± SEM (n = 42–48 fish per group).
Figure 7.
Figure 7.. CPP induced by 5 μM nicotine is blocked by 0.5 mg/L dopamine/serotonin antagonist amisulpride in wild type slit3sa1569+/+ fish but not in slit3sa1569 homozygous mutants.
Bars represent mean (+ SEM). (n = 11–14 fish per group). *Two-way ANOVA followed by post-hoc Tukey tests (p<0.05).
Figure 8.
Figure 8.. Quantitative real-time PCR analysis of five-day-old wild type slit3sa1569+/+, slit3sa1569/+ heterozygous and slit3sa1569/sa1569 homozygous mutant larvae.
Quantitative PCR analysis of gene expression was performed for members of (A) dopaminergic signalling pathway, (B) adrenoreceptors, (C) serotonin signalling pathway and (D) nicotinic cholinergic receptors. (Total n=30, 3 samples per experimental group with n=10 embryos per sample). Only htr1aa ([F(2,6)=44], p=0.0003) showed a significant difference across genotypes after correcting for multiple testing. *Two-way ANOVA followed by post-hoc Tukey test (p < 0.05).
Figure 9.
Figure 9.. Linkage disequilibrium (LD) plot of SLIT3 SNPs in human smoking association analysis.
Numbers within each square indicate D’ values (white: D’<1, LOD <2; blue: D’=1, LOD <2; pink: D’<1, LOD ≥2; and bright red: D’=1, LOD ≥2). Top part of the figure shows domain organization of the SLIT protein based on the UCSC Genome Browser (http://genome.ucsc.edu/) in relation to the SNP location. LRR: leucin-rich repeats. EGF: epidermal growth factor domains. LamG; Laminin G domain. Some intron numbers were added for reference.
Figure 10.
Figure 10.. Zebrafish breeding scheme to generate F3 families.
F2 ENU-mutagenized zebrafish, heterozygous for multiple mutations across the entire genome were obtained from the Wellcome Sanger Institute as part of the Zebrafish Mutation Project. At QMUL, heterozygous F2 fish were incrossed to generate 30 F3 families, each containing 10–20 nonsense or essential splice site mutations and about 1500 additional exonic and intronic point mutations. F3 Families were arbitrarily numbered 1–30. Expected mutation rate and type of mutations in coding regions are specified on the right hand side.

Similar articles

Cited by

References

    1. Ackerman KM, Nakkula R, Zirger JM, Beattie CE, Boyd RT. Cloning and spatiotemporal expression of zebrafish neuronal nicotinic acetylcholine receptor alpha 6 and alpha 4 subunit RNAs. Developmental Dynamics. 2009;238:980–992. doi: 10.1002/dvdy.21912. - DOI - PMC - PubMed
    1. Ackerman KM, Boyd RT. Nicotinic Acetylcholine Receptor Technologies. New York: Springer; 2016. Analysis of Nicotinic Acetylcholine Receptor (nAChR) Gene Expression in Zebrafish (Danio rerio) by In Situ Hybridization and PCR; pp. 1–31. - DOI
    1. Bantick RA, Deakin JF, Grasby PM. The 5-HT1A receptor in schizophrenia: a promising target for novel atypical neuroleptics? Journal of Psychopharmacology. 2001;15:37–46. doi: 10.1177/026988110101500108. - DOI - PubMed
    1. Batra V, Patkar AA, Berrettini WH, Weinstein SP, Leone FT. The Genetic Determinants of Smoking. Chest. 2003;123:1730–1739. doi: 10.1378/chest.123.5.1730. - DOI - PubMed
    1. Beaulieu JM, Gainetdinov RR. The physiology, signaling, and pharmacology of dopamine receptors. Pharmacological Reviews. 2011;63:182–217. doi: 10.1124/pr.110.002642. - DOI - PubMed

Publication types