. 2020 Mar 25:9:e52786.
doi: 10.7554/eLife.52786.

Building customizable auto-luminescent luciferase-based reporters in plants

Affiliations

Building customizable auto-luminescent luciferase-based reporters in plants

Arjun Khakhar et al. Elife. .

Erratum in

Abstract

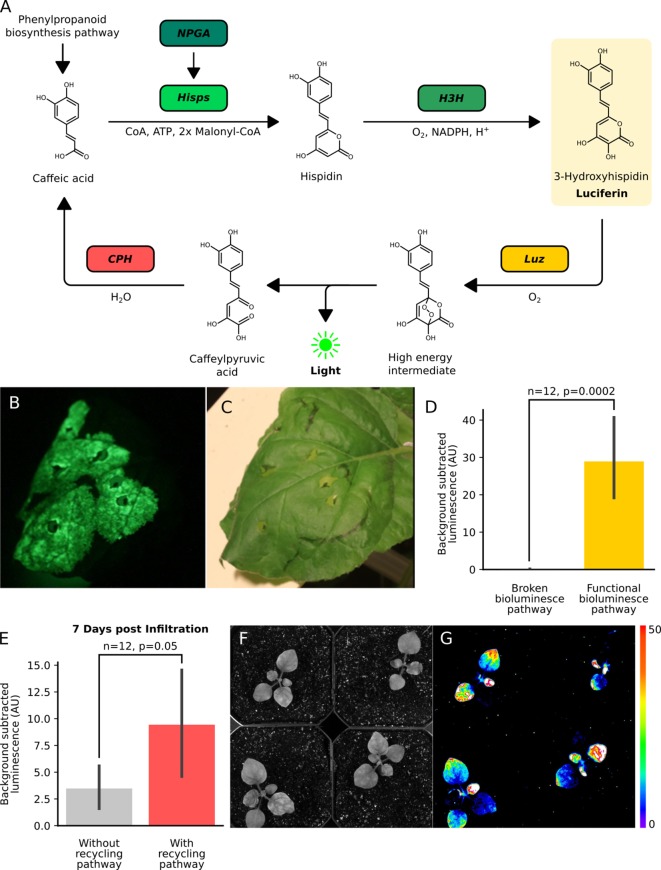
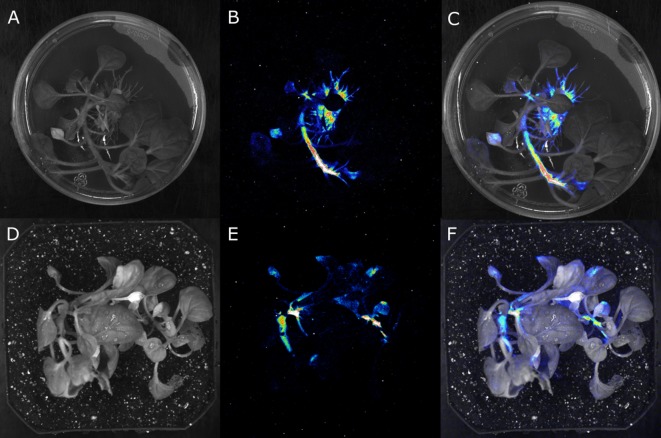
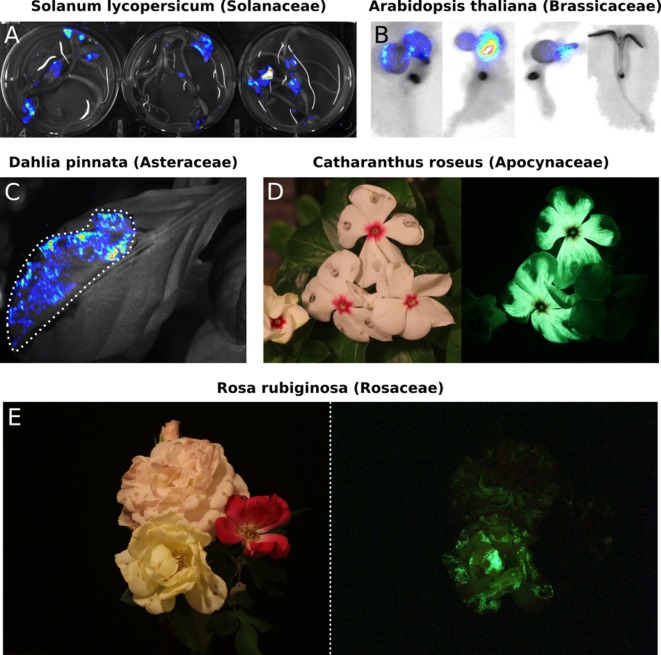
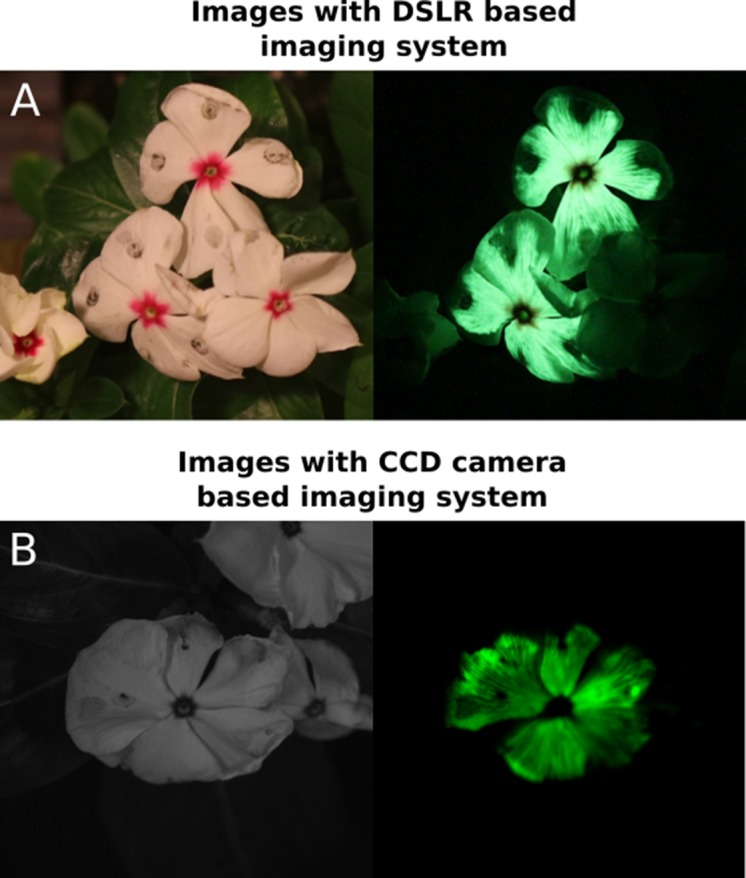
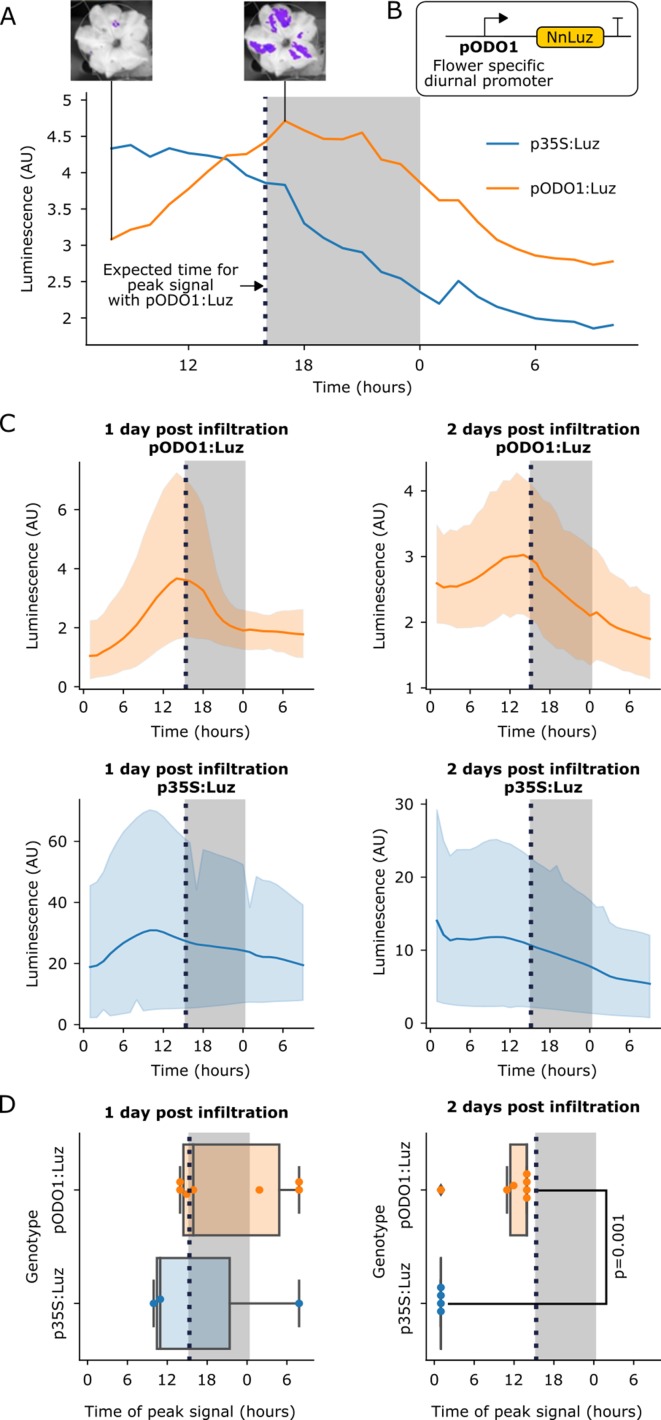
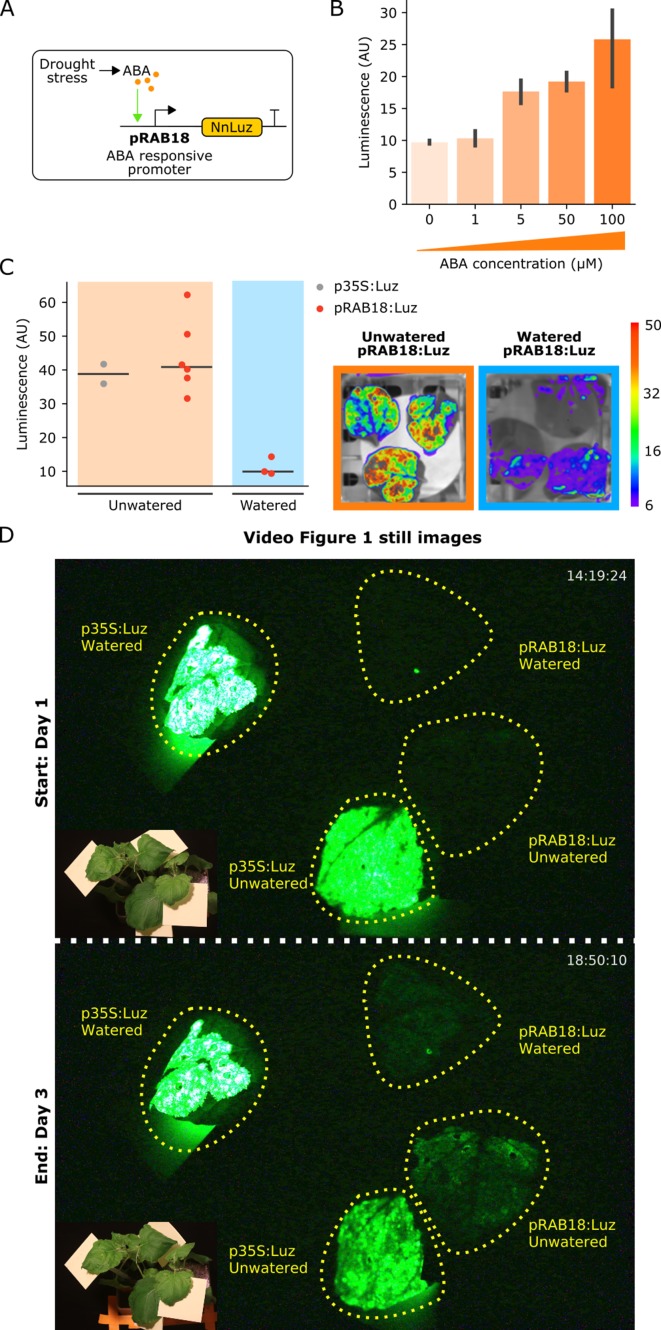
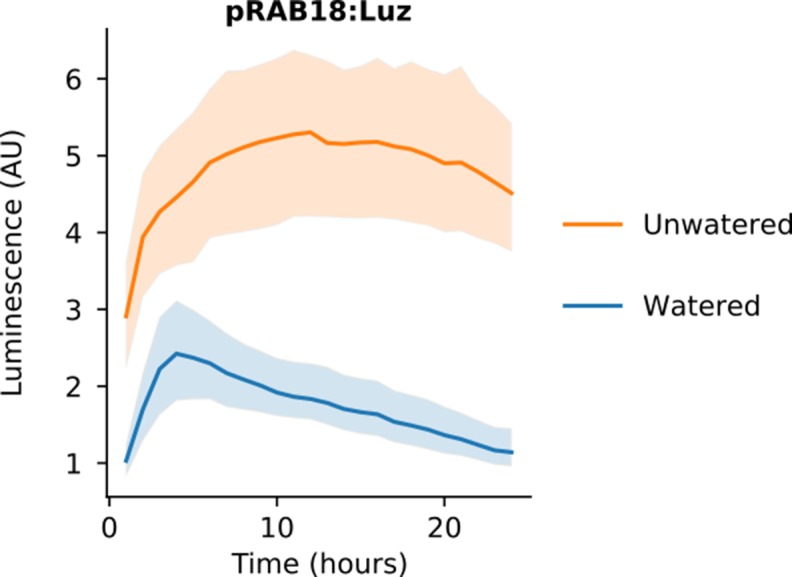
Bioluminescence is a powerful biological signal that scientists have repurposed as a reporter for gene expression in plants and animals. However, there are downsides associated with the need to provide a substrate to these reporters, including its high cost and non-uniform tissue penetration. In this work we reconstitute a fungal bioluminescence pathway (FBP) in planta using a composable toolbox of parts. We demonstrate that the FBP can create luminescence across various tissues in a broad range of plants without external substrate addition. We also show how our toolbox can be used to deploy the FBP in planta to build auto-luminescent reporters for the study of gene-expression and hormone fluxes. A low-cost imaging platform for gene expression profiling is also described. These experiments lay the groundwork for future construction of programmable auto-luminescent plant traits, such as light driven plant-pollinator interactions or light emitting plant-based sensors.

Keywords: A. thaliana; Nicotiana benthamiana; bioluminescence; expression reporter; hormone reporters; luciferase; plant biology; plant synthetic biology.

Plain language summary

Many animals have evolved the capacity to produce light from chemical reactions. For example, an enzyme known as luciferase in fireflies produces light by acting on a molecule called luciferin. Scientists have identified the enzymes that drive several of these systems and used them to build reporters that can study the activity of genes in the tissues of plants and other lifeforms over space and time. However, these reporters often require chemicals to be added to the tissues to produce light. These chemicals tend to be expensive and may not penetrate evenly into the tissues of interest, limiting the potential applications of the reporters in research studies. Recently, it has been discovered that fungi have a bioluminescence pathway that converts a molecule known as caffeic acid into luciferin. Caffeic acid is a common molecule in plants, therefore, it is possible the fungal bioluminescence pathway could be used to build reporters that produce light without needing the addition of chemicals. Now, Khakhar et al. have inserted the genes that encode the enzymes of the fungal bioluminescence pathway into tobacco plants. The experiments found that this was sufficient to turn caffeic acid into molecules of luciferin which are able to produce light. Inserting the same genes into several other plant species, including tomatoes and dahlias, produced similar results. Further experiments showed that the fungal bioluminescence pathway can be used to build reporters that monitor the activity of plant genes throughout living tissues and over a period of several days as well as examine the response to plant hormones. Alongside studying the activities of genes in plants, Khakhar et al. propose that the toolkit developed in this work could be used to generate plants with luminescence that can be switched on or off as desired. This could have many uses including helping plants attract insects to pollinate flowers and building plant biosensors that emit light in response to environmental signals.


Conflict of interest statement

AK, CS, JC, NL, SS, CW, RS, FR, TI, DV No competing interests declared

Figures

Figure 1.
Figure 1.. The fungal bioluminescence pathway creates auto-luminescence when transiently or stably expressed.
(A) Schematic of the chemical reactions driving the generation of auto-luminescence in planta. Caffeic acid produced by the phenylpropanoid biosynthesis pathway is converted to Hispidin by Hisps once it is post-translationally activated by NPGA. Hispidin is then converted to 3-Hydroxyhispidin, the luciferin molecule, by H3H. Finally, the luciferase Luz oxidizes 3-Hydroxyhispidin to a high energy intermediate which degrades into Caffeylpyruvic acid, producing light. CPH can turn Caffeylpyruvic acid back into Caffeic acid, closing the cycle. (B) An image in the dark with an eight minute exposure of a N. benthamiana leaf infiltrated with the FBP demonstrating auto-luminescence in the infiltrated zone. (C) An image in the light of the same leaf with the infiltrated zone marked with a black outline. (D) Bar plots representing background subtracted luminescence from N. benthamiana leaves infiltrated with either a functional FBP (yellow) or a broken control (gray) missing the luciferase, Luz, three days after infiltration (n = 12, p=0.0002 based on a T-test). Black bars represent standard deviation. (E) Bar plots representing background subtracted luminescence seven days after infiltration from N. benthamiana leaves infiltrated with FBPs that either have (pink) or do not have (gray) the CPH-based recycling pathway (n = 12, p=0.05 based on a T-test). Black bars represent standard deviation. (F, G) Bright field image (F) and luminescence signal (G) captured with a CCD camera of transgenic N. benthamiana plants with a stable integration of the FBP (FBP-6) into the genome. Warmer colors correspond to higher luminescence in accordance with the lookup table.
Figure 1—figure supplement 1.
Figure 1—figure supplement 1.. Characterization of luminescence from transient expression of different FBP pathway variants.
(A) Box plots summarizing luminescence recorded from N. benthamiana leaves infiltrated with FBPs three days after infiltration. Each dot represents a reading from a different infiltrated leaf. The bars labeled agro are readings from confluent cultures of agrobacterium strains used to deliver the respective FBP. Pathway two is a functional pathway without CPH and pathway six is a functional pathway with CPH. Pathways 8,10 and 11 are all negative controls missing pathway enzymes. (B) Schematics of the expression cassettes assembled for each of the pathways characterized.
Figure 1—figure supplement 2.
Figure 1—figure supplement 2.. Inclusion of a caffeic acid recycling pathway in the FBP prolongs luminescence signal.
Box plots representing luminescence from N. benthamiana leaves infiltrated an FBP that either with (blue) or without (gray) the CPH-based recycling pathway. Each dot represents a reading from a different infiltrated leaf. Data is from four days and seven days after infiltration.
Figure 1—figure supplement 3.
Figure 1—figure supplement 3.. Co-expression of the Caffeic acid biosynthesis pathway with the FBP increases luminescence signal.
(A) A schematic of the three enzyme pathway built and transiently expressed in an FBP6 stable transgenic line to enable biosynthesis of Caffeic acid from tyrosine. (B) Bar plots summarizing luminescence data from leaves of a transgenic line of N. benthamiana stably expressing FBP6 and infiltrated with agrobacterium to deliver either the caffeic acid biosynthesis pathway, or a control T-DNA. Each plot represents data collected from an independent biological replicate, where one side of the leaf was infiltrated with the caffeic acid pathway and the other was infiltrated with the control. The black bars represent standard deviation and the dots represent technical replicates. All p values were calculated using a T-test.
Figure 1—figure supplement 4.
Figure 1—figure supplement 4.. Stable integration of the FBP into the genome results in the creation of auto-luminescent plants.
(A–F) Luminescence signal captured with a CCD camera (B,E), a bright field image of the same plant (A,D), and the two superimposed on each other (C,F), of a transgenic N. benthamiana plant with a stably integrated FBP on rooting media (A,B,C) and in soil (D,E,F). Warmer colors correspond to higher luminescence.
Figure 2.
Figure 2.. Transient expression of the FBP can generate auto-luminescence in a range of plant species.
(A) Luminescence signal superimposed on a bright field image of Solanum lycopersium (tomato) seedlings with an FBP delivered via the AgroBEST protocol. Warmer colors correspond to higher luminescence signal. (B) Luminescence signal superimposed on bright field images of Arabidopsis thaliana seedlings with a functional FBP (left three seedlings) or a broken FBP (right most seedling) delivered via the AgroBEST protocol. Warmer colors correspond to higher luminescence signal. (C) Luminescence signal superimposed on a bright field image of a Dahlia pinnata leaf infiltrated with an FBP. (D) Lit (left) and unlit, long exposure (right) true color images of Catharanthus roseus flowers infiltrated with an FBP. (E) Lit (left) and unlit, long exposure (right) true color images of Rosa rubiginosa flowers infiltrated with an FBP.
Figure 2—figure supplement 1.
Figure 2—figure supplement 1.. DSLR-based imaging produces comparable images of FBP luminescence to CCD-based imaging systems.
Petal infiltrations of C. roseus flowers with an FBP imaged three days post infiltration with either our DSLR-based imaging system (A) or a CCD based imaging system (B).
Figure 3.
Figure 3.. The FBP can be used to build reporters of the spatio-temporal patterns of gene expression.
(A) A representative example of time course luminescence data from long day entrained P. hybrida flowers infiltrated with FBPs. The orange line represents FBP with Luz driven by the ODO1 promoter from Petunia and the blue line represents the mean luminescence signal of an FBP with Luz driven by the 35S promoter. The gray background represents the night period. The dashed black line highlights where we expect to see the peak expression from the ODO1 promoter. Representative images of petunia flowers infiltrated with the pODO1:Luz at minimum and maximum bioluminescence are also shown, where luminescence signal is overlaid on the bright field image. (B) A schematic of the Luz expression cassette being driven by flower specific diurnal promoter of the petunia gene, ODO1, which is expected to have peak expression at the day to night transition. (C) Time course luminescence data from long day entrained P. hybrida flowers that were infiltrated with an FBP with Luz driven by the ODO1 promoter, 1 and 2 days post infiltration (n = 7 for both) is shown in orange. The time course luminescence data from controls imaged in parallel that were infiltrated with an FBP with Luz driven by the 35S promoter, 1 (n = 4) and 2 (n = 3) days post infiltration is also shown, in blue. The solid lines are mean luminescence and light outlines represent standard deviation. Time (hours) shows Zeitgeber time (time after the light onset at 9AM). The gray background represents the night period. The dashed black line highlights where we expect to see the peak expression from the ODO1 promoter. (D) Box plots summarizing when we observe peak luminescence signal in the time course luminescence data shown in C. Each dot represents an independent biological replicate of a flower infiltrated with a pathway that contains either pODO1:Luz (orange) or p35S:Luz (blue). The gray background represents the night period. The dashed black line highlights where we expect to see the peak expression from the ODO1 promoter. The reported p value was calculated based on a t-test.
Figure 4.
Figure 4.. The FBP can be used to build reporters of hormone signaling dynamics in planta.
(A) Schematic of the Luz expression cassette driven by the ABA-responsive AtRAB18 promoter. (B) Bar plots summarizing mean luminescence signal observed from N. benthamaina leaves co-infiltrated with the pRAB18:Luz FBP variant along with increasing concentrations of the hormone ABA and then imaged after three days. Black bars represent standard deviation (n = 3). (C) Luminescence signal observed from N. benthamaina leaves infiltrated with an FBP and then either kept moist (blue background) or allowed to desiccate to trigger an ABA signal (orange background). Gray and red dots represent data from independent leaves infiltrated with FBP with a 35S or pRAB18 driven Luz respectively. Representative images of watered and un-watered leaves infiltrated with the pRAB18:Luz FBP with luminescence signal overlaid on a bright field picture. Warmer colors represent higher signals. (D) Still images from the start and end of Video Figure 1, where one leaf each on two N. benthamiana plants were agro-infiltrated with FBPs that had either a 35S or pRAB18 driven Luz. One plant was allowed to desiccate (bottom two leaves labeled unwatered) while the other was kept watered (top two leaves labeled watered). The infiltrated leaves are highlighted with a dashed yellow line. A paired bright field image is inset in corner of each image.
Figure 4—figure supplement 1.
Figure 4—figure supplement 1.. An FBP with pRAB18 driving Luz expression shows increased luminescence in unwatered conditions.
Time course luminescence data from N. benthamiana leaves infiltrated with a pRAB18:Luz FBP variant either kept moist (n = 3, blue) or allowed to dry out (n = 6, orange). The solid lines are mean luminescence and light outlines represent standard deviation.

Comment in

References

    1. Čermák T, Curtin SJ, Gil-Humanes J, Čegan R, Kono TJY, Konečná E, Belanto JJ, Starker CG, Mathre JW, Greenstein RL, Voytas DF. A multipurpose toolkit to enable advanced genome engineering in plants. The Plant Cell. 2017;29:1196–1217. doi: 10.1105/tpc.16.00922. - DOI - PMC - PubMed
    1. Chamness JC. Programmable Plant Photography Platform. eda3ce8GitHub. 2020 https://github.com/craftyKraken/P4
    1. Davin LB, Lewis NG. Phenolic Metabolism in Plants. Boston: Springer; 1992. Phenylpropanoid metabolism: biosynthesis of monolignols, lignans and neolignans, lignins and suberins; pp. 325–375. - DOI
    1. Engler C, Youles M, Gruetzner R, Ehnert TM, Werner S, Jones JD, Patron NJ, Marillonnet S. A golden gate modular cloning toolbox for plants. ACS Synthetic Biology. 2014;3:839–843. doi: 10.1021/sb4001504. - DOI - PubMed
    1. Fenske MP, Hewett Hazelton KD, Hempton AK, Shim JS, Yamamoto BM, Riffell JA, Imaizumi T. Circadian clock gene LATE ELONGATED HYPOCOTYL directly regulates the timing of floral scent emission in Petunia. PNAS. 2015;112:9775–9780. doi: 10.1073/pnas.1422875112. - DOI - PMC - PubMed

Publication types