. 2020 Mar 24;30(12):3964-3971.e7.
doi: 10.1016/j.celrep.2020.02.111.

Route of Vaccine Administration Alters Antigen Trafficking but Not Innate or Adaptive Immunity

Affiliations

Route of Vaccine Administration Alters Antigen Trafficking but Not Innate or Adaptive Immunity

Sebastian Ols et al. Cell Rep. .

Abstract

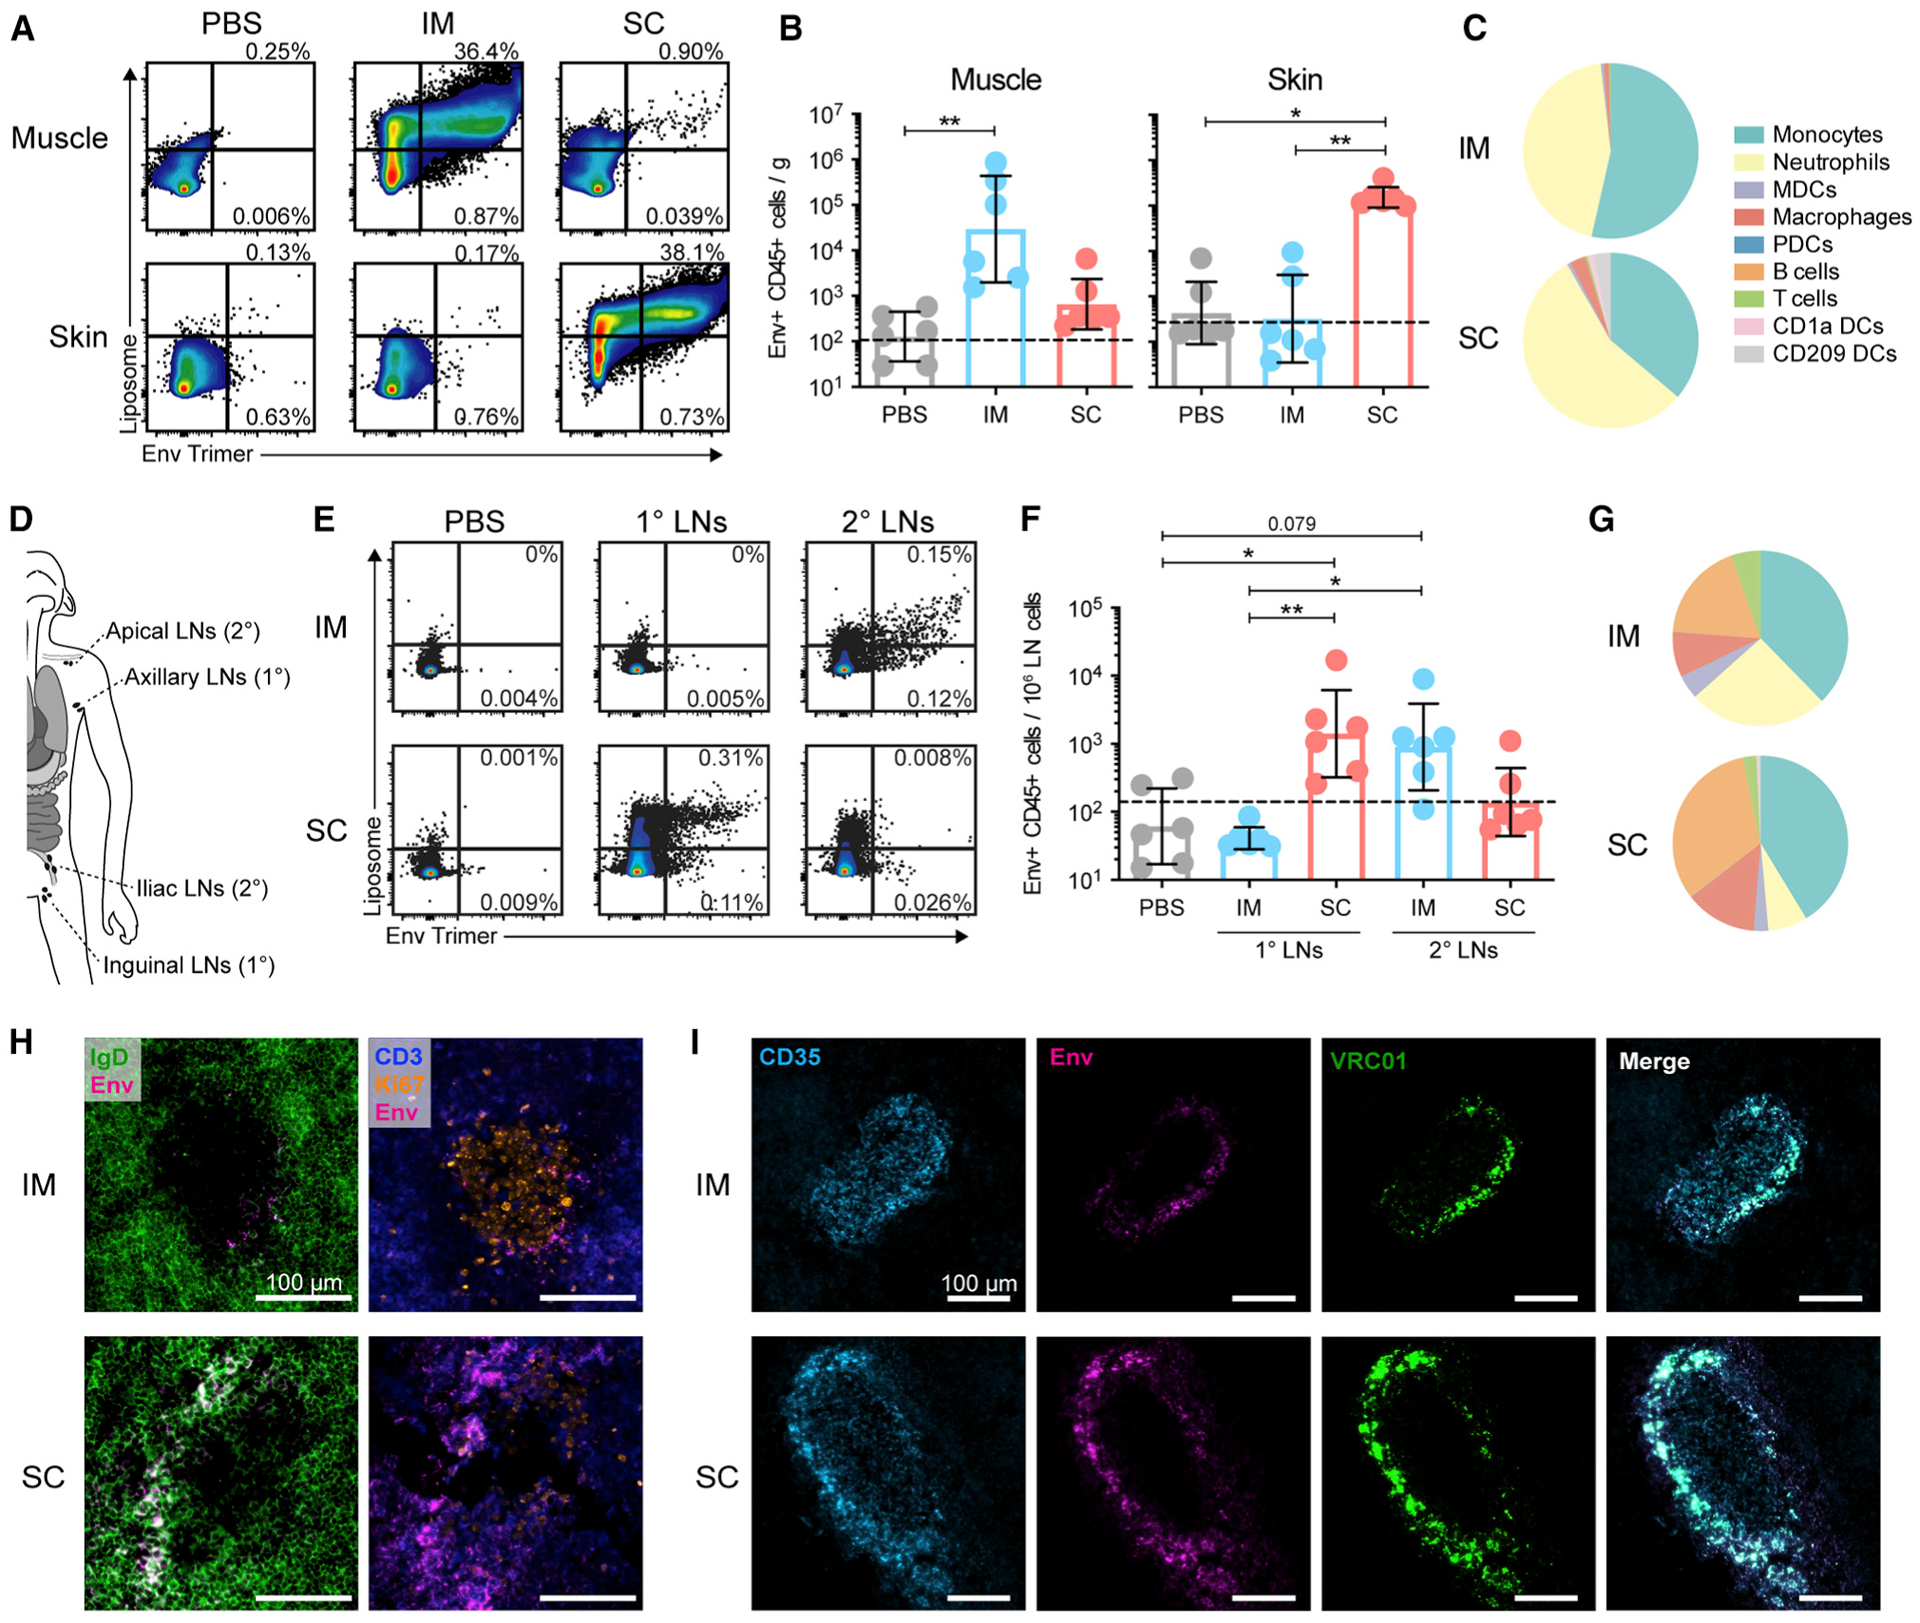
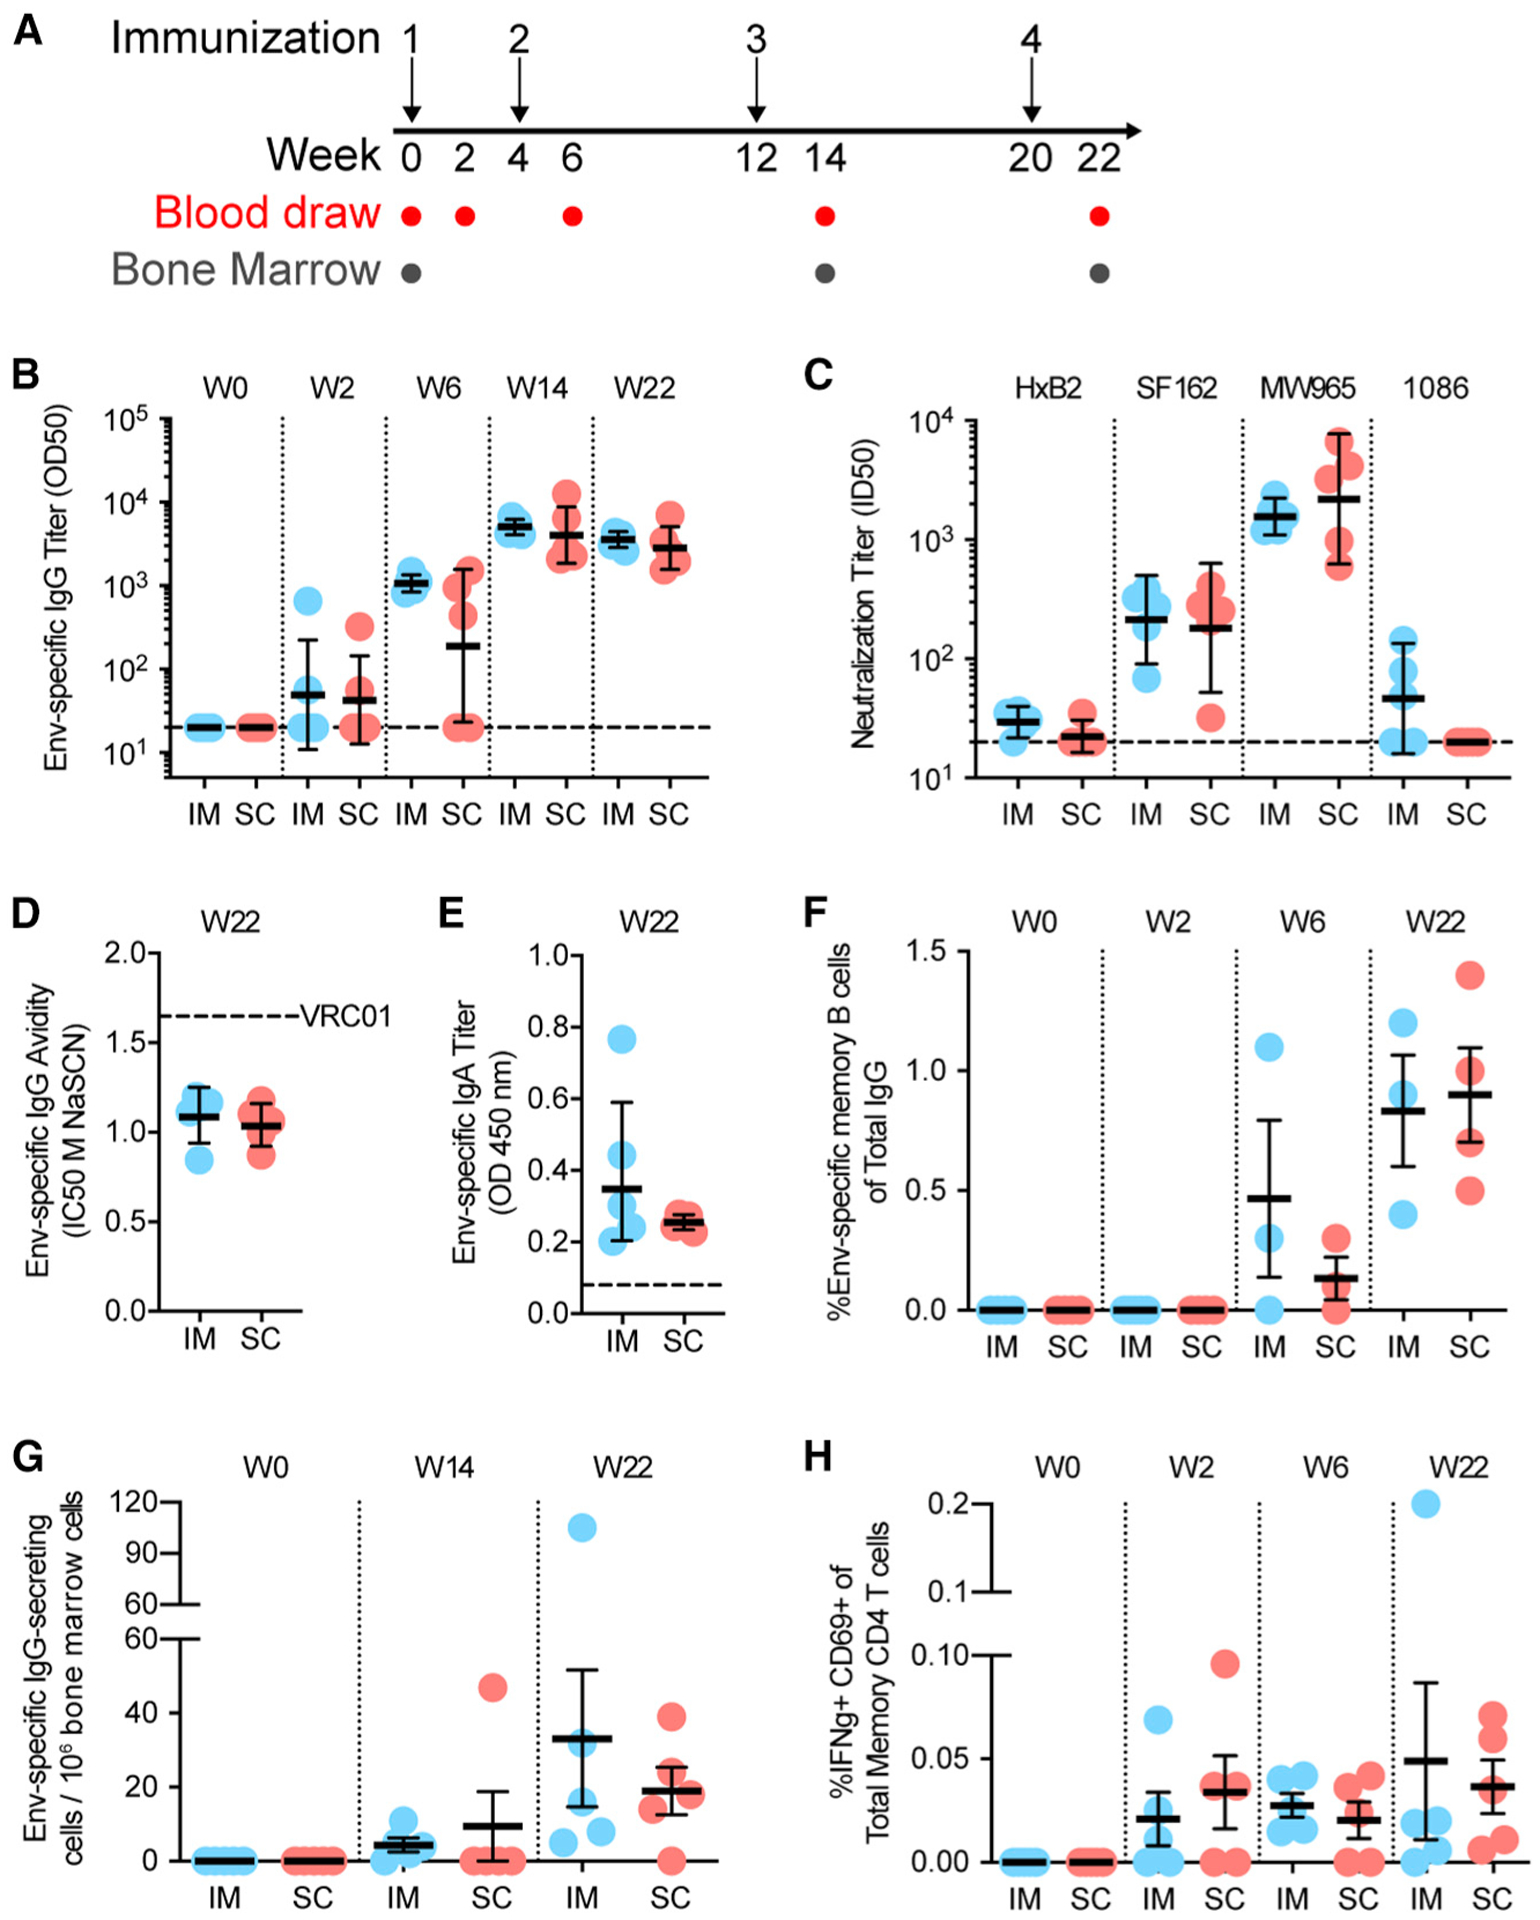
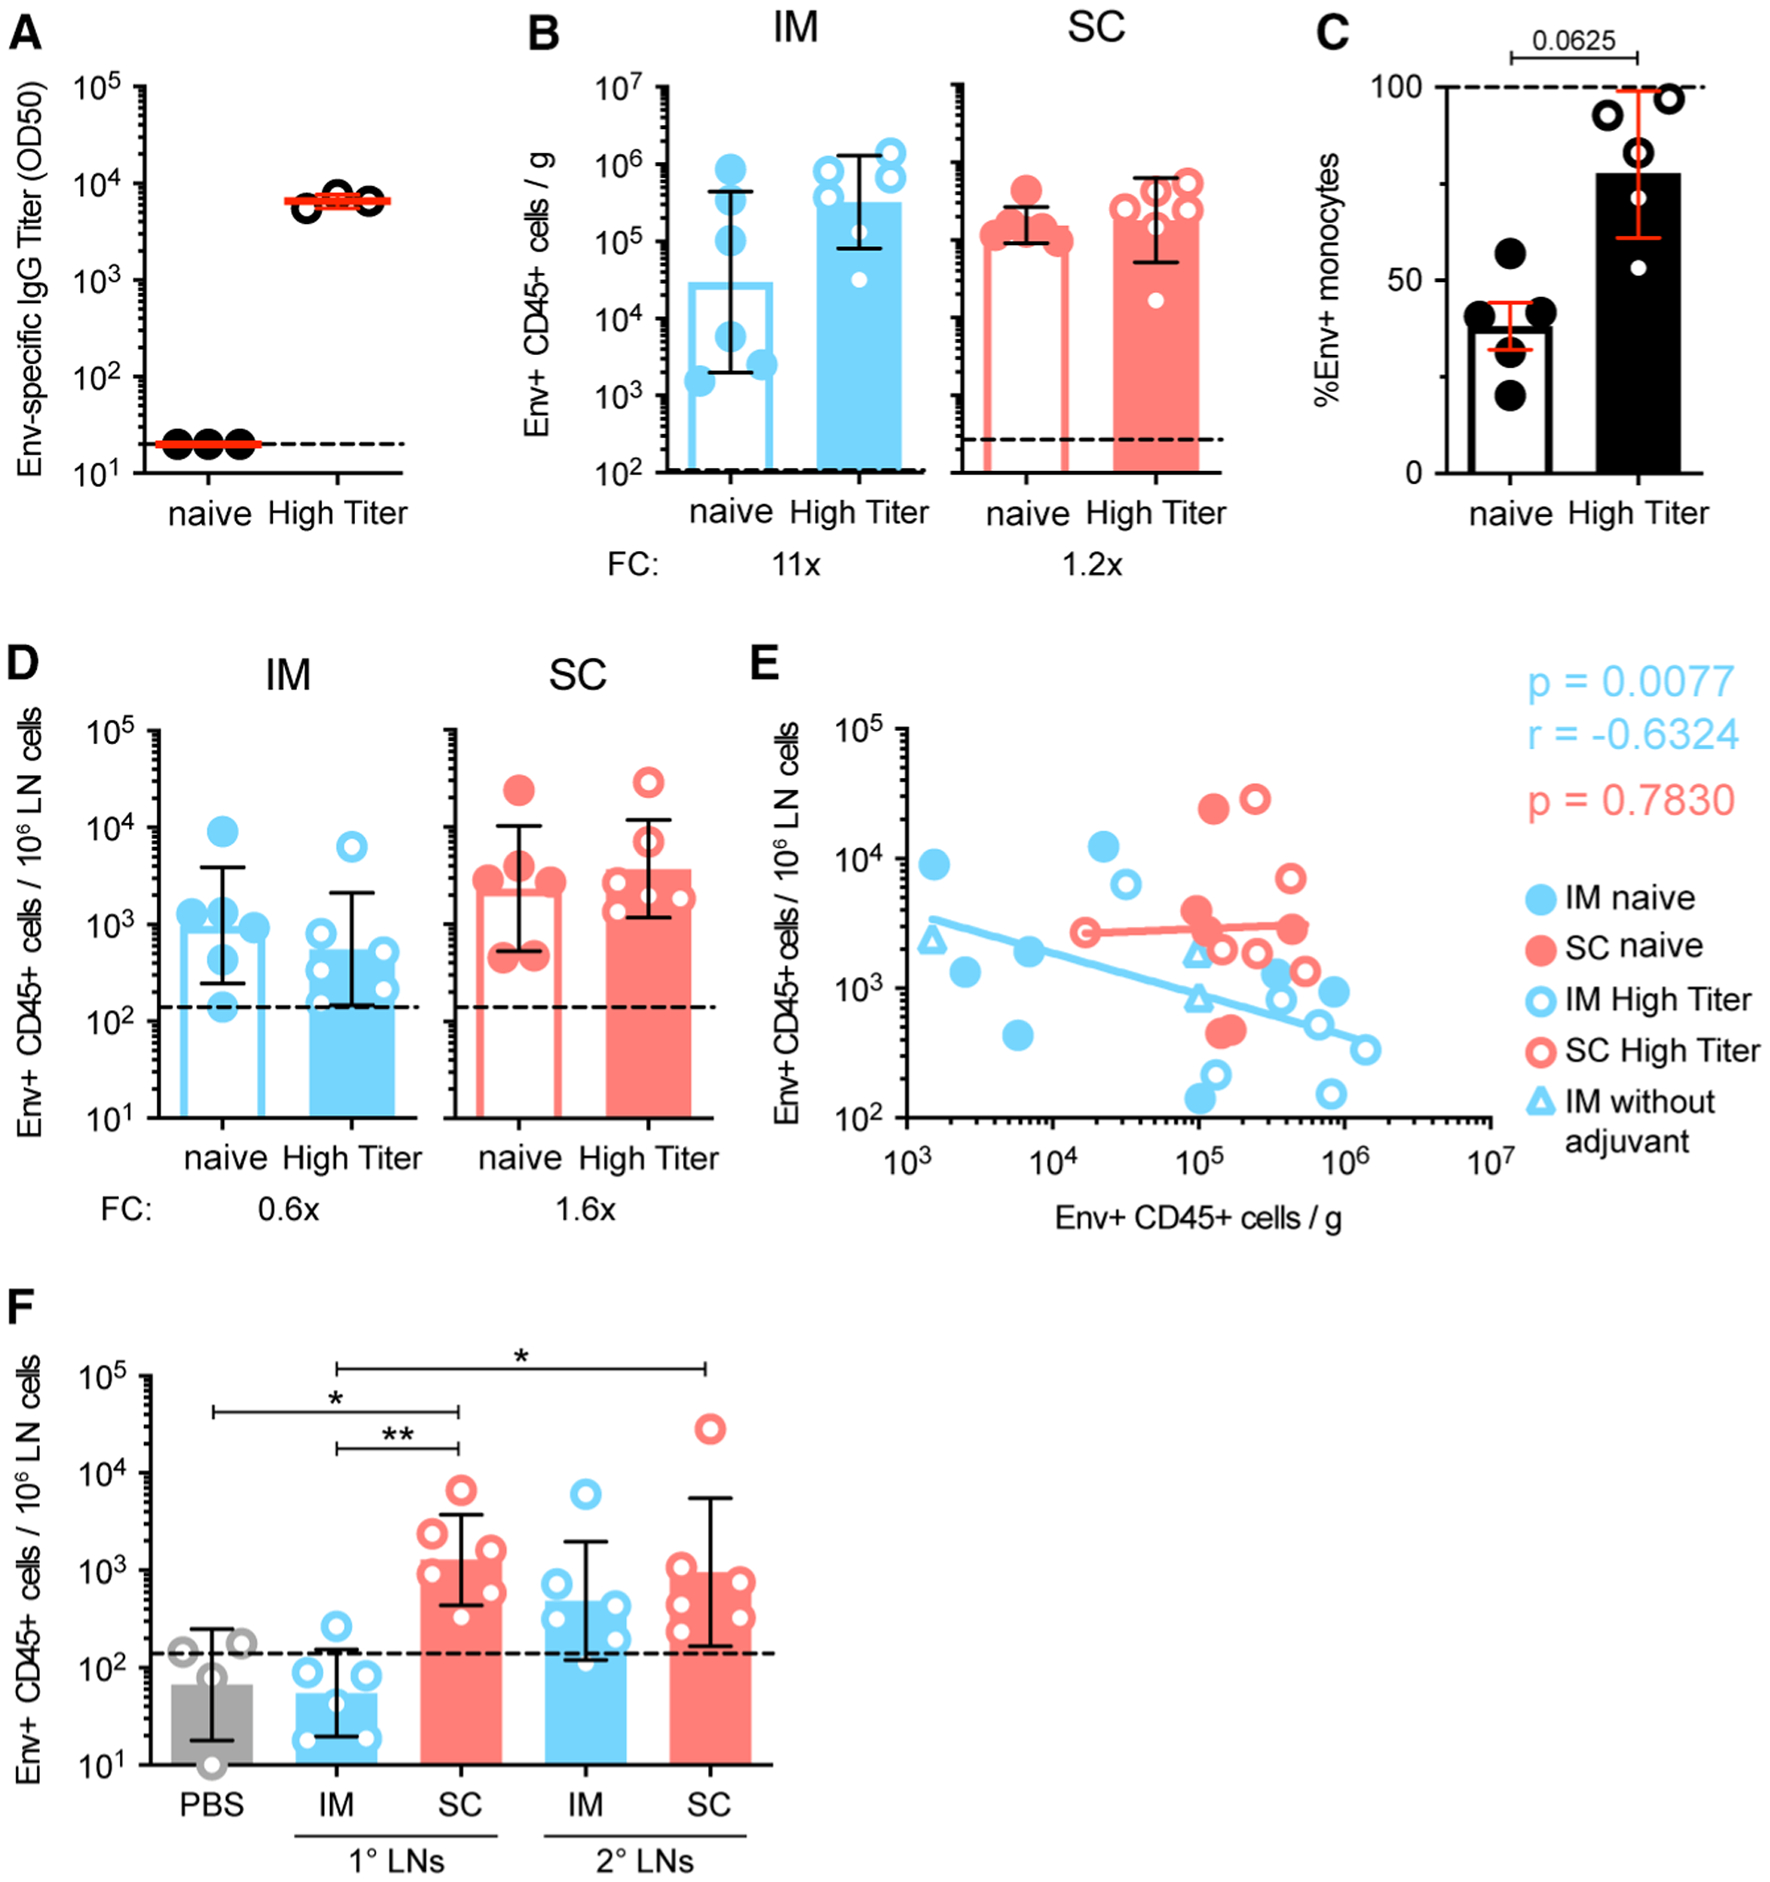
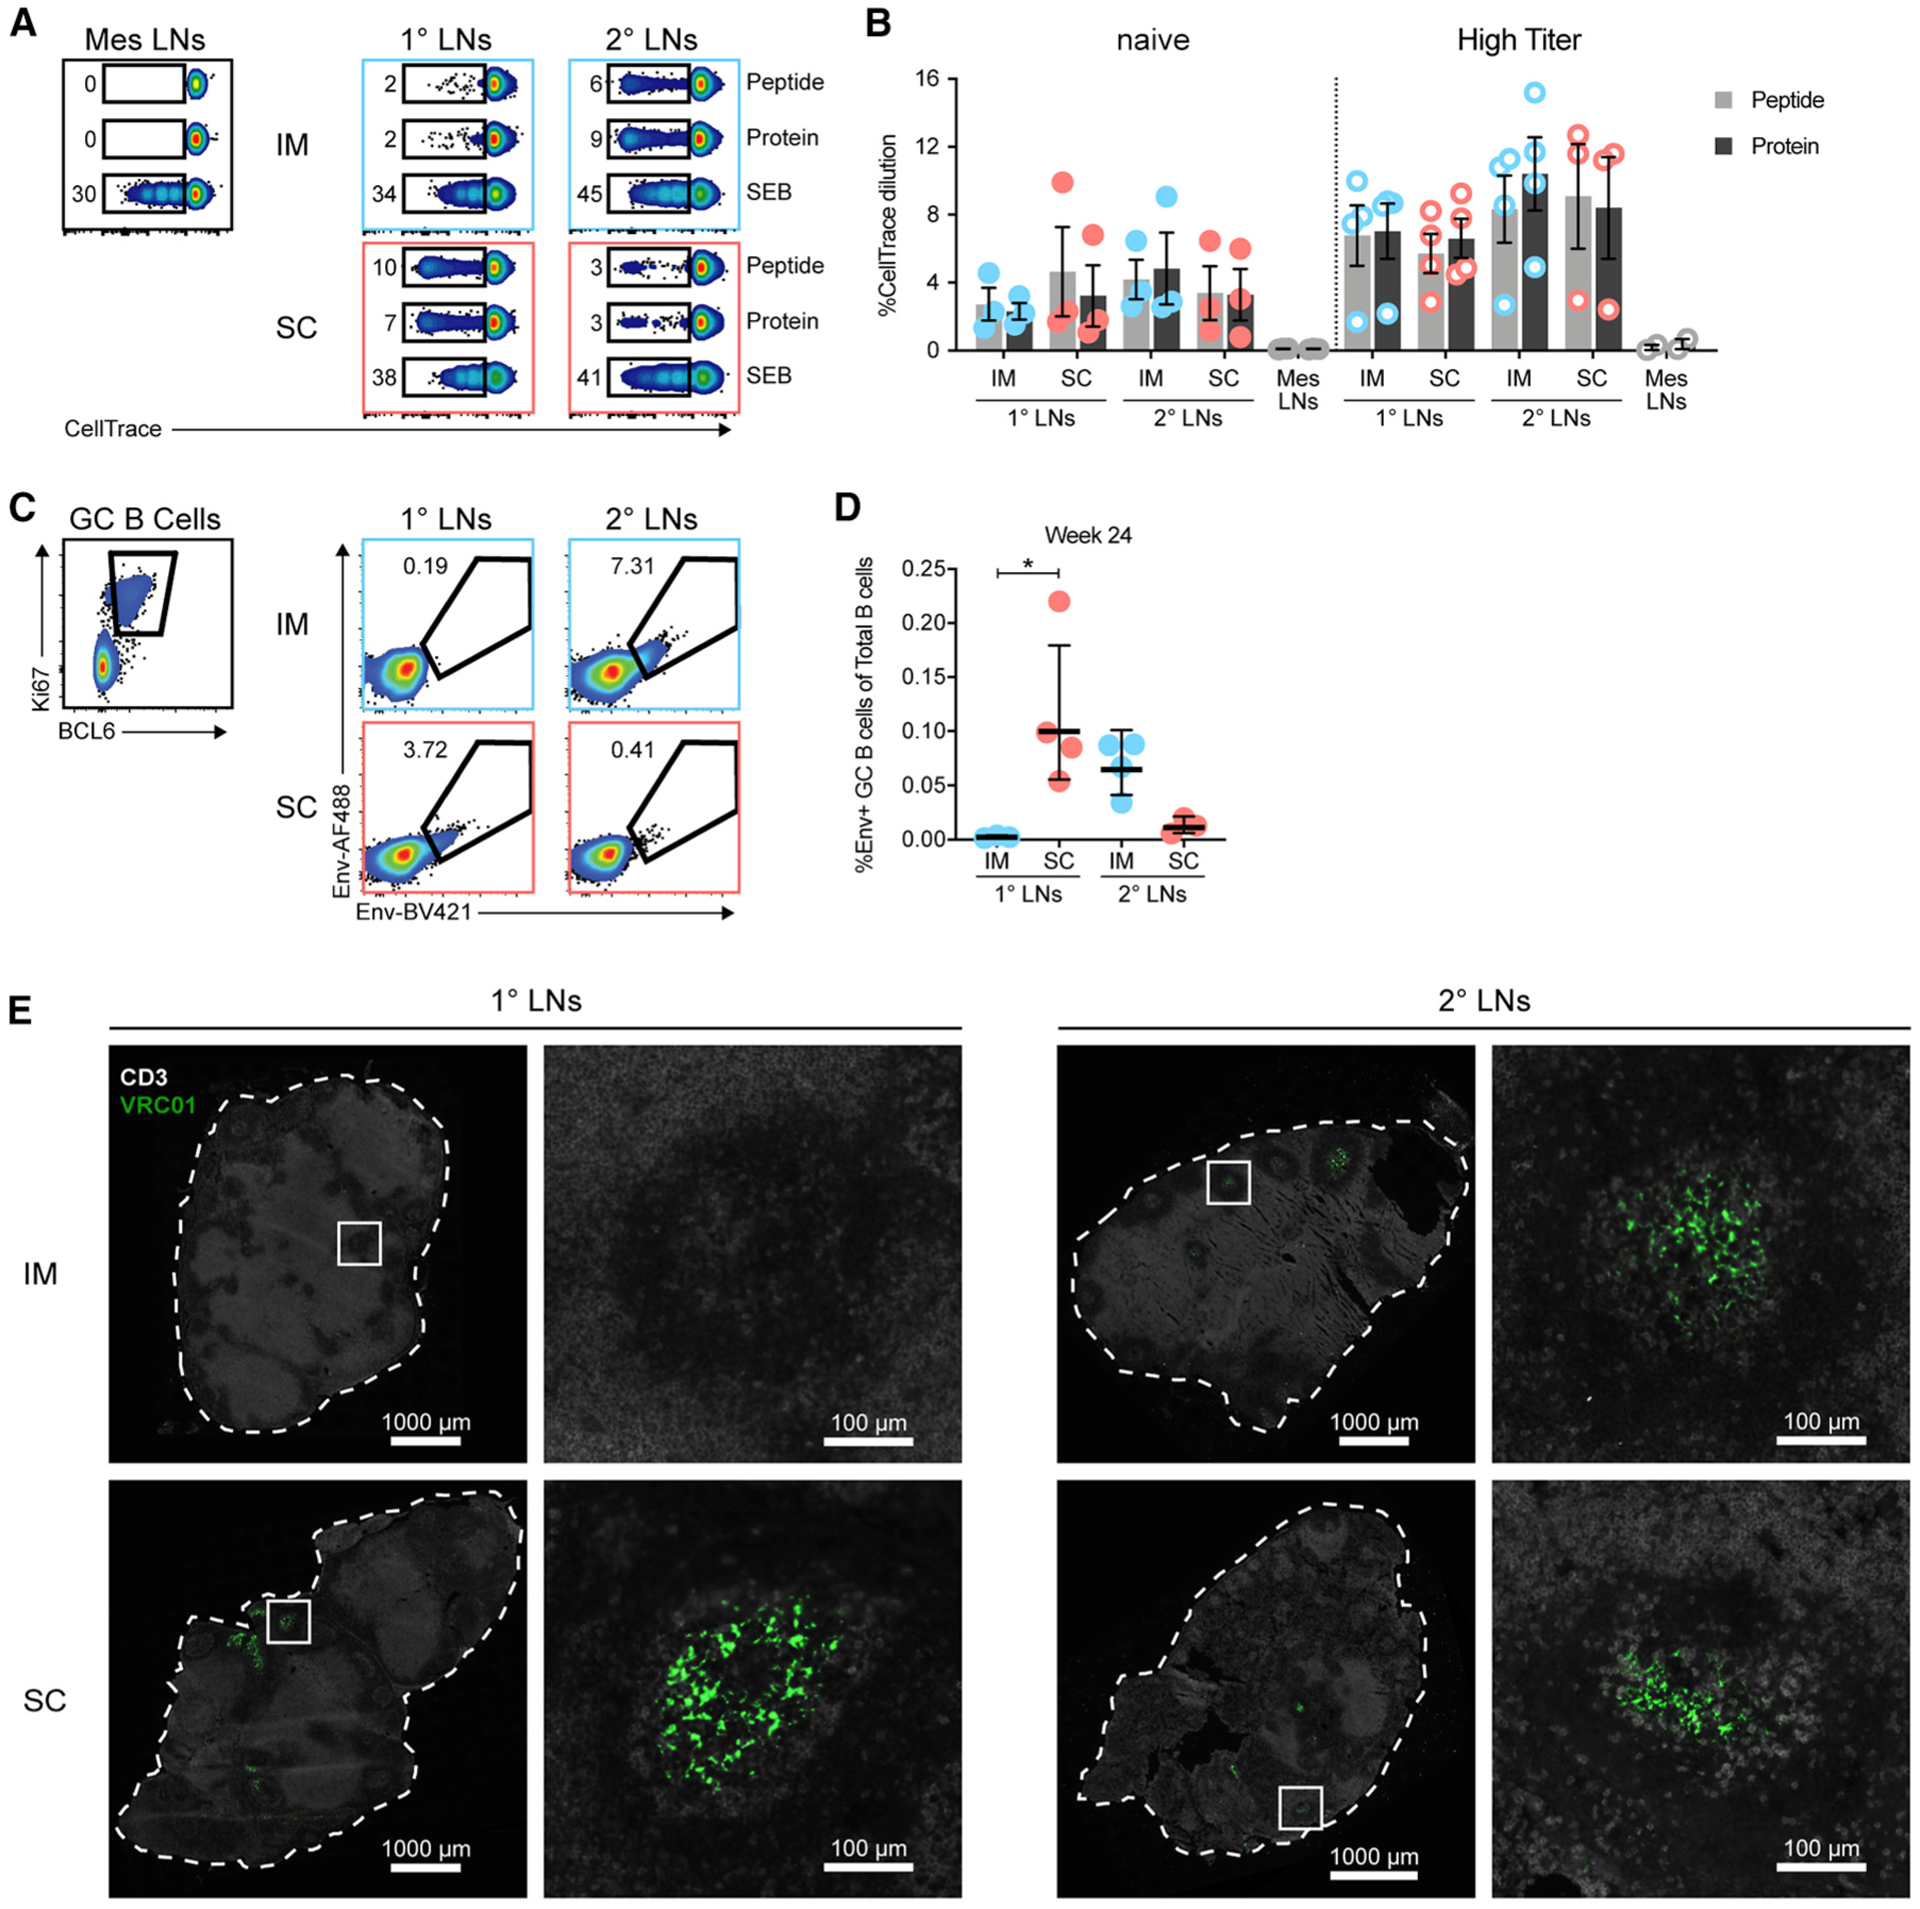
Although intramuscular (i.m.) administration is the most commonly used route for licensed vaccines, subcutaneous (s.c.) delivery is being explored for several new vaccines under development. Here, we use rhesus macaques, physiologically relevant to humans, to identify the anatomical compartments and early immune processes engaged in the response to immunization via the two routes. Administration of fluorescently labeled HIV-1 envelope glycoprotein trimers displayed on liposomes enables visualization of targeted cells and tissues. Both s.c. and i.m. routes induce efficient immune cell infiltration, activation, and antigen uptake, functions that are tightly restricted to the skin and muscle, respectively. Antigen is also transported to different lymph nodes depending on route. However, these early differences do not translate into significant differences in the magnitude or quality of antigen-specific cellular and humoral responses over time. Thus, although some distinct immunological differences are noted, the choice of route may instead be motivated by clinical practicality.

Keywords: B cell follicle; HIV envelope glycoprotein; antigen transport; dendritic cell; follicular dendritic cell; intramuscular; lymph node; monocytes; subcutaneous; vaccination.


Conflict of interest statement

Declaration of Interests The authors declare no competing interests.

Figures

Figure 1.
Figure 1.. Vaccine Uptake Is Restricted to the Site of Injection and Targets Distinct Anatomical LNs
(A) Flow cytometry gating of Env:liposome signals at the site of injection, gated on CD45+ cells. (B) Quantification of Env+ CD45+ cells per gram of muscle or skin tissue. (C) Proportions of Env+ CD45+ cell subsets in the muscle and skin after i.m. and s.c. injection, respectively. (D) Schematic of LN clusters analyzed and their classification as 1° (axillary/inguinal) or 2° (apical/iliac) LNs on the basis of proximity to the injection site (deltoid/quad). (E) Flow cytometry gating of Env:liposome signals in LNs, presented as in (A). (F) Quantification of Env+ CD45+ cells in LNs. (G) Proportions of Env+ CD45+ cell subsets in the draining LNs (sum of 1° and 2° LNs). (H) Representative images of Env localization in LNs stained for CD3 (blue), IgD (green), Env-AF680 (magenta), and Ki67 (orange). (I) Representative images of Env signal verification with VRC01 antibody. LNs stained for CD35 (cyan), Env-AF680 (magenta), and VRC01 (green). In (A)–(G), geometric mean and gSD is displayed. Data points represent individual tissue samples. n = 6 per group. Dashed line represents the limit of detection. See methods for calculation. *p < 0.05 and **p < 0.01. In (H) and (I), representative images of n = 3 LNs per group are shown. Image brightness was increased to allow visualization. See also Figures S1 and S2.
Figure 2.
Figure 2.. Adaptive Immune Responses to HIV-1 Env Are Comparable
(A) Schematic of i.m. and s.c. immunization and sampling schedule. (B) Anti-1086 Env IgG OD50 binding titers measured using ELISA. (C) Tier 1 (H×B2, SF162, MW965) and autologous tier 2 (1086) neutralization at week 22. (D) Env-specific IgG avidity as measured using a chaotropic wash ELISA using NaSCN. Mean of three independent experiments is displayed. (E) Env-specific IgA titers in plasma measured using ELISA. Max OD of 20-fold plasma dilution is displayed. (F) Env-specific memory B cell responses in blood measured using ELISpot. (G) Env-specific plasma cells in bone marrow measured using ELISpot. (H) Env-specific CD4+ memory T cell responses in blood measured by intracellular cytokine recall assay. In (B)–(E), geometric mean and gSD are displayed. In (F)–(H), mean and SEM are displayed. In (B)–(H), data points represent individual animals. n= 5 per group. In (F), n = 3–5 per group. In (B)–(H), no statistically significant differences. See also Figures S1 and S2.
Figure 3.
Figure 3.. Pre-existing Immunity Alters Vaccine Trafficking Dynamics
(A) Anti-1086 Env IgG OD50 binding titers on day of immunization in naive and high-titer animals measured using ELISA. (B) Quantification of Env+ CD45+ cells per gram of muscle or skin tissue of naive and high-titer animals. (C) Env:liposome uptake by isolated human monocytes in vitro with plasma from naive or high-titer animals. Two independent experiments; n = 5 human donors. (D) Quantification of Env+ CD45+ cells in the draining LNs of naive and high-titer animals. (E) Spearman correlation of Env+ CD45+ cells at the site of injection and in the draining LNs. (F) Quantification of Env+ CD45+ cells in 1° and 2° LNs of high-titer animals. In (A)–(F), geometric mean and gSD are displayed. FC, fold change. Naive animal data are the same as displayed in Figure 1. Data points represent individual tissue samples. n = 6 per group. Dashed line represents the limit of detection. See methods for calculation. *p < 0.05 and **p < 0.01. See also Figure S3.
Figure 4.
Figure 4.. Priming of Adaptive Responses is Restricted to the Local Vaccine-Draining LNs
(A and B) T cell proliferation of LN cell suspensions from 24 h after immunization as measured using CellTrace dilution on day 5. (A) Representative flow cytometry plots of proliferating T cells in LNs of naive animals. LN samples are concatenated by condition. (B) Plotted is the percentage of CellTrace dilution in live CD3+ T cells. (C–E) LNs obtained from 30 days post-immunization four (week 24) of RMs from Figure 2. (C) GC B cells identified by expression of Ki67 and BCL6 from CD20+ CD3− cells. Env specificity was interrogated with dual-labeled probes. (D) Plotted is the percentage of Env-specific GC B cells of total CD20+ B cells. (E) Representative images of unlabeled Env localization in LNs stained for CD3 (white) and VRC01 (green). n = 4 LNs per group. Image brightness was increased to allow visualization. In (B) and (D), mean and SEM are displayed. Data points represent individual LN clusters. n = 3 or 4 LNs per group. *p < 0.05. See also Figure S4.

References

    1. Bale S, Goebrecht G, Stano A, Wilson R, Ota T, Tran K, Ingale J, Zwick MB, and Wyatt RT (2017). Covalent linkage of HIV-1 trimers to synthetic liposomes elicits improved B cell and antibody responses. J. Virol 91, e00443–17. - PMC - PubMed
    1. Cook IF, Barr I, Hartel G, Pond D, and Hampson AW (2006). Reactogenicity and immunogenicity of an inactivated influenza vaccine administered by intramuscular or subcutaneous injection in elderly adults. Vaccine 24, 2395–2402. - PubMed
    1. Diez-Domingo J, Weinke T, Garcia de Lomas J, Meyer CU, Bertrand I, Eymin C, Thomas S, and Sadorge C (2015). Comparison of intramuscular and subcutaneous administration of a herpes zoster live-attenuated vaccine in adults aged R50 years: a randomised non-inferiority clinical trial. Vaccine 33, 789–795. - PubMed
    1. Douagi I, Forsell MNE, Sundling C, O’Dell S, Feng Y, Dosenovic P, Li Y, Seder R, Loré K, Mascola JR, et al. (2010). Influence of novel CD4 binding-defective HIV-1 envelope glycoprotein immunogens on neutralizing antibody and T-cell responses in nonhuman primates. J. Virol 84, 1683–1695. - PMC - PubMed
    1. Fisch A, Cadilhac P, Vidor E, Prazuck T, Dublanchet A, and Lafaix C (1996). Immunogenicity and safety of a new inactivated hepatitis A vaccine: a clinical trial with comparison of administration route. Vaccine 14, 1132–1136. - PubMed

Publication types