. 2020 May 15;295(20):6831-6848.
doi: 10.1074/jbc.RA119.012047. Epub 2020 Mar 24.

microRNA-15b contributes to depression-like behavior in mice by affecting synaptic protein levels and function in the nucleus accumbens

Affiliations

microRNA-15b contributes to depression-like behavior in mice by affecting synaptic protein levels and function in the nucleus accumbens

Li Guo et al. J Biol Chem. .

Abstract

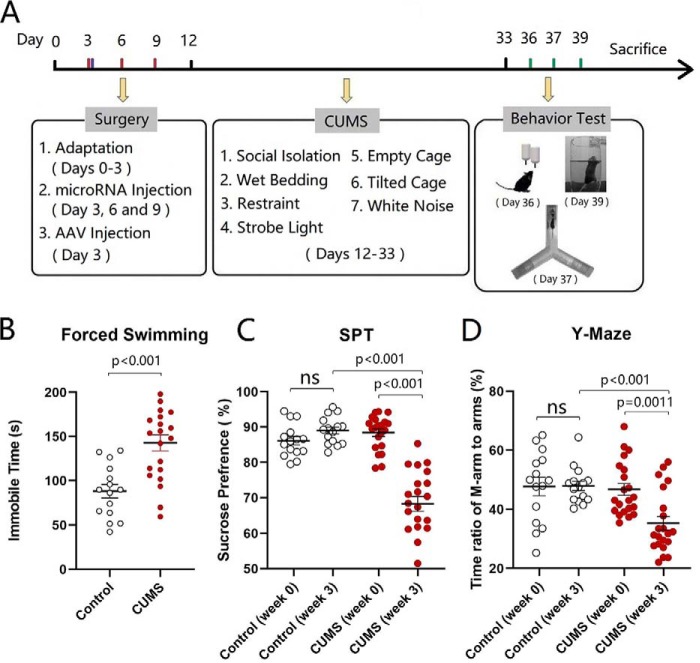
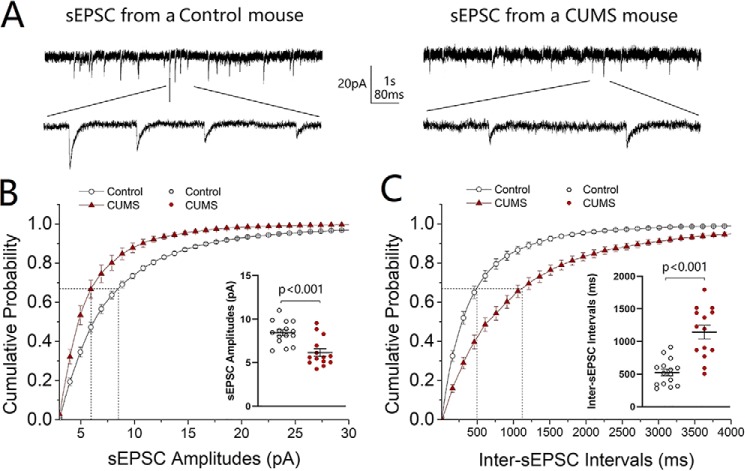
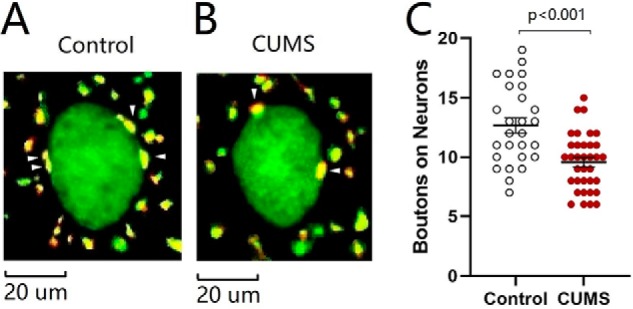
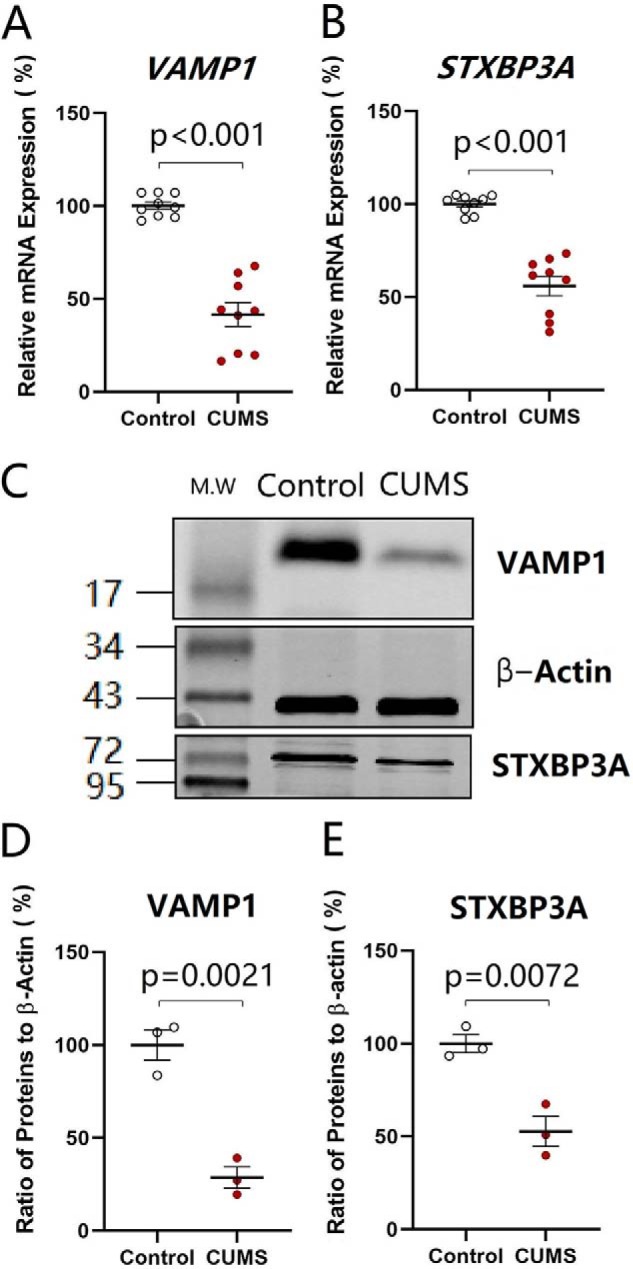
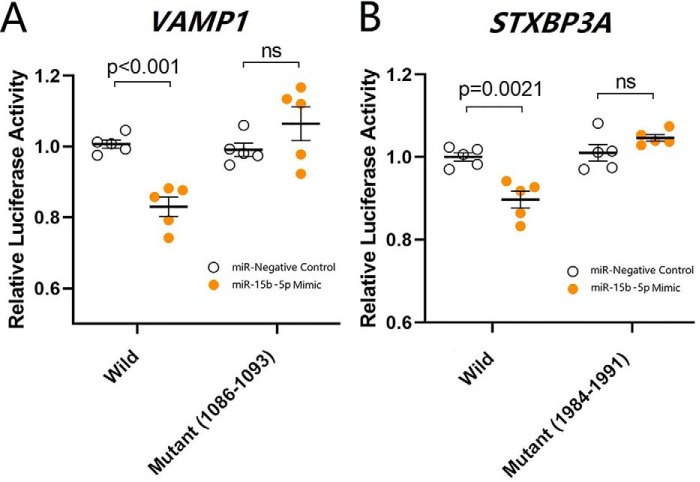
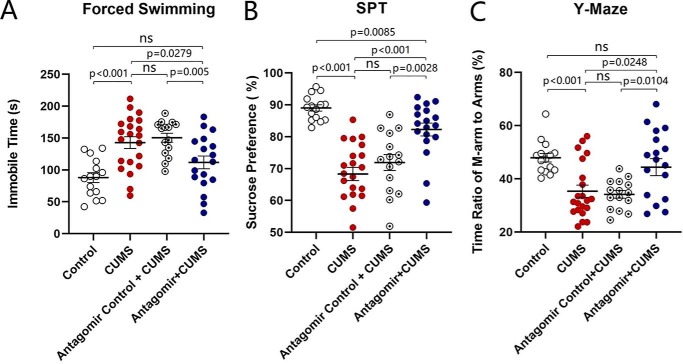
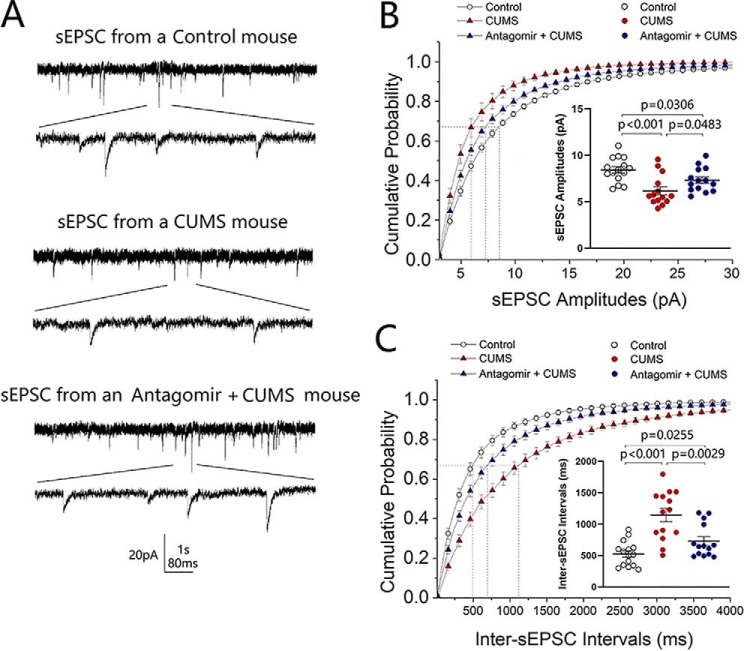
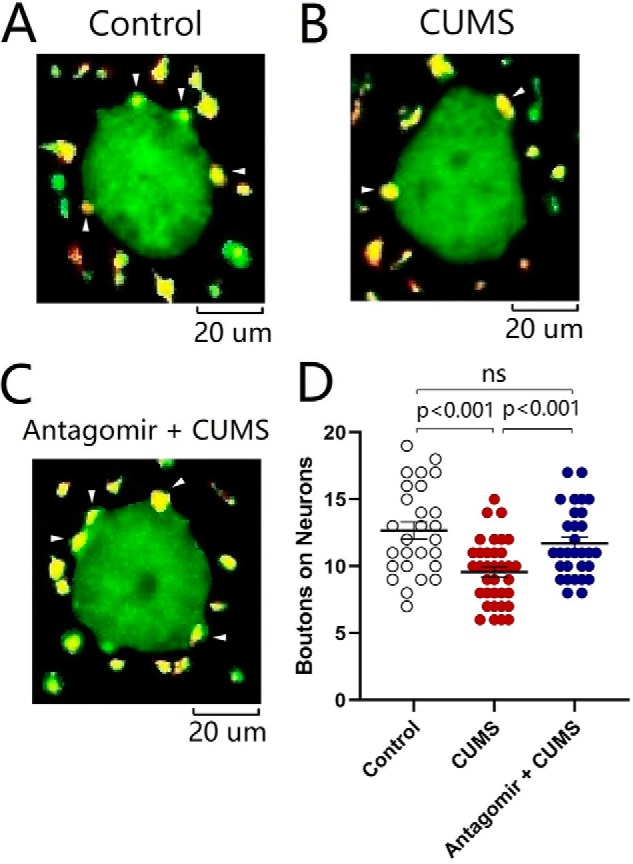
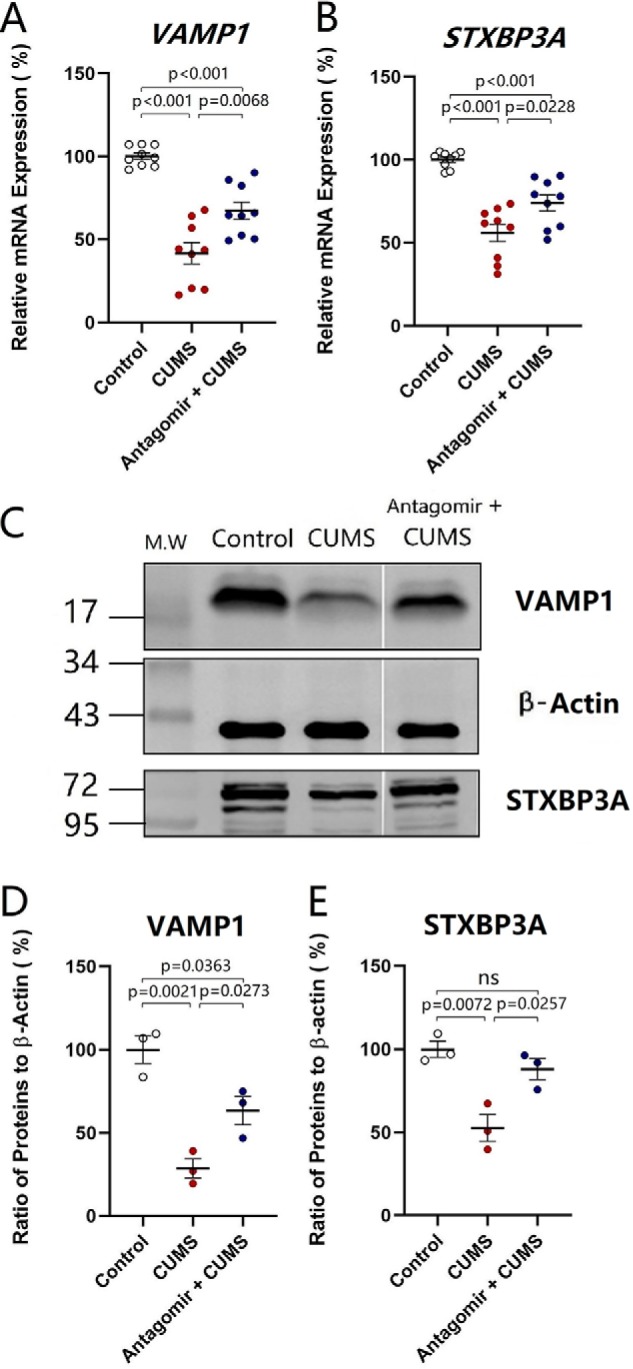
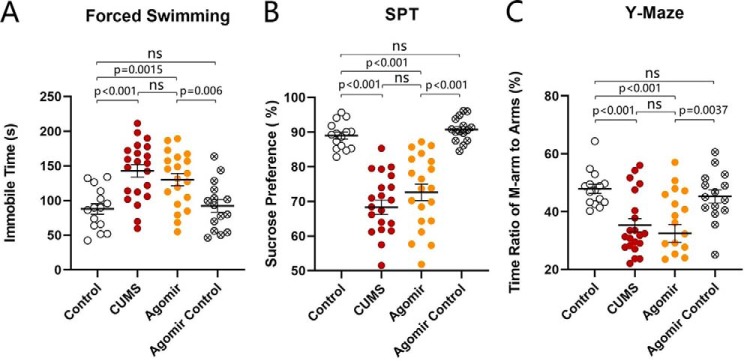
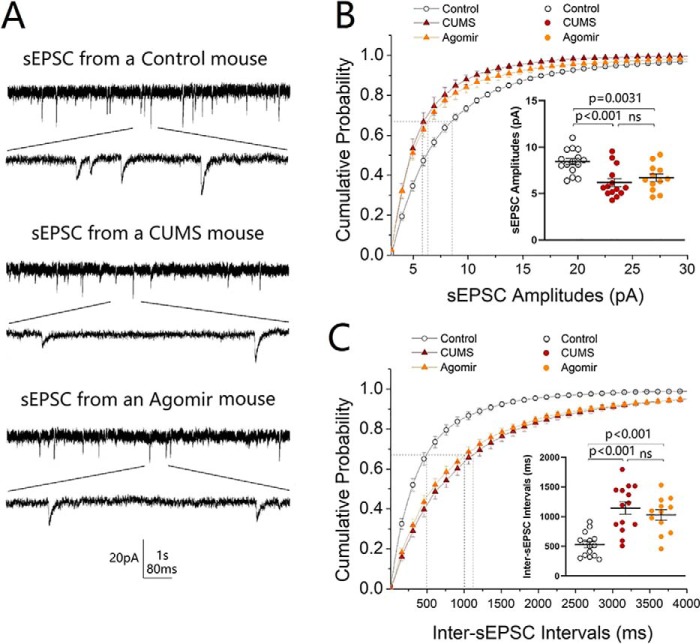
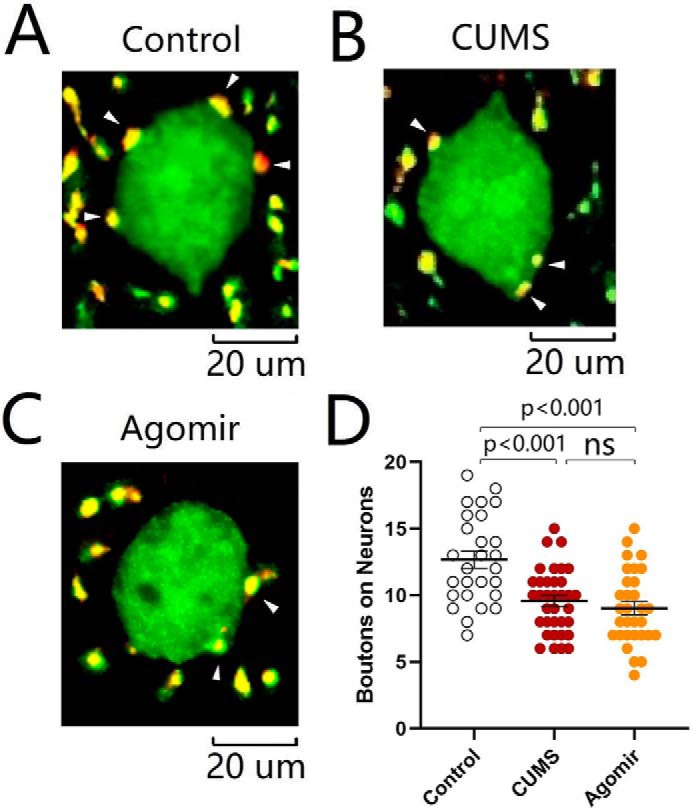
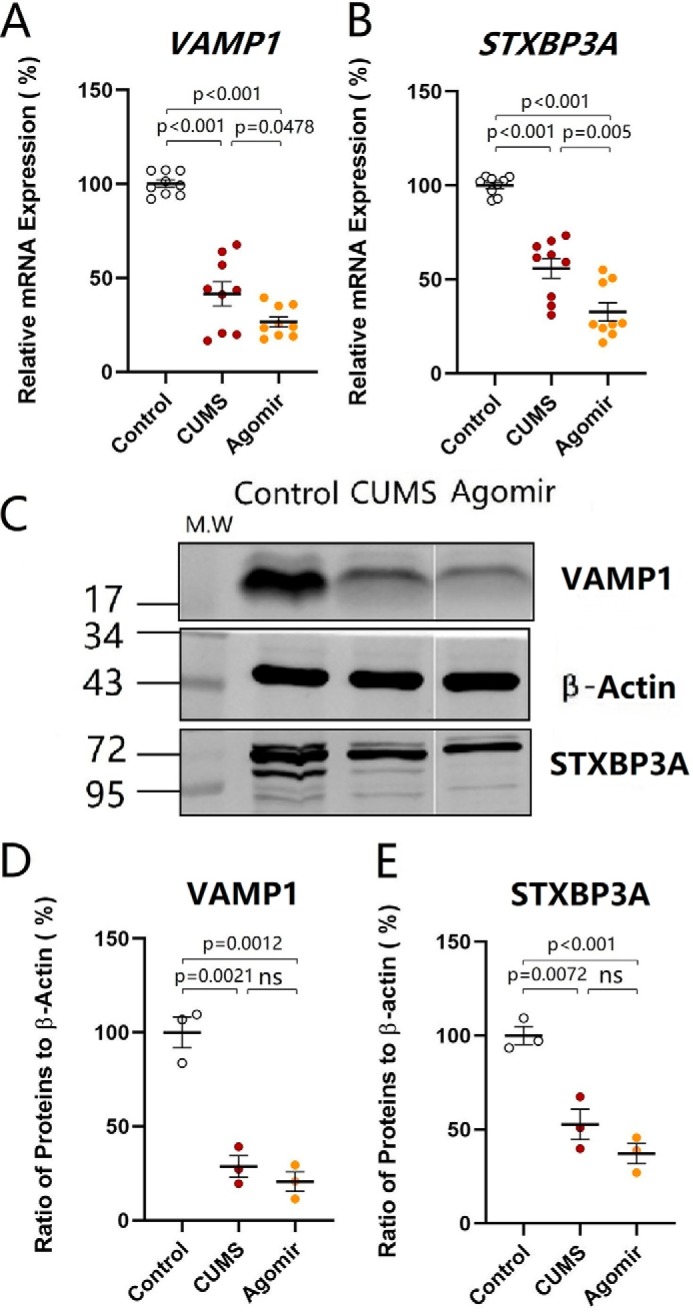
Major depression is a prevalent affective disorder characterized by recurrent low mood. It presumably results from stress-induced deteriorations of molecular networks and synaptic functions in brain reward circuits of genetically-susceptible individuals through epigenetic processes. Epigenetic regulator microRNA-15b inhibits neuronal progenitor proliferation and is up-regulated in the medial prefrontal cortex of mice that demonstrate depression-like behavior, indicating the contribution of microRNA-15 to major depression. Using a mouse model of major depression induced by chronic unpredictable mild stress (CUMS), here we examined the effects of microRNA-15b on synapses and synaptic proteins in the nucleus accumbens of these mice. The application of a microRNA-15b antagomir into the nucleus accumbens significantly reduced the incidence of CUMS-induced depression and reversed the attenuations of excitatory synapse and syntaxin-binding protein 3 (STXBP3A)/vesicle-associated protein 1 (VAMP1) expression. In contrast, the injection of a microRNA-15b analog into the nucleus accumbens induced depression-like behavior as well as attenuated excitatory synapses and STXBP3A/VAMP1 expression similar to the down-regulation of these processes induced by the CUMS. We conclude that microRNA-15b-5p may play a critical role in chronic stress-induced depression by decreasing synaptic proteins, innervations, and activities in the nucleus accumbens. We propose that the treatment of anti-microRNA-15b-5p may convert stress-induced depression into resilience.

Keywords: fusion protein; microRNA (miRNA); neuroscience; stress; synapse.


Conflict of interest statement

The authors declare that they have no conflicts of interest with the contents of this article

Figures

Figure 1.
Figure 1.
CUMS leads the mice to express depression-like behavior. A shows the procedures produced depression-like mice, including the adaptation for 1 week, the CUMS for 3 weeks, and the behavioral tests for 6 days. B illustrates immobile time of staying in the water cylinder in the FST from control mice (open symbols, n = 15) and CUMS-treated mice (red symbols, n = 21). C shows the SPT values (%) from control mice (open symbols, n = 15) and CUMS-treated mice (red symbols, n = 21). D illustrates the ratios of stay time in the M-arm to stay time in three arms by the YMT from control mice (open symbols, n = 15) and CUMS-treated mice (red symbols, n = 21). One-way ANOVA was used for statistical comparisons between control mice and CUMS-treated mice. Paired t test was used for statistical comparisons before and after the CUMS. ns, no statistical significance.
Figure 2.
Figure 2.
Excitatory synaptic transmission is down-regulated in GABAergic neurons of the nucleus accumbens from CUMS-induced depression-like mice. sEPSCs were recorded under voltage-clamp in the brain slices in the presence of 10 μm bicuculline. A shows sEPSCs from a control mouse (left traces) and a CUMS-induced depression mouse (right traces). Calibration symbols: vertical, 20 pA; horizontal, 1 s (top) and 80 ms (bottom). B shows cumulative probability versus sEPSC amplitudes from control group (open symbols, n = 15 cells from five mice) and CUMS-induced depression group (red symbols, n = 14 cells from five mice). Dashed lines indicate sEPSC amplitudes at cumulative probability to 67% (CP67). The inset shows a comparison of sEPSC amplitudes at CP67 from control mice (open symbols) and CUMS-induced depression mice (red symbols). C shows cumulative probability versus inter-sEPSC intervals from control group (open symbols, n = 15 cells from five mice) and CUMS-induced depression group (red symbols, n = 14 cells from five mice). Dashed lines indicate the sEPSC interval at CP67. The inset shows a comparison of sEPSC intervals at CP67 from control mice (open symbols) and CUMS-induced depression mice (red symbols). One-way ANOVA was used for statistical comparisons between control mice and CUMS-induced depression-like mice.
Figure 3.
Figure 3.
Excitatory synapse innervations from the mPFC to GABAergic neurons in the NAc are lowered in the CUMS-induced depression-like mice. A and B illustrate innervations (yellow) from mPFC to GABAergic neurons (green) of NAc in control mice (A) and CUMS-induced depression mice (B). C shows the innervations from mPFC to GABAergic neurons of NAc in the control group (open symbols, n = 27 cells from five mice) and CUMS-induced depression group (red symbols, n = 35 cells from five mice). One-way ANOVA was used for statistical comparisons between control mice and CUMS-induced depression-like mice. Arrowheads indicate synaptic contacts between presynaptic boutons and GABAergic cell bodies.
Figure 4.
Figure 4.
Genes and proteins in relevance to the fusion of synaptic vesicles with presynaptic membrane for releasing transmitters are down-regulated in the nucleus accumbens from CUMS-induced depression mice. The expressions of mRNA VAMP1 and STXBP3A were analyzed by quantitative RT-PCR. The expressions of proteins VAMP1 and STXBP3A were measured by Western blotting. A and B show the relative value of mRNAs VAMP1 (A) and STXBP3A (B) in control mice (open symbols, n = 6) and CUMS-induced depression mice (red symbols, n = 6), in which internal control is β-actin. C shows the expressions of VAMP1 and STXBP3A from control mice and CUMS-induced depression mice, in which the internal control is β-actin. D and E illustrate the normalized ratios of VAMP1 (D) and STXBP3A (E) to β-actin from control mice (open symbols, n = 6) and CUMS-induced depression mice (red symbols, n = 6). The relative ratios for control mice are normalized to be 1. One-way ANOVA was used for statistical comparisons between control mice and CUMS-induced depression-like mice.
Figure 5.
Figure 5.
miR-15b-5p–targeted mRNAs for synaptic vesicle fusion-related proteins are validated by luciferase reporter assay. A and B, luciferase reporter assay is performed by the co-transfection of luciferase reporter containing the wildtype or mutant 3′-untranslated repeat (UTR) of VAMP1 and STXBP3A mRNA with miR-15b-5p mimic and negative control into HEK293T cells. Luciferase activity was determined 48 h after co-transfection. p, < 0.01, and p, < 0.001. ns, no statistical significance.
Figure 6.
Figure 6.
Anti-microRNA-15b-5p rescues CUMS-induced depression-like behavior. A illustrates immobile time in the forced swim test from control mice (open symbols, n = 15), CUMS-induced depression mice (red symbols, n = 21), microRNA-15b-5p antagomir-control plus CUMS mice (circled dot symbols, n = 15), and microRNA-15b-5p antagomir-injection plus CUMS mice (blue symbols, n = 18). B shows values of the sucrose preference test (%) in control mice (open symbols, n = 15), CUMS-induced depression mice (red symbols, n = 21), microRNA-15b-5p antagomir-control plus CUMS mice (circled dot symbols, n = 15), and microRNA-15b-5p antagomir-injection plus CUMS mice (blue symbols, n = 18). C illustrates the ratios of stay time in M-arm to stay time in three arms by the Y-maze test from control mice (open symbols, n = 15), CUMS-induced depression mice (red symbols, n = 21), microRNA-15b-5p antagomir-control plus CUMS mice (circled dot symbols, n = 15), and microRNA-15b-5p antagomir-injection plus CUMS mice (blue symbols, n = 18). One-way ANOVA was used for statistical comparisons among control mice, CUMS-induced depression mice, microRNA-15b-5p antagomir-control plus CUMS mice, and microRNA-15b-5p antagomir-injection plus CUMS mice. ns, no statistical significance.
Figure 7.
Figure 7.
Anti-microRNA-15b-5p rescues excitatory synaptic transmission in GABAergic neurons of the nucleus accumbens impaired by CUMS. sEPSCs were recorded under voltage-clamp in the brain slices in the presence of 10 μm bicuculline. A shows sEPSCs from a control mouse (top traces), a CUMS-induced depression mouse (middle traces), and a microRNA-15b-5p antagomir-injection plus CUMS mouse (bottom traces). Calibration symbols: vertical, 20 pA; horizontal, second (top) and 80 ms (bottom) in horizontal. B shows cumulative probability versus sEPSC amplitudes from control group (open symbols, n = 15 cells from five mice), CUMS-induced depression group (red symbols, n = 14 cells from five mice), and microRNA-15b-5p antagomir-injection plus CUMS group (blue symbols, n = 14 cells from five mice). Dashed lines indicate sEPSC amplitudes at CP67. The inset shows a comparison of sEPSC amplitudes at CP67 from control mice (open symbols), CUMS-induced depression mice (red symbols), and microRNA-15b-5p antagomir-injection plus CUMS mice (blue symbols). C shows cumulative probability versus inter-sEPSC intervals from control group (open symbols, n = 15 cells from five mice), CUMS-induced depression group (red symbols, n = 14 cells from five mice), and microRNA-15b-5p antagomir injection plus CUMS group (blue symbols, n = 14 cells from five mice). Dashed lines indicate sEPSC intervals at CP67. The inset shows a comparison of sEPSC intervals at CP67 from control mice (open symbols), CUMS-induced depression-like mice (red symbols), and microRNA-15b-5p antagomir-injection plus CUMS mice (blue symbols). One-way ANOVA was used for statistical comparisons among control mice, CUMS-induced depression mice, and microRNA-15b-5p antagomir-injection plus CUMS mice.
Figure 8.
Figure 8.
Decrease of synapse innervations from the mPFC to GABAergic neurons in the NAc is rescued by anti-microRNA-15b-5p. A–C illustrate the innervations (yellow) from mPFC to GABAergic neurons (green) of the NAc in control mice (A), CUMS-induced depression-like mice (B), and microRNA-15b-5p antagomir-injection plus CUMS mice (C). D shows the innervations from mPFC to GABAergic neurons of NAc from control group (open symbols, n = 27 cells from five mice), CUMS-induced depression group mice (red symbols, n = 35 cells from five mice), and microRNA-15b-5p antagomir-injection plus CUMS group (blue symbols, n = 30 cells from five mice). One-way ANOVA was used for statistical comparisons among control mice, CUMS-induced depression mice, and microRNA-15b-5p antagomir-injection plus CUMS mice. Arrowheads indicate synaptic contacts between presynaptic boutons and GABAergic cell bodies. ns, no statistical significance.
Figure 9.
Figure 9.
Anti-microRNA-15b-5p rescues the decrease of VAMP1 and STXBP3A in the NAc induced by the CUMS. The expressions of mRNAs VAMP1 and STXBP3A were analyzed by quantitative RT-PCR. The expression of proteins VAMP1 and STXBP3A were measured by Western blotting. A and B show the relative value of mRNA for VAMP1 (A) and STXBP3A (B) in control mice (open symbols, n = 6), CUMS-induced depression mice (red symbols, n = 6), and microRNA-15b-5p antagomir-injection plus CUMS mice (blue symbols, n = 6), in which internal control is β-actin. C shows the expressions of VAMP1 and STXBP3A from control mice, CUMS-induced depression mice, and microRNA-15b-5p antagomir-injection plus CUMS mice, in which internal control is β-actin. D and E show the normalized ratios of VAMP1 (D) and STXBP3A (E) expression to β-actin from control mice (open symbols, n = 6), CUMS-induced depression mice (red symbols, n = 6), and microRNA-15b-5p antagomir-injection plus CUMS mice (blue symbols, n = 6). The relative ratios for control mice are normalized to be 1. One-way ANOVA was used for statistical comparisons among control mice, CUMS-induced depression-like mice, and microRNA-15b-5p antagomir-injection plus CUMS mice. ns, no statistical significance.
Figure 10.
Figure 10.
microRNA-15b-5p in the nucleus accumbens evokes depression-like behavior in mice similarly to those induced by the CUMS. A illustrates the immobile time in the FST from control mice (open symbols, n = 15), CUMS-induced depression mice (red symbols, n = 21), microRNA-15b-5p agomir-control mice (circled × symbols, n = 15), and microRNA-15b-5p agomir-injection mice (yellow symbols, n = 20). B shows the SPT values (%) from control mice (open symbols, n = 15), CUMS-induced depression mice (red symbols, n = 21), microRNA-15b-5p agomir-control mice (circled × symbols, n = 15), and microRNA-15b-5p agomir-injection mice (yellow symbols, n = 20). C illustrates the ratios of stay time in M-arm to stay time in three arms by the YMT from control mice (open symbols, n = 15), CUMS-induced depression mice (red symbols, n = 21), microRNA-15b-5p agomir-control mice (circled × symbols, n = 15), and microRNA-15b-5p agomir-injection mice (yellow symbols, n = 20). One-way ANOVA was used for statistical comparisons among control mice, CUMS-induced depression mice, microRNA-15b-5p agomir-control mice, and microRNA-15b-5p agomir-injection mice. ns, no statistical significance.
Figure 11.
Figure 11.
microRNA-15b-5p impairs synaptic transmission in GABAergic neurons of the NAc similarly to that induced by the CUMS. sEPSCs were recorded under voltage-clamp in the brain slices in the presence of 10 μm bicuculline. A shows sEPSCs from a control mouse (top traces), a CUMS-induced depression mouse (middle traces), and a microRNA-15b-5p agomir-injection mouse (bottom traces). Calibration symbols: vertical symbols, 20 pA; horizontal, 1 s (top) and 80 ms (bottom). B shows cumulative probability versus sEPSC amplitudes from control group (open symbols, n = 15 cells from five mice), CUMS-induced depression group (red symbols, n = 14 cells from five mice), and microRNA-15b-5p agomir-injection group (yellow symbols, n = 12 cells from five mice). Dashed lines indicate sEPSC amplitudes at CP67. The inset shows a comparison of sEPSC amplitudes at CP67 from control mice (open symbols), CUMS-induced depression-like mice (red symbols), and microRNA-15b-5p agomir-injection mice (yellow symbols). C shows cumulative probability versus inter-sEPSC intervals from control group (open symbols, n = 15 cells from five mice), CUMS-induced depression group (red symbols, n = 14 cells from five mice), and microRNA-15b-5p agomir-injection group (yellow symbols, n = 12 cells from five mice). Dashed lines indicate sEPSC intervals at CP67. The inset shows a comparison of sEPSC intervals at CP67 from control mice (open symbols), CUMS-induced depression mice (red symbols), and microRNA-15b-5p agomir-injection mice (yellow symbols). One-way ANOVA was used for statistical comparisons among control mice, CUMS-induced depression mice and microRNA-15b-5p agomir-injection mice. ns, no statistical significance.
Figure 12.
Figure 12.
microRNA-15b-5p attenuates synapse innervations similarly to that induced by the CUMS. A–C show innervations (yellow) from mPFC to GABAergic neurons (green) of NAc in control mice (A), CUMS-induced depression mice (B), and microRNA-15b-5p agomir-injection mice (C). D shows the innervations from mPFC to GABAergic neurons of NAc in the control group (open symbols, n = 27 cells from five mice), CUMS-induced depression group (red symbols, n = 35 cells from five mice), and microRNA-15b-5p agomir-injection group (yellow symbols, n = 31 cells from five mice). One-way ANOVA was used for statistical comparisons among control mice, CUMS-induced depression mice, and microRNA-15b-5p agomir-injection mice. ns, no statistical significance.
Figure 13.
Figure 13.
microRNA-15b-5p attenuates the expression of VAMP1 and STXBP3A similarly to that induced by the CUMS. The expression levels of mRNA VAMP1 and STXBP3A were analyzed by quantitative RT-PCR. The expressions of proteins VAMP1 and STXBP3A were measured by Western blottings. A and B show the relative value of mRNA for VAMP1 (A) and STXBP3A (B) in control mice (open symbols, n = 6), CUMS-induced depression mice (red symbols, n = 6), and microRNA-15b-5p agomir-injection mice (yellow symbols, n = 6), in which internal control is β-actin. C shows the expressions of VAMP1 and STXBP3A from control mice, CUMS-induced depression mice, and microRNA-15b-5p agomir-injection mice, in which internal control is β-actin. D and E illustrate the normalized ratios of VAMP1 (D) and STXBP3A (E) expression to β-actin from control mice (open symbols, n = 6), CUMS-induced depression mice (red symbols, n = 6), and microRNA-15b-5p agomir-injection mice (yellow symbols, n = 6). The relative ratios for control mice are normalized to be 1. One-way ANOVA was used for statistical comparisons among control mice, CUMS-induced depression mice, and microRNA-15b-5p agomir-injection mice. Arrowheads indicate synaptic contacts between presynaptic boutons and GABAergic cell bodies. ns, no statistical significance.

Similar articles

Cited by

References

    1. Hamilton J. P., Chen M. C., and Gotlib I. H. (2013) Neural systems approaches to understanding major depressive disorder: an intrinsic functional organization perspective. Neurobiol. Dis. 52, 4–11 10.1016/j.nbd.2012.01.015 - DOI - PMC - PubMed
    1. Jabbi M., Korf J., Ormel J., Kema I. P., and den Boer J. A. (2008) Investigating the molecular basis of major depressive disorder etiology: a functional convergent genetic approach. Ann. N.Y. Acad. Sci. 1148, 42–56 10.1196/annals.1410.018 - DOI - PMC - PubMed
    1. Keers R., and Uher R. (2012) Gene-environment interaction in major depression and antidepressant treatment response. Curr. Psychiatry Rep. 14, 129–137 10.1007/s11920-011-0251-x - DOI - PubMed
    1. Lohoff F. W. (2010) Overview of the genetics of major depressive disorder. Curr. Psychiatry Rep. 12, 539–546 10.1007/s11920-010-0150-6 - DOI - PMC - PubMed
    1. Moylan S., Maes M., Wray N. R., and Berk M. (2013) The neuroprogressive nature of major depressive disorder: pathways to disease evolution and resistance, and therapeutic implications. Mol. Psychiatry 18, 595–606 10.1038/mp.2012.33 - DOI - PubMed

Publication types

Substances