. 2020 Apr 7;117(14):7879-7887.
doi: 10.1073/pnas.1915088117. Epub 2020 Mar 24.

Scale-invariant topology and bursty branching of evolutionary trees emerge from niche construction

Affiliations

Scale-invariant topology and bursty branching of evolutionary trees emerge from niche construction

Chi Xue et al. Proc Natl Acad Sci U S A. .

Abstract

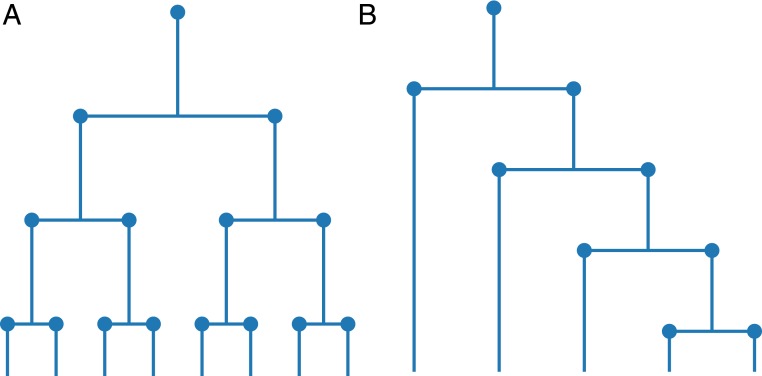
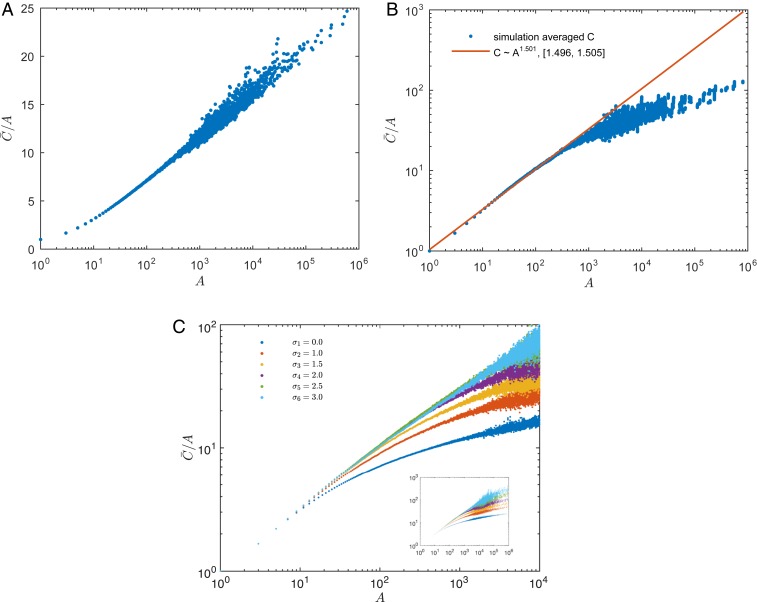
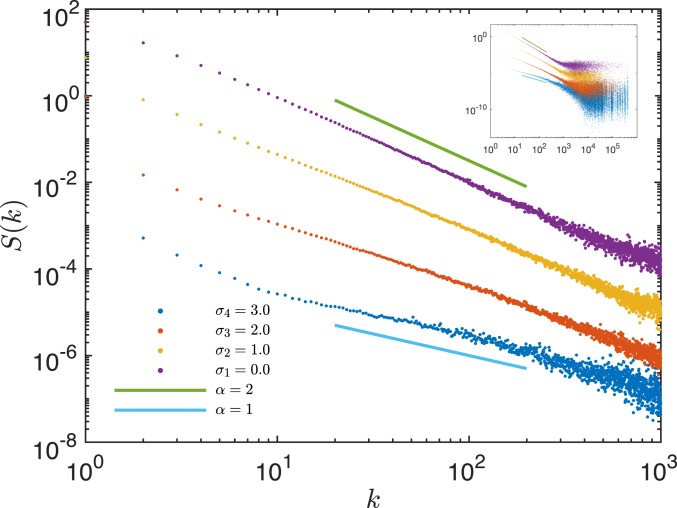
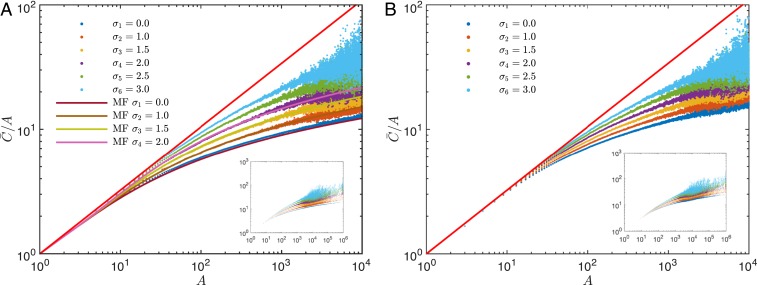
Phylogenetic trees describe both the evolutionary process and community diversity. Recent work has established that they exhibit scale-invariant topology, which quantifies the fact that their branching lies in between the two extreme cases of balanced binary trees and maximally unbalanced ones. In addition, the backbones of phylogenetic trees exhibit bursts of diversification on all timescales. Here, we present a simple, coarse-grained statistical model of niche construction coupled to speciation. Finite-size scaling analysis of the dynamics shows that the resultant phylogenetic tree topology is scale-invariant due to a singularity arising from large niche construction fluctuations that follow extinction events. The same model recapitulates the bursty pattern of diversification in time. These results show how dynamical scaling laws of phylogenetic trees on long timescales can reflect the indelible imprint of the interplay between ecological and evolutionary processes.

Keywords: evolution; molecular phylogeny; niche construction; scaling laws.


Figures

Fig. 1.
Fig. 1.
(A) A balanced tree. All nodes have exactly two descendants. The topological relation C(A)AlnA at large A. (B) A maximally unbalanced tree. For any node, only one of the two children continues branching. CA2 at large A. Actual phylogenetic trees have topology and scaling behavior in between the two extreme cases, as studied in ref. .
Fig. 2.
Fig. 2.
(A) Averaged C(A) calculated for a typical tree generated by the Niche Inheritance Model, with σn=0. The dots scatter along a straight line in the linear-logarithmic scale, indicating C¯/AlnA. (B) Averaged typical C(A) calculated with σn=2. The scale is double logarithmic. Fitting the well-averaged region, A<200, to a power function C¯Aη gives an exponent of η=1.501, with the 95% CI being [1.496,1.505]. The red line stands for the fitted function. (C) Dependence of averaged C(A) on σn, with rϵ=0. As σn increases, the apparent power-law region of C¯(A) also stretches. Since subtrees with A>104 are undersampled, those data points are not shown in the main plot. The full data are shown in C, Inset. All of the following C(A) plots are handled in a similar fashion. Other parameters for all sets of simulations are rϵ=0, μn=0, R0=10, and n0=1 for the root node.
Fig. 3.
Fig. 3.
(A) Dependence of averaged C(A) on rϵ, with σn=2.5. As rϵ approaches zero, C¯(A) expands the power-law range. Other parameters are μn=0, R0=10, and n0=1 for the root node. (B) The same data as in A plotted in the linear-logarithmic scale. The scaling turns C¯(A)AlnA, as rϵ becomes large. Insets in A and B show the full data range, respectively.
Fig. 4.
Fig. 4.
Critical scaling of C¯(A) as rϵ decreases, indicated by the data collapse. By tuning η and b, we reach a data collapse of the eight C¯(A) datasets corresponding to eight values of rϵ ranging from 0 to 0.1 across four orders of magnitude. b=0.36 and η=1.53 gives the best result. The tail matches the expected x1ηlnx behavior, which is indicated by the straight reference line in the double-logarithmic scale. Other parameters for all datasets are σn=2.5, μn=0, R0=10, and n0=1 for the root node.
Fig. 5.
Fig. 5.
Dependence of EAD on σn, with rϵ=0. Data are shifted for clarity. Increasing σn changes the power-law exponent approximately from α=2 to α=1. Since large subtrees are not well sampled, data beyond k>103 become noisy and, thus, are not informative. Inset shows the EADs plotted with full data. Other parameters used are μn=0, R0=10, and n0=1.
Fig. 6.
Fig. 6.
(A) Averaged C(A) for the modified model with a constant waiting time. Theoretical predictions from mean field analysis in SI Appendix for small niche construction strengths are also plotted. None shows power-law behavior. (B) Averaged C(A) for the modified model with a constant bifurcation rate. Mean-field analysis no longer applies to this case, and power-law behavior is still not recovered. For both plots, other parameters used are rϵ=0, μn=0, R0=100, and n0=1. The reference line is the power-law function C=A1.51. The simulated tree has 106 nodes, and the data are averaged over 10 repetitions. The Insets in A and B show the full data range, respectively.

Similar articles

Cited by

References

    1. Haig D., Hurst L. D., A quantitative measure of error minimization in the genetic code. J. Mol. Evol. 33, 412–417 (1991). - PubMed
    1. Koonin E. V., Novozhilov A. S., Origin and evolution of the universal genetic code. Annu. Rev. Genet. 51, 45–62 (2017). - PubMed
    1. Vetsigian K., Woese C., Goldenfeld N., Collective evolution and the genetic code. Proc. Natl. Acad. Sci. U.S.A. 103, 10696–10701 (2006). - PMC - PubMed
    1. Hernandez-Garcia E., Tuğrul M., Alejandro Herrada E., Eguiluz V. M., Klemm K., Simple models for scaling in phylogenetic trees. Int. J. Bifurcation Chaos 20, 805–811 (2010).
    1. Herrada E. A., et al. , Universal scaling in the branching of the tree of life. PloS One 3, e2757 (2008). - PMC - PubMed

Publication types

LinkOut - more resources