. 2020 Mar 24;11(2):e02841-19.
doi: 10.1128/mBio.02841-19.

Glycemic Variability in Diabetes Increases the Severity of Influenza

Affiliations

Glycemic Variability in Diabetes Increases the Severity of Influenza

Rebecca J Marshall et al. mBio. .

Abstract

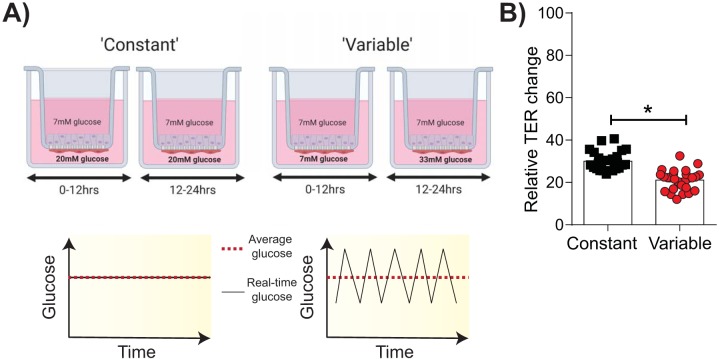
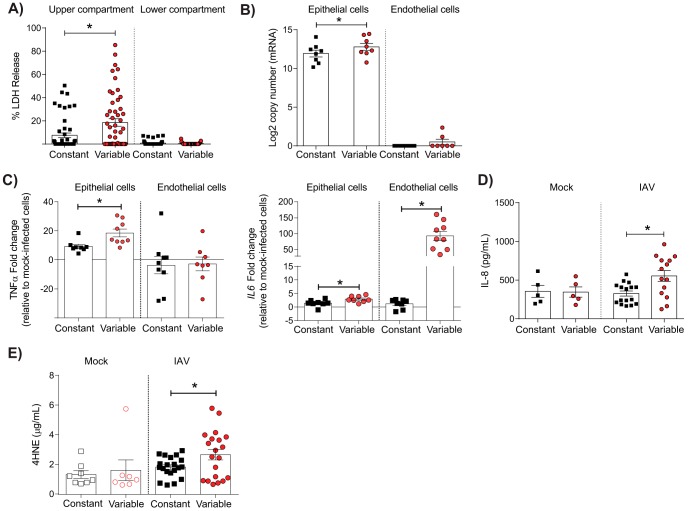
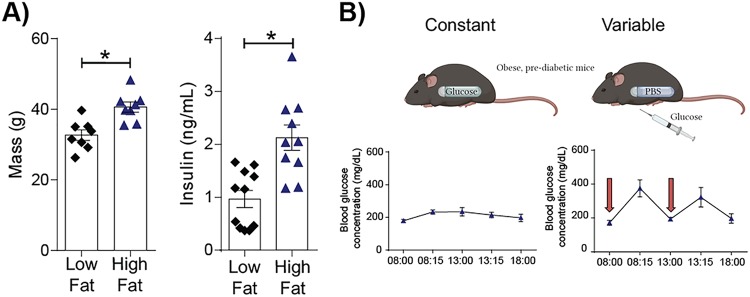
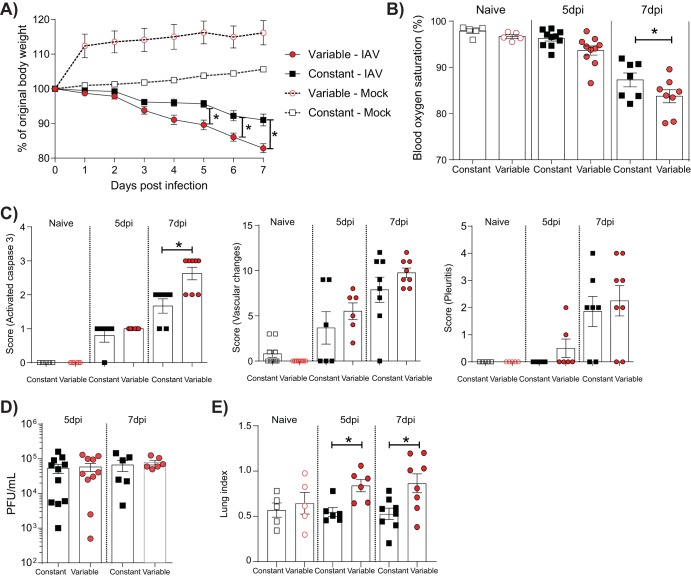
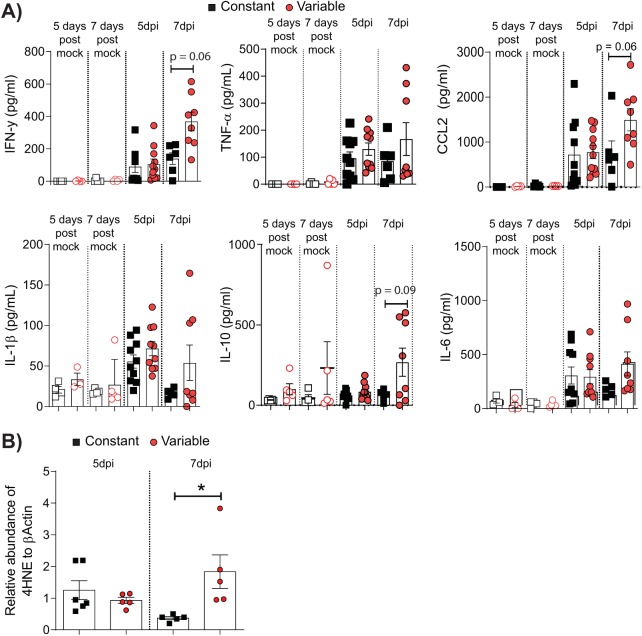
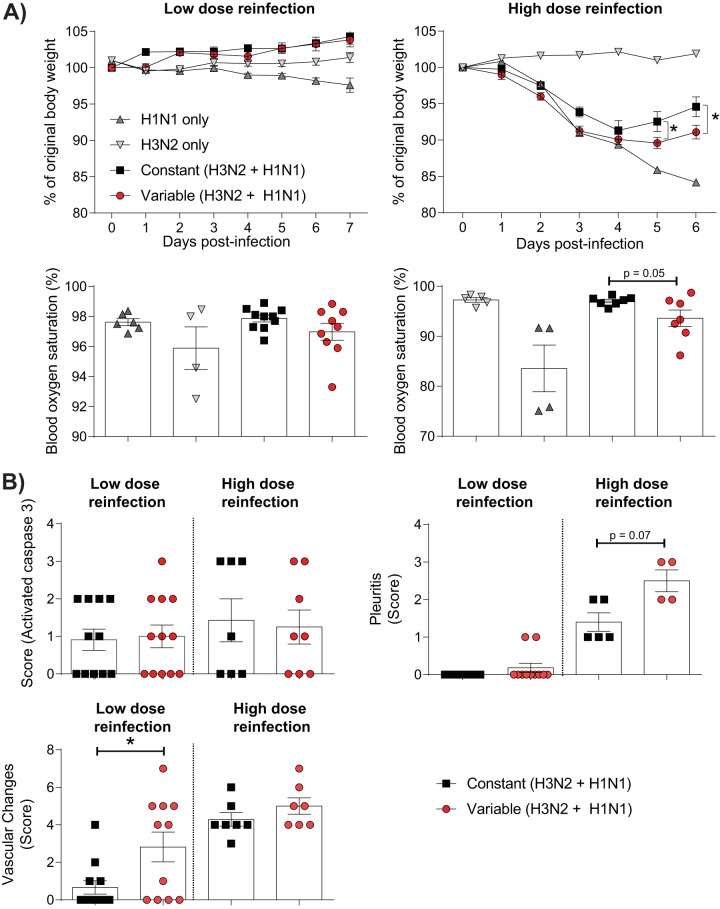
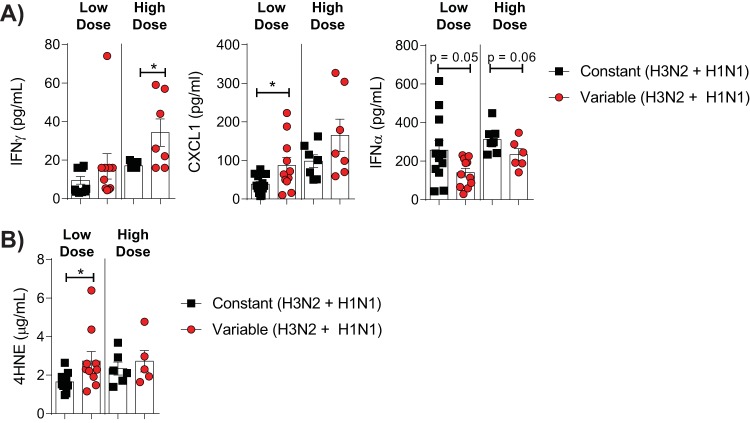
People with diabetes are two times more likely to die from influenza than people with no underlying medical condition. The mechanisms underlying this susceptibility are poorly understood. In healthy individuals, small and short-lived postprandial peaks in blood glucose levels occur. In diabetes mellitus, these fluctuations become greater and more frequent. This glycemic variability is associated with oxidative stress and hyperinflammation. However, the contribution of glycemic variability to the pathogenesis of influenza A virus (IAV) has not been explored. Here, we used an in vitro model of the pulmonary epithelial-endothelial barrier and novel murine models to investigate the role of glycemic variability in influenza severity. In vitro, a history of glycemic variability significantly increased influenza-driven cell death and destruction of the epithelial-endothelial barrier. In vivo, influenza virus-infected mice with a history of glycemic variability lost significantly more body weight than mice with constant blood glucose levels. This increased disease severity was associated with markers of oxidative stress and hyperinflammation both in vitro and in vivo Together, these results provide the first indication that glycemic variability may help drive the increased risk of severe influenza in people with diabetes mellitus.IMPORTANCE Every winter, people with diabetes are at increased risk of severe influenza. At present, the mechanisms that cause this increased susceptibility are unclear. Here, we show that the fluctuations in blood glucose levels common in people with diabetes are associated with severe influenza. These data suggest that glycemic stability could become a greater clinical priority for patients with diabetes during outbreaks of influenza.

Keywords: blood glucose; diabetes; influenza.


Figures

FIG 1
FIG 1
Glycemic variability increases IAV-induced damage of the epithelial-endothelial barrier in vitro. (A) Schematic representation of the in vitro system used to model constant and variable blood glucose levels. Image created with BioRender. (B) Transepithelial electrical resistance (TER) 24 h after infection with IAV [A/Solomon Islands/03/2006(H1N1)]. Data are expressed relative to those for both the specific well’s baseline TER (i.e., prior to infection) and the mock-inoculated wells for the respective treatment groups. Data were pooled from three independent experiments, and the mean ± SEM is shown. Statistical significance was determined using a Mann-Whitney test. Statistical significance is indicated (*, P < 0.05).
FIG 2
FIG 2
Glycemic variability is associated with IAV-induced cell death, viral replication, inflammation, and oxidative stress in vitro. (A) Lactose dehydrogenase levels in the upper and lower compartments of cocultures at 24 h post-IAV infection. Percent LDH release was calculated relative to the level for mock-infected cells in each treatment group (defined as 0%). (B) IAV mRNA copy number in epithelial and endothelial cells at 24 h post-IAV infection. (C) Expression of the genes for TNF-α (left) and IL-8 (right) at 24 h post-IAV infection. Fold change was calculated using the ΔΔCT method and is expressed relative to the value for the mock-infected controls. (D) IL-8 concentration in the lower compartment of the coculture at 24 h post-IAV infection. (E) Release of 4-hydroxynonena (4HNE)-protein adducts in the lower compartment of cocultures at 24 h post-mock or IAV infection. Data were pooled from a minimum of three independent experiments, and the mean ± SEM is shown. Statistical significance was determined using a Student’s unpaired t test (for data that were normally distributed) or a Mann-Whitney test (for data that were not normally distributed). Statistical significance is indicated (*, P < 0.05).
FIG 3
FIG 3
A novel murine model of glycemic variability. (A) Body weight (left) and serum insulin levels (right) of mice on a high-fat or a low-fat diet for 10 weeks. Data were pooled from a minimum of two independent experiments (the mean ± SEM is shown). Statistical significance was determined using a Student’s unpaired t test (for data that were normally distributed) or a Mann-Whitney test (for data that were not normally distributed). Statistical significance is indicated (*, P < 0.05). (B) The 10-h blood glucose profile in mice implanted with a continuous glucose pump (left) or a pump loaded with PBS (right). Mice with a PBS pump (i.e., mice under the variable glucose condition) were administered twice-daily glucose injections i.p. (the timing is indicated by a red arrow). Data were pooled from two independent experiments, with data points representing mean blood glucose levels ± SEM (3 mice per group).
FIG 4
FIG 4
Glycemic variability increases the severity of IAV infection in vivo. (A) Percent weight loss of IAV- or mock-inoculated mice with a history of variable or constant blood glucose levels. Weights are displayed as the percentage of the weight at the time of inoculation. (B) Percent blood oxygen saturation of IAV-infected and uninfected mice on various days postinfection (dpi). (C) Histopathology scoring of lung sections for activated caspase 3 (left), vascular changes (middle), and pleuritis (right). (D) Pulmonary viral titers of mice with constant or variable blood glucose levels. (E) Lung index in mice with constant or variable blood glucose levels. The lung index was calculated as [lung weight (in grams)/body weight (in grams)] × 100. Data were pooled from a minimum of two independent experiments, and the mean ± SEM is shown. Statistical significance was determined using a 2-way analysis of variance with Tukey’s post hoc test or a Student’s unpaired t test (for data that were normally distributed), or a Mann-Whitney test (for data that were not normally distributed). Statistical significance is indicated (*, P < 0.05).
FIG 5
FIG 5
Glycemic variability increases IAV-induced pulmonary inflammation and oxidative stress in vivo. (A) Cytokines in lung homogenates at various days postinfection (dpi). (B) The presence of 4-hydroxynonenal (4HNE)-protein adducts in the lung homogenates of IAV-inoculated mice detected by immunoblotting. Data are expressed relative to the β-actin levels detected in the same sample. Data were pooled from a minimum of two independent experiments, and the mean ± SEM is shown. Statistical significance was determined using a Student’s unpaired t test (for data that were normally distributed) or a Mann-Whitney test (for data that were not normally distributed). Statistical significance is indicated (*, P < 0.05).
FIG 6
FIG 6
Glycemic variability increases the severity of IAV infection in vivo after reinfection. (A) (Top) Percent weight loss of IAV- or mock-inoculated mice with a history of variable or constant blood glucose levels. Weights are displayed as a percentage of the weight at the time of inoculation. Mice were reinfected with either a low (1,000-PFU) or a high (100,000-PFU) dose of A/PR/8(H1N1). (Bottom) Percent blood oxygen saturation of IAV-infected mice at 7 (low dose) or 6 (high dose) days after reinfection. (B) Histopathology scoring of lung sections for activated caspase 3, vascular changes, and pleuritis at 7 (low dose) or 6 (high dose) days after reinfection. Statistical significance was determined using a 2-way analysis of variance with Tukey’s post hoc test or a Student’s unpaired t test (for data that were normally distributed) or a Mann-Whitney test (for data that were not normally distributed).
FIG 7
FIG 7
Glycemic variability increases IAV-induced pulmonary inflammation and oxidative stress after reinfection. (A) Cytokines in lung homogenates of mice reinfected with either a low (1,000-PFU) or a high (100,000-PFU) dose of A/PR/8(H1N1). (B) Concentration of 4-hydroxynonenal (4HNE)-protein adducts in the lung homogenates of IAV-infected mice. All data were obtained at either 7 (low dose) or 6 (high dose) days of infection. Data were pooled from a minimum of two independent experiments, and the mean ± SEM is shown. Statistical significance was determined using a Student’s unpaired t test (for data that were normally distributed) or a Mann-Whitney test (for data that were not normally distributed). Statistical significance is indicated (*, P < 0.05).

Similar articles

Cited by

References

    1. Allard R, Leclerc P, Tremblay C, Tannenbaum T-N. 2010. Diabetes, and the severity of pandemic influenza A (H1N1) infection. Diabetes Care 33:1491–1493. doi:10.2337/dc09-2215. - DOI - PMC - PubMed
    1. Wilking H, Buda S, von der Lippe E, Altmann D, Krause G, Eckmanns T, Haas W. 2010. Mortality of 2009 pandemic influenza A (H1N1) in Germany. Euro Surveill 15(49):pii=19741. doi:10.2807/ese.15.49.19741-en. - DOI - PubMed
    1. Goeijenbier M, van Sloten TT, Slobbe L, Mathieu C, van Genderen P, Beyer WEP, Osterhaus ADME. 2017. Benefits of flu vaccination for persons with diabetes mellitus: a review. Vaccine 35:5095–5101. doi:10.1016/j.vaccine.2017.07.095. - DOI - PubMed
    1. Reading PC, Allison J, Crouch EC, Anders EM. 1998. Increased susceptibility of diabetic mice to influenza virus infection: compromise of collectin-mediated host defense of the lung by glucose? J Virol 72:6884–6887. doi:10.1128/JVI.72.8.6884-6887.1998. - DOI - PMC - PubMed
    1. Wu J, Zhang F, Fang F, Chang H, Wang F, Yang Z, Sun B, Chen Z. 2010. Efficacy of inactivated vaccine against H5N1 influenza virus infection in mice with type 1 diabetes. Vaccine 28:2775–2781. doi:10.1016/j.vaccine.2010.01.037. - DOI - PubMed

Publication types

MeSH terms