Comparative Study
. 2020 Mar 24;11(2):e03068-19.
doi: 10.1128/mBio.03068-19.

Localized Hypermutation is the Major Driver of Meningococcal Genetic Variability during Persistent Asymptomatic Carriage

Affiliations
Comparative Study

Localized Hypermutation is the Major Driver of Meningococcal Genetic Variability during Persistent Asymptomatic Carriage

Luke R Green et al. mBio. .

Abstract

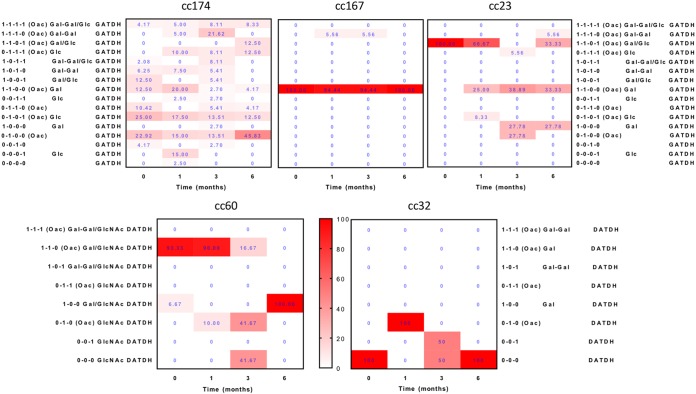
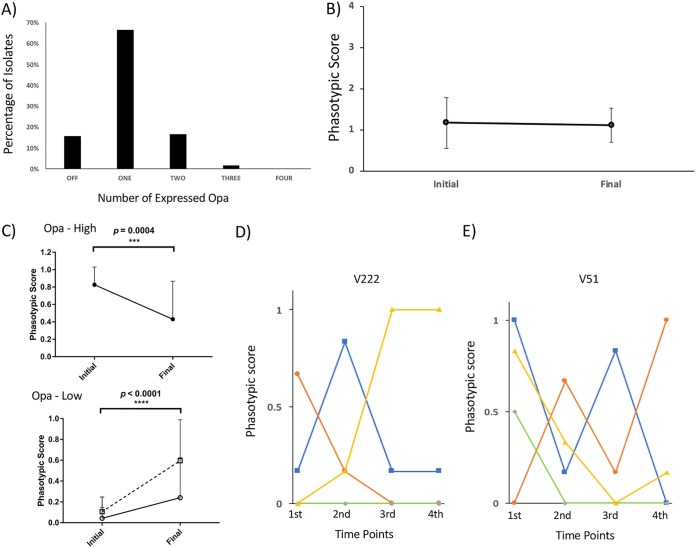
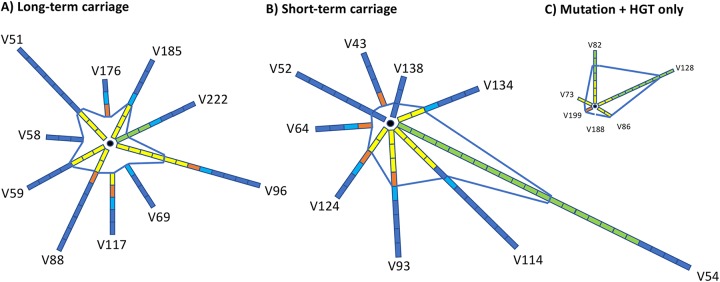
Host persistence of bacteria is facilitated by mutational and recombinatorial processes that counteract loss of genetic variation during transmission and selection from evolving host responses. Genetic variation was investigated during persistent asymptomatic carriage of Neisseria meningitidis Interrogation of whole-genome sequences for paired isolates from 25 carriers showed that de novo mutations were infrequent, while horizontal gene transfer occurred in 16% of carriers. Examination of multiple isolates per time point enabled separation of sporadic and transient allelic variation from directional variation. A comprehensive comparative analysis of directional allelic variation with hypermutation of simple sequence repeats and hyperrecombination of class 1 type IV pilus genes detected an average of seven events per carrier and 2:1 bias for changes due to localized hypermutation. Directional genetic variation was focused on the outer membrane with 69% of events occurring in genes encoding enzymatic modifiers of surface structures or outer membrane proteins. Multiple carriers exhibited directional and opposed switching of allelic variants of the surface-located Opa proteins that enables continuous expression of these adhesins alongside antigenic variation. A trend for switching from PilC1 to PilC2 expression was detected, indicating selection for specific alterations in the activities of the type IV pilus, whereas phase variation of restriction modification (RM) systems, as well as associated phasevarions, was infrequent. We conclude that asymptomatic meningococcal carriage on mucosal surfaces is facilitated by frequent localized hypermutation and horizontal gene transfer affecting genes encoding surface modifiers such that optimization of adhesive functions occurs alongside escape of immune responses by antigenic variation.IMPORTANCE Many bacterial pathogens coexist with host organisms, rarely causing disease while adapting to host responses. Neisseria meningitidis, a major cause of meningitis and septicemia, is a frequent persistent colonizer of asymptomatic teenagers/young adults. To assess how genetic variation contributes to host persistence, whole-genome sequencing and hypermutable sequence analyses were performed on multiple isolates obtained from students naturally colonized with meningococci. High frequencies of gene transfer were observed, occurring in 16% of carriers and affecting 51% of all nonhypermutable variable genes. Comparative analyses showed that hypermutable sequences were the major mechanism of variation, causing 2-fold more changes in gene function than other mechanisms. Genetic variation was focused on genes affecting the outer membrane, with directional changes in proteins responsible for bacterial adhesion to host surfaces. This comprehensive examination of genetic plasticity in individual hosts provides a significant new platform for rationale design of approaches to prevent the spread of this pathogen.

Keywords: Neisseria meningitidis; horizontal gene transfer; localized hypermutation; meningitis; meningococcus; phase variation; whole-genome sequence.


Figures

FIG 1
FIG 1
Core genome phylogenetic tree for 25 pairs of short- and long-term persistent carriage isolates. Persistent carriage isolates were chosen from volunteers, all first-year students that were part of a longitudinal carriage study at the University of Nottingham. For 25 volunteers, one isolate was chosen from the first and last time point where persistent carriage was observed and subject to WGS by Illumina HiSeq. Analysis of the PV states of 14 SSR-containing genes was also performed on multiple isolates for 21 volunteers. (A) Sampling times, the distribution of carriers with respect to long-term (Lo; 5 to 6 months) and short-term (Sh; 1 to 3 months) carriage, and the number of carriers whose isolates were subject to WGS (genomic) and/or PV analysis. (B) Phylogenetic tree derived using a subset of the Neisseria core genes (n = 215) and iTOL from whole-genome sequences generated on an Illumina HiSeq platform. The specific volunteers (see Table 1 for isolate names for each volunteer) in each group are: Lo1, V51, V58, V59, V73, V86, V88, V117, V128, V176, V185, V188, and V222; Lo2, V69, V82, and V96; Sh3, V43 and V93; Sh4, V52, V54, V64, V114, V124, V134, V138, and V199; Sh5, V113, and V115. Individual branches of the tree are labeled with the clonal complex (cc) and genogroup (capsule type). The volunteer for each isolate is also indicated (there is a single label where two or more isolates are on adjacent branches).
FIG 2
FIG 2
Whole-genome variation during persistent carriage. Allelic variation in coding regions was derived from the whole-genome sequences of 12 to 39 isolates per carrier for six carriers. The distribution of the allelic variation and relatedness of isolates was visualized using GrapeTree and manual manipulation of branch positions. Isolates are color coded for time point of isolation (Fig. 1): red, first; blue, second; yellow, third; green, fourth. Genes subject to variation between each node are indicated using gene names or NEIS numbers (see https://pubmlst.org/neisseria/) with alternate types of variation in the same gene indicated by a low dash and number. The clonal complexes of isolates were either cc174 (V51 and V59) or cc23 (V69, V93, V96, and V222).
FIG 3
FIG 3
High-level temporal and spatial allelic variation in the meningococcal PilE protein deduced from pilE genes. An alignment of the amino acid sequences of the PilE protein for 24 isolates from carrier V222 are shown. Sequences were derived by Sanger sequencing of PCR products spanning the pilE gene. Isolates were derived from four different time points representing up to 6 months of carriage, with 6 isolates per time point (Fig. 1).
FIG 4
FIG 4
Combinatorial changes in PV modules during persistent meningococcal carriage. Repeat numbers were derived for each phase-variable gene by fragment analysis of PCR products spanning the relevant repeat tract. Expression states were derived from the repeat numbers and associations between repeat number and translational state (“on” and “off” coded as 1 and 0, respectively). Individual phasotypic scores for the initial and final point of observed carriage for each carrier were derived from analysis of ∼6 isolates per time point. Average phasotypic scores and standard deviations were derived from the following numbers of carriers for each clonal complex: 8, cc174; 3, cc167: 4, cc23; 5, cc60; and 1, cc32. Statistical differences between the initial and final times were determined using a Wilcoxon rank sum test in Prism. The PV modules consisted of the following genes: (A) pilin modulation, pilC1 and pilC2; (B) pilin glycosylation, pglA, pglE, pglH, and pglI; (C) LOS, lgtG and NMB1255; (D) restriction modification, modA and modB. Note that the maximum phasotypic score occurs when all genes within a module are in an “on” state (thus a module of four phase-variable genes has a maximum score of 4).
FIG 5
FIG 5
Putative phenotypic effects of phase-variable changes in the pilin glycosylation module. The longitudinal changes in the proportions of carriage isolates associated with the putative glycan structures of each phasotype are shown. The four-gene phasotype represents the expression states of the pglA, pglI, pglE, and pglH genes, the products of which are responsible for the addition of the first galactose, an acetyl group, a second galactose, and a glucose moiety, respectively, to the basal sugar. Addition of the second galactose by PglE requires prior addition of the first galactose by PglA, while PglH competes with PglA for addition of glucose to the same acceptor position. The basal sugar, GATDH or DATDH, is determined by PglB2 or PglB, respectively, and differs among clonal complexes. The percentage values were calculated by determining the number of isolates across multiple carriers with a specific phasotype and dividing by the total number of analyzed isolates for each time point. Boxes are colored according to the heat map shown by the bar between the lower panels and ranges from white (0% of isolates) to bright red (100% of isolates). Note that the cc60 and cc32 meningococci lacked the pglH gene, resulting in a three-gene phasotype for these lineages. The total numbers of isolates analyzed for each clonal complex for the four time points were as follows: cc174 (48, 40, 37, 24); cc167 (14, 14, 18, 6); cc23 (6, 24, 18, 18); cc60 (30, 30, 12, 6); and cc32 (6, 6, 6, 1).
FIG 6
FIG 6
Directional and opposing PV of Opa proteins during longitudinal meningococcal carriage. The expression states of the Opa proteins were derived from analyses of gene sequences and pentanucleotide repeat numbers for all four loci of each isolate. (A) Percentages of 392 isolates from 19 carriers that had an “on” expression state in none (“off”) to one or more loci. (B) Average phasotypic scores for the Opa module for the initial and final time points of observed carriage for these carriers (note that the maximum score is 4; error bars are standard deviations). (C) Change in phasotypic scores for individual opa genes across multiple carriers for loci starting with a high level of isolates in either an “on” or “off” state. Loci were split by the overall expression state in the initial time point for each carrier into three categories: (i) 50% or more of isolates in the “on” state (Opa-high, 24 loci) (top); (ii) <50% of isolates in the “on” state (Opa-low, black line/open circles, 52 loci) (bottom); (iii) <50% of isolates in the “on” state but excluding carriers where there was no change in expression between the initial and final time points (Opa-low, dotted line/open squares, 21 loci). (D and E) Changes in expression of individual Opa loci for multiple time points of two carriers. Phasotypic scores are the averages from multiple isolates per time point. Blue line, OpaA; orange line, OpaB; green line, OpaD; yellow line, OpaJ.
FIG 7
FIG 7
Relative contributions of LH, mutation, and horizontal gene transfer to functional variation during persistent meningococcal carriage. These diagrams depict the relative amounts of different types of genetic variation occurring during natural asymptomatic carriage of meningococci in 23 university students. Each spoke represents the proportion and type of variation relative to a different but homogeneous starting population, indicated by the black circle. We show only genetic variation that alters the amino acid sequence or expression state of genes and has been putatively or probably fixed in the population (note that fixation was determined by comparison of multiple colonies and time points for all PV and the majority of mutation and HGT events). Each rectangle represents either a single gene or a recombination fragment containing one or more variable genes. The rectangles are colored coded to represent different types of recombination events: dark blue, PV; light blue, antigenic variation of the PilE protein; orange, indel; yellow, mutation; green, recombination due to horizontal gene transfer. The blue lines separate events affecting outer membrane proteins or structures on the outside from other functional groups on the inside. (A) Long-term carriage of 5 to 6 months; (B) short-term carriage of 1 to 3 months; (C) carriers where only mutation and HGT has been assessed.

References

    1. Althouse BM, Hanley KA. 2015. The tortoise or the hare? Impacts of within-host dynamics on transmission success of arthropod-borne viruses. Philos Trans R Soc Lond B Biol Sci 370:20140299. doi:10.1098/rstb.2014.0299. - DOI - PMC - PubMed
    1. Lipsitch M, Moxon ER. 1997. Virulence and transmissibility of pathogens: what is the relationship? Trends Microbiol 5:31–37. doi:10.1016/S0966-842X(97)81772-6. - DOI - PubMed
    1. Monack DM. 2012. Salmonella persistence and transmission strategies. Curr Opin Microbiol 15:100–107. doi:10.1016/j.mib.2011.10.013. - DOI - PubMed
    1. Georgieva M, Buckee CO, Lipsitch M. 2019. Models of immune selection for multi-locus antigenic diversity of pathogens. Nat Rev Immunol 19:55–62. doi:10.1038/s41577-018-0092-5. - DOI - PMC - PubMed
    1. Moxon ER, Rainey PB, Nowak MA, Lenski R. 1994. Adaptive evolution of highly mutable loci in pathogenic bacteria. Curr Biol 4:24–33. doi:10.1016/s0960-9822(00)00005-1. - DOI - PubMed

Publication types

Substances

LinkOut - more resources