. 2020 Mar 23;10(3):488.
doi: 10.3390/biom10030488.

BMP-SMAD1/5 Signaling Regulates Retinal Vascular Development

Affiliations

BMP-SMAD1/5 Signaling Regulates Retinal Vascular Development

Andreas Benn et al. Biomolecules. .

Abstract

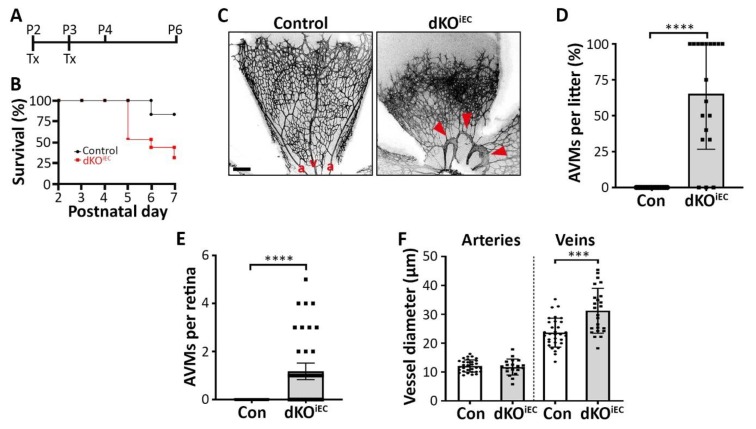
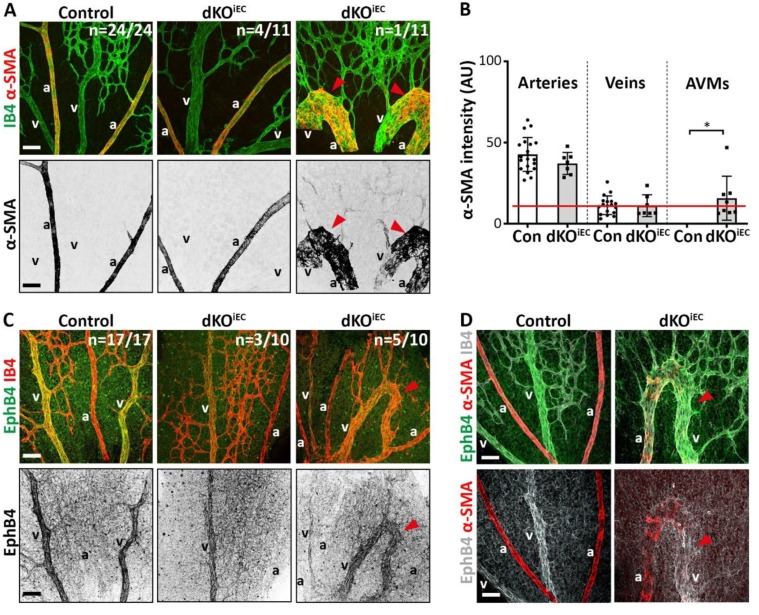
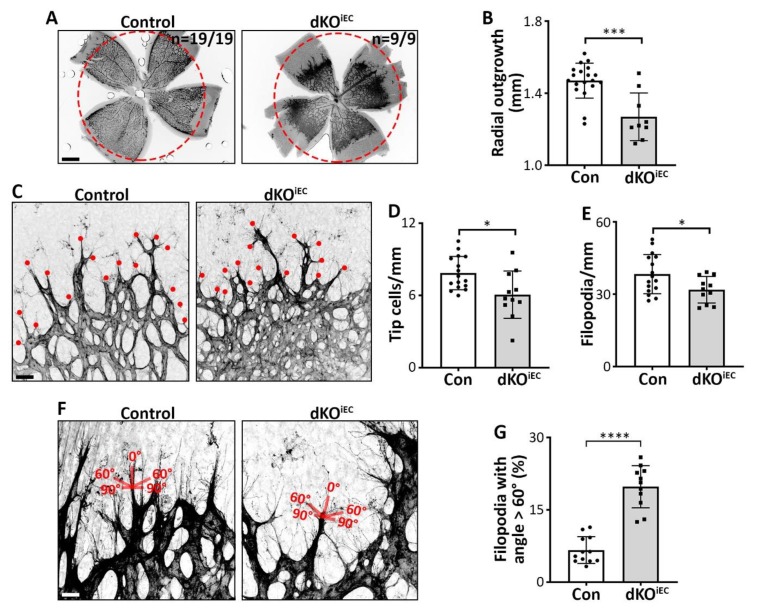
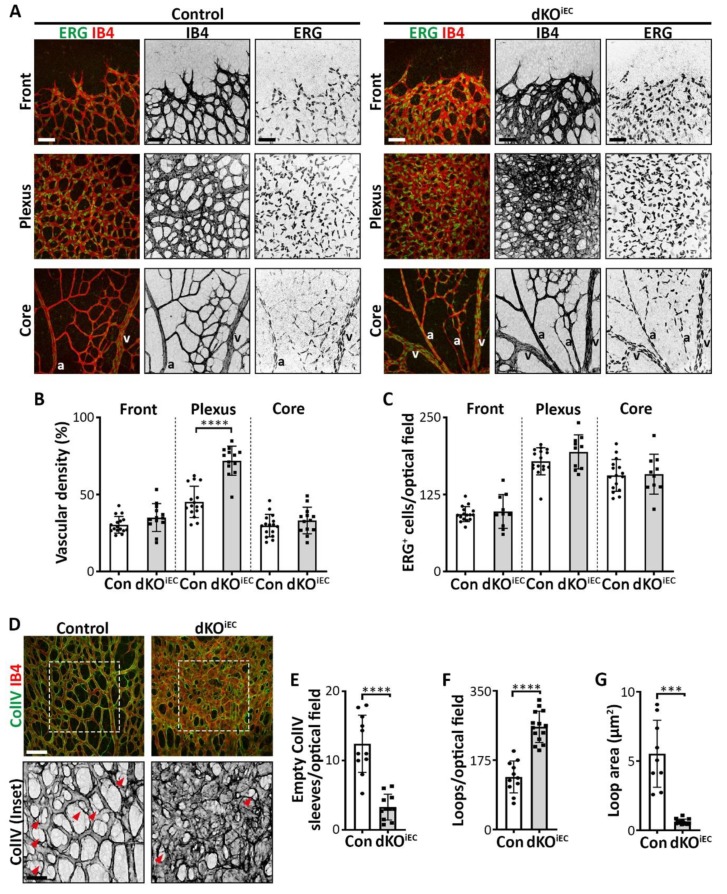
Vascular development is an orchestrated process of vessel formation from pre-existing vessels via sprouting and intussusceptive angiogenesis as well as vascular remodeling to generate the mature vasculature. Bone morphogenetic protein (BMP) signaling via intracellular SMAD1 and SMAD5 effectors regulates sprouting angiogenesis in the early mouse embryo, but its role in other processes of vascular development and in other vascular beds remains incompletely understood. Here, we investigate the function of SMAD1/5 during early postnatal retinal vascular development using inducible, endothelium-specific deletion of Smad1 and Smad5. We observe the formation of arterial-venous malformations in areas with high blood flow, and fewer and less functional tip cells at the angiogenic front. The vascular plexus region is remarkably hyperdense and this is associated with reduced vessel regression and aberrant vascular loop formation. Taken together, our results highlight important functions of SMAD1/5 during vessel formation and remodeling in the early postnatal retina.

Keywords: BMP signaling; SMAD1/5; arteriovenous malformations; intussusceptive angiogenesis; retina development; sprouting angiogenesis; vessel regression.


Conflict of interest statement

The authors declare no conflicts of interest.

Figures

Figure 1
Figure 1
Endothelium-specific Smad1/5 deletion results in arteriovenous malformation (AVM) formation in the retina. (A) Tamoxifen (Tx) treatment regime. Mice were injected with Tx at postnatal day 2 (P2) and P3, and analyzed at P4 or P6. (B) Survival rates of Tx-treated mice. Control n = 18. dKOiEC n = 15. (C) Isolectin B4 (IB4) staining of Tx-treated control and double knockout mice (dKOiEC) retinas at P6. Red arrowheads indicate AVMs. a = artery. v = vein. Scale bar: 200 µm. (D) Quantification of AVMs in Tx-treated litters and (E) number of AVMs per retina at P6. 19 litters with control n = 82 and dKOiEC n = 49. (F) Quantification of inner vessel diameter of arteries and veins in Tx-treated mice at P6. Control n = 31. dKOiEC n = 19. *** p < 0.001; **** p < 0.0001.
Figure 2
Figure 2
Arterial- and venous-associated markers localize normally in dKOiEC. (A) IB4 (green) and alpha smooth muscle actin (α-SMA, red) staining of Tx-treated control (n = 24) and dKOiEC (n = 11; 4/11 without AVM formation; 6/11 with α-SMA-negative AVMs; 1/11 with α-SMA-positive AVM) retinas at P6. α-SMA grayscale images are shown for visual clarity. (B) Quantification of α-SMA signal intensity per vessel type (arteries, veins, AVMs) in Tx-treated mice at P6. The red line indicates background noise level. (C) Ephrin type b receptor 4 (EphB4, green) and IB4 (red) staining of Tx-treated control (n = 17) and dKOiEC (n = 10; 3/10 without AVM formation; 2/10 with EphB4-negative AVMs; 5/10 with EphB4-positive AVMs) retinas at P6. EphB4 grayscale images are shown for visual clarity. (D) EphB4 (green/white), α-SMA (red) and IB4 (white) staining of Tx-treated control and dKOiEC retinas at P6. Red arrowheads indicate AVMs. a = artery. v = vein. Scale bar: 50 µm. * p < 0.05.
Figure 3
Figure 3
SMAD1/5 signaling regulates tip cell formation and function. (A) IB4 staining of Tx-treated control and dKOiEC retinas at P6. The red dotted circle indicates radial outgrowth from control mice. Scale bar: 500 µm. (B) Quantification of radial outgrowth in Tx-treated mice at P6. Control n = 19. dKOiEC n = 9. (C) IB4 staining of Tx-treated control and dKOiEC retinas at P6. The red dots indicate tip cells. Scale bar: 25 µm. (D) Quantification of tip cells and (E) tip cell filopodia in Tx-treated mice at P6. Control n = 16. dKOiEC n = 11. (F) IB4 staining of Tx-treated control and dKOiEC at P6. The scheme represents the angle of filopodia from respective tip cells. Scale bar: 10 µm. (G) Quantification of filopodia with an angle > 60° respective to their tip cell in Tx-treated mice at P6. Control n = 12. dKOiEC n = 11. * p < 0.05; *** p < 0.001; **** p < 0.0001.
Figure 4
Figure 4
dKOiEC mice show increased vascular density, reduced vessel regression and more abundant loop formation in the retinal plexus region. (A) ERG (green) and IB4 (red) staining of Tx-treated control and dKOiEC retinas at P6. Retinal leaflets have been divided into three distinct regions: (i) the frontal region with migrating tip cells; (ii) the intermediate remodeling plexus region; and (iii) the mature core region around the optic nerve. Grayscale images of IB4 and ERG staining are shown for visual clarity. a = artery. v = vein. Scale bar: 50 µm. (B) Quantification of vascular density at the retinal vascular frontal, plexus and core regions of Tx-treated mice at P6. Control n = 16. dKOiEC n = 13. (C) Quantification of ERG+ ECs at the retinal vascular frontal, plexus and core regions of Tx-treated mice at P6. Control n = 16. dKOiEC n =10. (D) Collagen IV (ColIV, green) and IB4 (red) staining of Tx-treated control and dKOiEC retinas at P6. ColIV grayscale images are shown for visual clarity. White dotted box highlights enlarged inset. Red arrows indicate empty ColIV sleeves. Scale bars: 50 µm (upper panel) and 25 µm (inset). (E) Quantification of empty ColIV sleeves in the retinal plexus region of Tx-treated mice at P6. Control n = 11. dKOiEC = 11. (F,G) Quantification of the number of vascular loops and the mean vascular loop area in the retinal plexus region of Tx-treated mice at P6. Control n = 11. dKOiEC = 14. *** p < 0.001; **** p < 0.0001.

References

    1. Aspalter I.M., Gordon E., Dubrac A., Ragab A., Narloch J., Vizan P., Geudens I., Collins R.T., Franco C.A., Abrahams C.L., et al. Alk1 and Alk5 inhibition by Nrp1 controls vascular sprouting downstream of Notch. Nat. Commun. 2015;6:7264. doi: 10.1038/ncomms8264. - DOI - PMC - PubMed
    1. Garcia de Vinuesa A., Abdelilah-Seyfried S., Knaus P., Zwijsen A., Bailly S. BMP signaling in vascular biology and dysfunction. Cytokine Growth Factor Rev. 2016;27:65–79. doi: 10.1016/j.cytogfr.2015.12.005. - DOI - PubMed
    1. Jin Y., Muhl L., Burmakin M., Wang Y., Duchez A.C., Betsholtz C., Arthur H.M., Jakobsson L. Endoglin prevents vascular malformation by regulating flow-induced cell migration and specification through VEGFR2 signalling. Nat. Cell. Biol. 2017;19:639–652. doi: 10.1038/ncb3534. - DOI - PMC - PubMed
    1. Lee H.W., Chong D.C., Ola R., Dunworth W.P., Meadows S., Ka J., Kaartinen V.M., Qyang Y., Cleaver O., Bautch V.L., et al. Alk2/ACVR1 and Alk3/BMPR1A Provide Essential Function for Bone Morphogenetic Protein-Induced Retinal Angiogenesis. Arter. Thromb. Vasc. Biol. 2017;37:657–663. doi: 10.1161/ATVBAHA.116.308422. - DOI - PMC - PubMed
    1. Ola R., Kunzel S.H., Zhang F., Genet G., Chakraborty R., Pibouin-Fragner L., Martin K., Sessa W., Dubrac A., Eichmann A. SMAD4 Prevents Flow Induced Arteriovenous Malformations by Inhibiting Casein Kinase 2. Circulation. 2018;138:2379–2394. doi: 10.1161/CIRCULATIONAHA.118.033842. - DOI - PMC - PubMed

Publication types

LinkOut - more resources