. 2020 Mar 24;11(1):1535.
doi: 10.1038/s41467-020-15287-9.

Autophagy lipidation machinery regulates axonal microtubule dynamics but is dispensable for survival of mammalian neurons

Affiliations

Autophagy lipidation machinery regulates axonal microtubule dynamics but is dispensable for survival of mammalian neurons

A Negrete-Hurtado et al. Nat Commun. .

Abstract

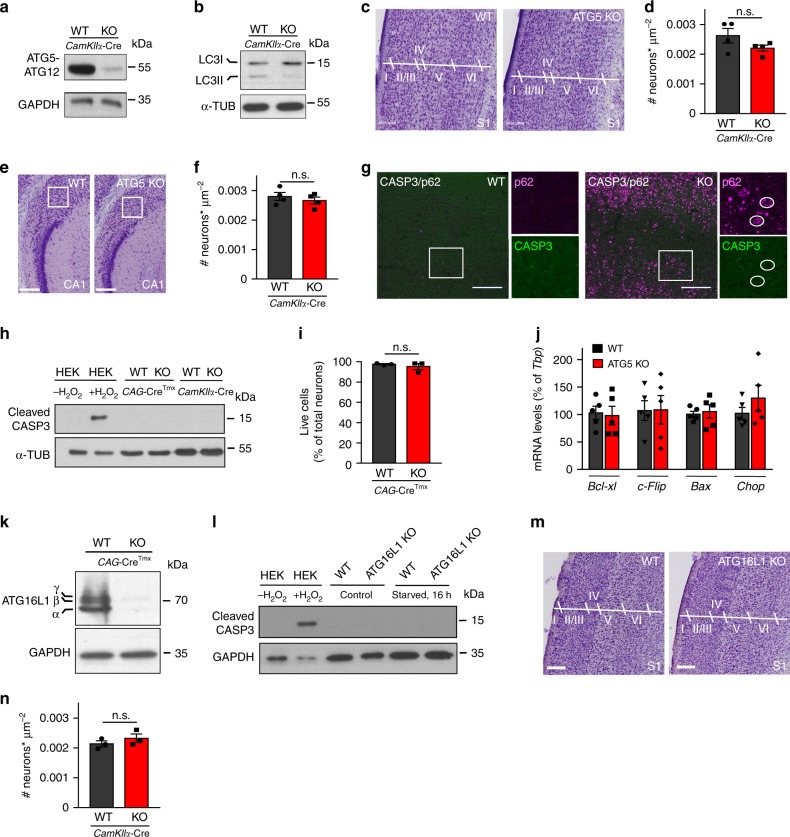
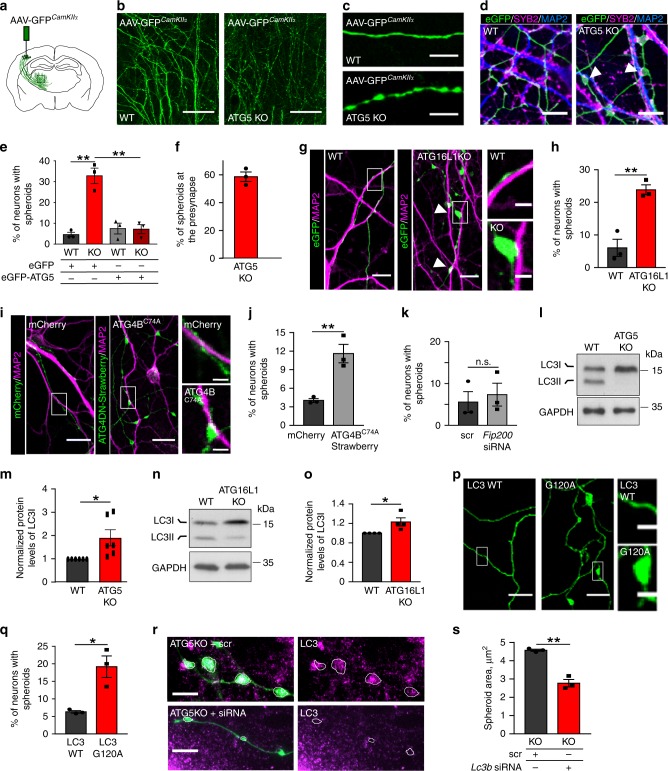
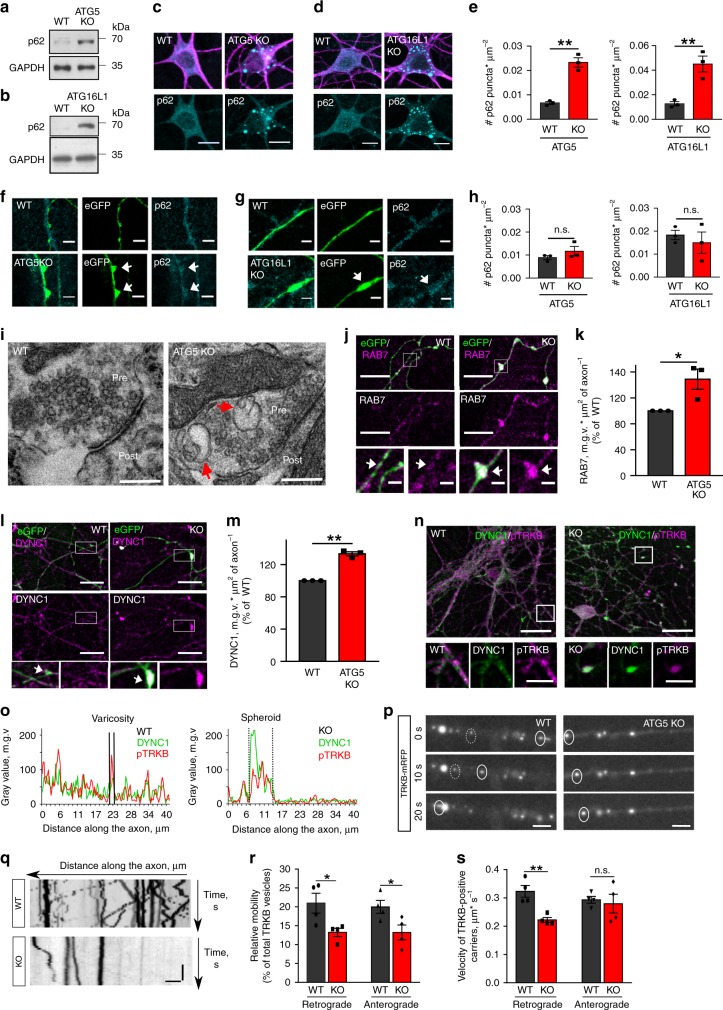
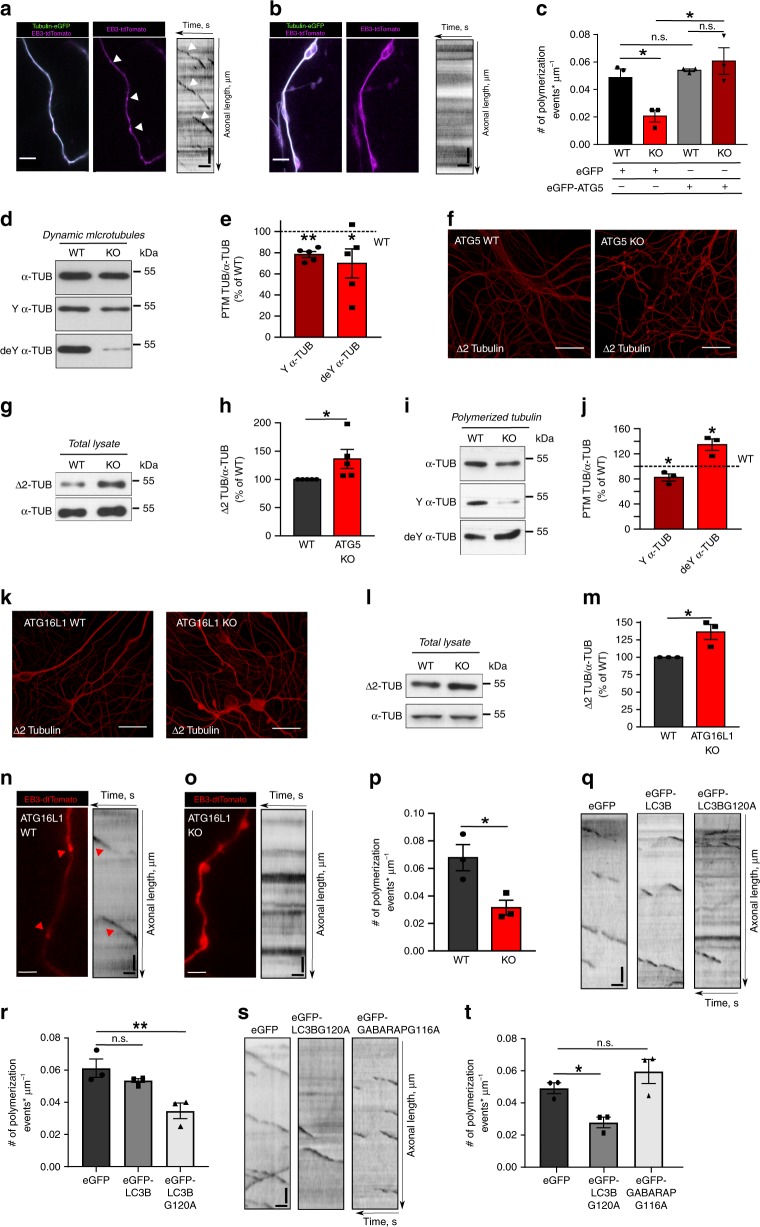
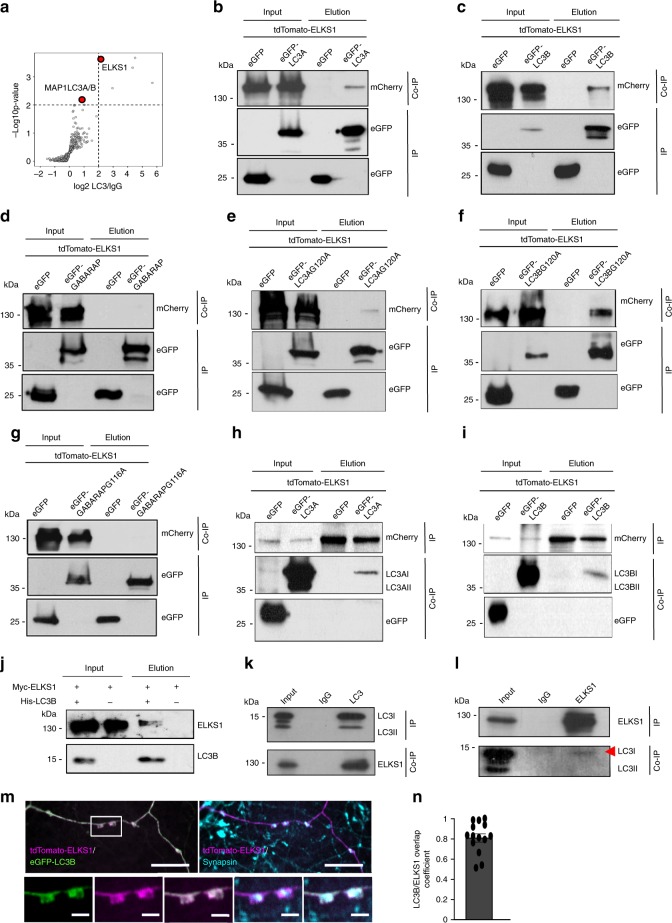
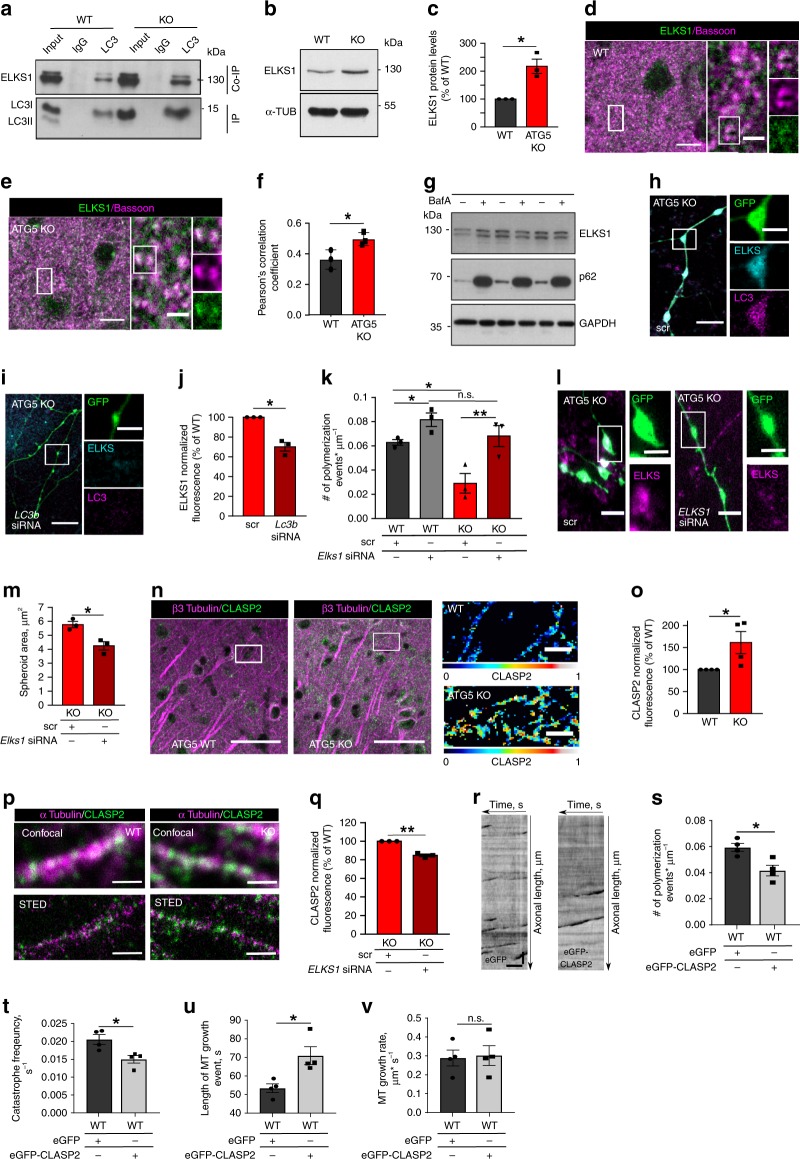
Neurons maintain axonal homeostasis via employing a unique organization of the microtubule (MT) cytoskeleton, which supports axonal morphology and provides tracks for intracellular transport. Abnormal MT-based trafficking hallmarks the pathology of neurodegenerative diseases, but the exact mechanism regulating MT dynamics in axons remains enigmatic. Here we report on a regulation of MT dynamics by AuTophaGy(ATG)-related proteins, which previously have been linked to the autophagy pathway. We find that ATG proteins required for LC3 lipid conjugation are dispensable for survival of excitatory neurons and instead regulate MT stability via controlling the abundance of the MT-binding protein CLASP2. This function of ATGs is independent of their role in autophagy and requires the active zone protein ELKS1. Our results highlight a non-canonical role of ATG proteins in neurons and suggest that pharmacological activation of autophagy may not only promote the degradation of cytoplasmic material, but also impair axonal integrity via altering MT stability.


Conflict of interest statement

The authors declare no competing interests.

Figures

Fig. 1
Fig. 1. Survival of excitatory neurons is dispensable of ATG5 and ATG16L1.
a ATG5 protein levels in cortical brain lysates from 13-weeks-old WT and ATG5 KO mice. b LC3 lipidation is defective in ATG5 KO brains. cf Histopathological analysis of Nissl-stained brain sections of ATG5 KO brains reveals unaltered number of cortical (c, d) (WT: 0.0026 ± 0.0002, KO: 0.0022 ± 0.0001. p = 0.163) and hippocampal neurons (e, f) (WT: 0.0028 ± 0.0003, KO: 0.0026 ± 0.0002. p = 0.465), N = 4 independent experiments each. Rectangular box in e depicts the hippocampal area used for quantification. Scale bars, 200 µm. g Representative confocal images of cortical brain sections from WT and ATG5 KO mice immunostained for cleaved Caspase-3 (CASP3, green) and co-immunostained for p62 (magenta). Rectangular boxes indicate areas magnified to the right. Circles in the KO indicate cells positive for p62, but negative for CASP3. Scale bars, 200 µm. h Immunoblot illustrating cleaved CASP3 levels in lysates from cultured neurons, as well as in cortical lysates from WT and ATG5 KO mice. HEK293T cells treated with H2O2 were used as a positive control. i Analysis of cellular viability using the Live/Dead cell assay in WT and ATG5 KO cultured neurons (WT: 97.55 ± 0.60%, KO: 95.25 ± 3.04%, p = 0.499, N = 3 independent experiments). j Bcl-xl, c-Flip, Bax, and Chop mRNA levels in cultured WT and ATG5 KO neurons. N = 5 independent experiments. mRNA levels were normalized to the levels of housekeeping gene Tbp set to 100%. k ATG16L1 protein levels in lysates from cultured WT and ATG16L1 KO neurons. l Cleaved CASP3 levels in lysates from cultured WT and ATG16L1 KO neurons, starved for 16 h or left untreated. HEK293T cells treated with H2O2 were used as a positive control. m, n Histopathological analysis of Nissl-stained cortical sections of ATG16L1 deficient brains at 13-weeks reveals no morphological alterations and unchanged number of neurons (WT: 0.0021 ± 0.0001, KO: 0.0023 ± 0.0001, p = 0.354, N = 3 independent experiments). Scale bar, 200 µm. All graphs show mean ± SEM, statistical analysis was performed by unpaired two-tailed Student’s t-test. n.s.-non-significant. Source data are provided as a Source Data file.
Fig. 2
Fig. 2. Loss LC3 lipidation machinery causes axonal neurodegeneration.
a Schematic illustration of stereotaxic delivery of AAV9-GFPCamKIIa into deep layers of primary motor cortex. b, c Loss of ATG5 causes en-passant swellings of long-range projection axons. Scale bar, (b) 200 µm, (c) 10 µm. d eGFP-transfected WT and ATG5 KO neurons immunostained for MAP2 and SYB2. Scale bar, 50 µm. e Percentage of WT and ATG5 KO neurons revealing axonal swellings when transfected either with eGFP (WT: 4.60 ± 1.09%, KO: 32.82 ± 3.70%) or with ATG5-eGFP (WT: 7.47 ± 2.60%, KO: 7.18 ± 2.20%). **pWTGFP vs. KOGFP = 0.001, **pWTATG5 vs. KOATG5 = 0.002. N = 3 independent experiments. f Axonal swellings are mostly found at presynapses (58.62 ± 0.81%). g, h Percentage of eGFP-transfected WT and ATG16L1 KO neurons with axonal swellings (WT: 6.05 ± 2.14%, KO: 23.85 ± 1.24%), **p = 0.004, N = 3 independent experiments. Scale bars: 10 µm, inserts 2 µm. i, j Percentage of mCherry-ATG4BC74A or pmStrawberry-ATG4BC74A (green)-transfected neurons revealing axonal swellings (mCherry: 4.03 ± 0.25%, pmStrawberry-Atg4BC74A 11.60 ± 1.22%). **p = 0.008. N = 3 independent experiments. Scale bars: 10 µm, inserts 2 µm. k Percentage of axonal swellings in neurons with Fip200 siRNA-mediated KD (scr:4.46 ± 2.40%, siRNA:5.78 ± 2.87%). p = 0.659. N = 4 independent experiments. lo LC3I protein levels are significantly increased in ATG5 KO (1.91 ± 0.35, *p = 0.023, N = 6 independent experiments) and ATG16L1 KO (1.23 ± 0.08, *p = 0.04, N = 4 independent experiments) lysates, compared to WT controls set to 1. p, q Percentage of ptagRFP-LC3B (proLC3)- or ptagRFP-LC3B G120A-expressing neurons with axonal swellings (ptagRFP- LC3B: 6.29 ± 0.30%, ptagRFP- LC3B G120A: 19.16 ± 2.50%). *p = 0.014. N = 3 independent experiments. Neurons were co-transfected with eGFP to visualize the axons. Scale bars: 4 µm, kymographs, 5 µm × 20 s. r, s Knockdown of LC3B in ATG5 KO neurons significantly decreases axonal spheroid area (KOscr: 4.57 ± 0.06 µm2, KOsiLC3b2.78 ± 0.20 µm2). **p = 0.001. N = 3 independent experiments. eGFP-expressing ATG5 KO neurons were treated either with scramble siRNA (scr) or LC3b siRNA and immunostained for LC3. Circles indicate en-passant axonal swellings. Scale bars: 5 µm. All graphs show mean ± SEM, statistical analysis was performed by unpaired two-tailed Student’s t‐test in (h, j, k, q, s), two-way ANOVA for multiple comparisons in (e) and by one-sample Student’s t‐test in (m, o). n.s.-non-significant. Total number of neurons in N experiments is shown in Supplementary Table 3. Source data are provided as a Source Data file.
Fig. 3
Fig. 3. Axonal swellings in autophagy-deficient neurons contain components of MT-based trafficking machinery.
a, b p62 levels in lysates from cultured WT, ATG5 KO (a) or ATG16L1 KO (b) neurons. ce Analysis of p62-containing puncta in somata of ATG5 KO and ATG16L1 KO neurons, immunostained for MAP2 (magenta) (WTATG5: 0.007 ± 0.001, KOATG5: 0.023 ± 0.002, **p = 0.001; WTATG16L1: 0.013 ± 0.002, KOATG16L1: 0.045 ± 0.007, **p = 0.009), N = 3 independent experiments. Scale bars: 5 µm. fh Analysis of p62-containing puncta in axons of ATG5 KO and ATG16L1 KO eGFP-transfected neurons (WTATG5: 0.009 ± 0.001, KOATG5: 0.012 ± 0.002, p = 0.131; WTATG16L1: 0.018 ± 0.002, KOATG16L1: 0.015 ± 0.005, p = 0.545), N = 3 independent experiments. Scale bars: 5 µm. i Electron micrographs of WT and ATG5 KO synapses. Endosomal intermediates are marked by red arrows. Scale bar: 200 nm. j, k RAB7 puncta density in WT and ATG5 KO axons (KO: 148.84 ± 15.63%). *p = 0.044. N = 3 independent experiments. Fluorescent levels in the KO were normalized to the WT set to 100%. Scale bars (j): 10 µm, 2 µm inserts. l, m DYNC1 puncta density in WT and ATG5 KO axons (KO: 133.26 ± 2.53%). **p = 0.003. N = 3 independent experiments. Fluorescent levels in the KO were normalized to the WT set to 100%. Scale bars (l): 10 µm, 2 µm inserts. n, o Confocal images (n) and fluorescent profiles (o) of WT and ATG5 KO neurons immunostained for DYNC1 and phosphorylated TRKB receptors (pTRKB). Scale bars: 30 µm, 10 µm inserts. p, q Time-lapse images and corresponding kymographs of TRKB-mRFP-expressing WT and ATG5 KO neurons. Scale bars: x: 5 µm, y: 10 s. r Loss of ATG5 significantly decreased the mobility of TRKB carriers compared to WT controls (WTRetro: 20.99 ± 2.63%, KORetro: 13.23 ± 1.09%, WTAntero: 20.00 ± 1.72%, KOAntero: 13.22 ± 1.97%). *pRetro = 0.034, *pAntero = 0.041, N = 4 independent experiments. s Loss of ATG5 significantly decreased the retrograde TRKB velocity compared to WT controls (WTRetro: 0.32 ± 0.02 µm * s−1, KORetro: 0.22 ± 0.01 µm * s−1, WTAntero: 0.29 ± 0.01 µm * s−1, KOAntero: 0.28 ± 0.03 µm * s−1). **pRetro = 0.004, pAntero = 0.721. N = 4 independent experiments. All graphs show mean ± SEM, statistical analysis was performed by unpaired two-tailed Student’s t‐test in (e, h, r, s) and one-sample Student’s t‐test in (k, m). n.s.-non-significant. Total number of neurons in N experiments is shown in Supplementary Table 3. Source data are provided as a Source Data file. m.g.v-mean gray value.
Fig. 4
Fig. 4. LC3 lipid conjugation machinery regulates MT dynamics.
a, b Time-lapse images and corresponding kymographs of WT and ATG5 KO axons co-expressing Tubulin-eGFP and EB3-tdTomato. Arrows indicate EB3 comets in WT neurons. c EB3 comet density in WT and ATG5 KO axons, expressing either eGFP (WTGFP: 0.05 ± 0.01, KOGFP: 0.02 ± 0.00) or eGFP-ATG5 (WTATG5: 0.05 ± 0.00, KOATG5: 0.06 ± 0.01). *pWTGFP vs. KOGFP = 0.032, *pKOGFP vs. KOATG5 = 0.019. N = 3 independent experiments. d, e Levels of tyrosinated (Y) (78.28 ± 3.12%, **p = 0.001) and detyrosinated (deY) (69.85 ± 13.75%, *p = 0.047) α-Tubulin in dynamic ATG5 KO MTs. N = 5 independent experiments. fh Δ2α-Tubulin levels in immunostained (f) and lysed (g, h) cultured WT and ATG5 KO neurons (KO: 136.13 ± 16.78%). *p = 0.049. N = 5 independent experiments. Scale bars, 50 µm. i, j Levels of tyrosinated (Y) (82.25 ± 5.75%, *p = 0.045) and detyrosinated (deY) (134.49.25 ± 9.09%, *p = 0.032) α-Tubulin in polymerized ATG5 KO MTs. N = 3 independent experiments. km Δ2α-Tubulin levels in in immunostained (k) and lysed (l, m) cultured WT and ATG16L1 KO neurons (KO: 136.18 ± 10.79%). *p = 0.039. N = 3 independent experiments. Scale bars: 50 µm. np Representative images, kymographs and comet density of EB3-tdTomato-expressing WT (0.07 ± 0.01) and ATG16L1 (0.03 ± 0.01) KO axons. *p = 0.029. N = 3 independent experiments. q, r Representative kymographs and comet density in EB3-tdTomato-expressing axons, transfected with either eGFP (0.061 ± 0.006), eGFP-LC3B (0.054 ± 0.001) or eGFP-LC3B G120A (0.035 ± 0.005). **peGFP vs. eGFP-LC3B G120A = 0.009, peGFP vs. eGFP-LC3B = 0.413. N = 3 independent experiments. s, t Representative kymographs and comet density in EB3-tdTomato-expressing axons, co-transfected either with eGFP (0.049 ± 0.003), eGFP-LC3B G120A (0.028 ± 0.003) or eGFP-GABARAP G116A (0.060 ± 0.008), *peGFP vs. eGFP-LC3B G120A = 0.044, peGFP vs. eGFP-GABARAP G116A = 0.321. N = 3 independent experiments. All graphs show mean ± SEM, statistical analysis was performed by unpaired two-tailed Student’s t‐test in (p), two-way ANOVA for multiple comparisons in (c), one-way ANOVA for multiple comparisons in (r, t) and one-sample Student’s t‐test in (e, h, j, m). n.s.-non-significant. In (e, h, j, m) KO protein levels were normalized to the WT set to 100%. In (e, h, j, m) samples arise from the same experiment and the blots were processed in parallel such that one loading control was used. Total number of neurons in N experiments is shown in Supplementary Table 3. Source data are provided as a Source Data file. Scale bar for all kymographs x: 5 µm, y: 20 s.
Fig. 5
Fig. 5. LC3 directly associates with ELKS1 in-vitro and in-vivo.
a Mass spectrometry analysis of LC3 interaction partners in the brain. Volcano plot illustrates the significantly abundant proteins. The −log10 is plotted against the log2 (fold change: LC3/control). The non-axial vertical lines denote ±2-fold change while the non-axial horizontal line denotes p = 0.05, which is the significance threshold. bd Ectopically expressed ELKS1, tagged with tdTomato is co-immunoprecipitated (Co-IP) with eGFP-tagged LC3A (b) and LC3B (c), but not with GABARAP (d). HEK cell lysates were directly analyzed (Input) or subjected to GFP immunoprecipitation (Elution) and further immunoblotted against mCherry (Co-IP). Input, 1% of the total lysate. eg Ectopically expressed ELKS1, tagged with tdTomato is co-immunoprecipitated (Co-IP) with eGFP-tagged LC3A G120A (e) and LC3B G120A (f) but not with GABARAP G116A (g). HEK cell lysates were directly analyzed (Input) or subjected to GFP immunoprecipitation (Elution) and further immunoblotted against mCherry (Co-IP). Input, 1% of the total lysate. h, i Ectopically expressed LC3A and LC3B, tagged with eGFP are co-immunoprecipitated with tdTomato-ELKS1. HEK cell lysates were directly analyzed (Input) or subjected to ELKS1 immunoprecipitation (Elution) and further immunoblotted against GFP (Co-IP). Input, 1% of the total lysate. j Purified recombinant His6-LC3B, detected by immunoblotting with LC3B antibody, directly binds Myc-ELKS1. Input, 12.5% of the total recombinant LC3B and Myc-ELKS1. k Co-immunoprecipitation of endogenous ELKS1 with LC3B form mouse brain lysate. Input, 4% of the total lysate was added to the assay. l Co-immunoprecipitation of endogenous LC3B with ELKS1 form mouse brain lysate. Input, 4% of lysate. m, n Close colocalization of tdTomato-ELKS1 and eGFP-LC3B at en passant presynaptic boutons marked by synapsin immunofluorescence (blue). Colocalization is analyzed by Mander´s overlap coefficient (80.42 ± 7.22%). Scale bars: 5 µm (upper panel), 1 µm (lower panels). N = 2 independent experiments. All graphs show mean ± SEM. Co-IP experiments in HEK cells represent examples from N = 3 independent experiments. Source data are provided as a Source Data file.
Fig. 6
Fig. 6. LC3 regulates MTs stability via ELKS1/CLASP2-dependent mechanism.
a ELKS1 and LC3B Co-IP in WT and ATG5 KO lysates. Input, 10% of lysate. b, c ELKS1 levels in ATG5 WT and KO lysates. *p = 0.022. df ELKS1 colocalization with Bassoon in WT and ATG5 KO cortex, analyzed by Pearson’s correlation coefficient. *p = 0.04. Scale bar, 10 µm, 2 µm inserts. g ELKS1 levels in NSC34 cells treated with 67 nm BafilomycinA for 16 h. hj Decreased ELKS1 levels in eGFP-transfected ATG5 KO neurons, treated with LC3b siRNA, *p = 0.010. Scale bars, 10 µm, 4 µm inserts. k EB3 comet density in WT and ATG5 KO axons, transfected either with scr or Elks1 siRNA. *pWTscr vs. KOscr = 0.025, **pKOscr vs. KOsiElks1 = 0.004, *pWTscr vs. WTsiElks1 = 0.041. l, m Spheroid area is decreased in eGFP-transfected ATG5 KO axons treated with Elks1 siRNA, compared to scr siRNA. *p = 0.018. Scale bars, 5 µm, 3 µm inserts. n, o Increased CLASP2 levels in ATG5 KO cortex. *p = 0.046. In (n), CLASP2 fluorescence was false color-coded with warm colors representing high intensities. Scale bars, 50 µm, 10 µm inserts. p STED imaging of CLASP2 localization on WT and ATG5 KO MTs. Scale bars, 1 µm. q CLASP2 levels in ATG5 KO axons treated either with scr or Elks1 siRNA. **p = 0.004. rv EB3 comet density (eGFP: 0.052 ± 0.00; eGFP-CLASP2: 0.0417 ± 0.004, *p = 0.012), MT catastrophe frequency (eGFP: 0.021 ± 0.001 s−1, eGFP-CLASP2: 0.015 ± 0.001 s−1, *p = 0.017), MT growth events length (eGFP: 53.39 ± 2.35 s, eGFP-CLASP2: 70.93 ± 4.85 s, *p = 0.017) and MT growth rate (eGFP: 0.289 ± 0.042 µm * s−1, eGFP-CLASP2: 0.322 ± 0.055 µm * s−1, p = 0.654) in neurons, transfected either with eGFP or eGFP-CLASP2. Scale bar, x: 5 µm, y: 20 s. Data in b, c, f, j, k, m, q are from N = 3 independent experiments. Data in o, sv are from N = 4 independent experiments. All graphs show mean ± SEM, statistical analysis was performed by unpaired two-tailed Student’s t‐test in (f, m, sv), two-way ANOVA for multiple comparisons in (k) and one-sample Student’s t‐test in (c, j, o, q). In (c, o) KO was normalized to WT, in (j, q) KOsi was normalized to KOscr. n.s.-non-significant. Total number of neurons in N experiments is shown in Supplementary Table 3. Source data are provided as a Source Data file.
Fig. 7
Fig. 7. Loss of MT dynamics in ATG5 KO neurons impairs neurotrophin signaling and compromises the learning and memory-dependent neuronal activation.
a, b TRKB signaling is significantly decreased in lysates from cultured ATG5 KO neurons compared to the WT set to 100% (KOp-TRKB: 54.68 ± 16.78%, *p = 0.027; KOp-ERK: 73.34 ± 9.94%, *p = 0.028; KOp-Akt: 64.70 ± 10.82%, *p = 0.016). N = 5 independent experiments. c Bdnf mRNA levels are significantly decreased in cultured ATG5 KO neurons (KOBdnf: 12.35 ± 2.88%, KOGapdh: 98.79 ± 0.36%). ***p < 0.000. N = 4 independent experiments. d TrkB mRNA levels are non-altered in ATG5 KO neurons (KOTrkB: 81.25 ± 8.37%, KOGapdh: 98.79 ± 0.36%). e, f Protein levels of phosphorylated S6 Ribosomal Protein (pS6) in lysates from cultured WT and ATG5 KO neurons (KO: 40.39 ± 14.04%). *p = 0.016. N = 4 independent experiments. g ATG5 KO neurons expressing eGFP were treated either with BDNF or with H2O and subsequently immunostained for MAP2. Scale bar, 50 µm. g, h Application of BDNF rescues the branching complexity of ATG5 KO neurons compared to H2O-treated KO controls (KOBDNF: 146.55 ± 9.88, KOH2O: 69.98 ± 4.72, **p = 0.001). N = 4 independent experiments. See also Supplementary Fig. 7 for detailed Sholl analysis. i, j pS6 protein levels are significantly increased in lysates of ATG5 KO neurons treated with BDNF (KO: 175.16 ± 36.20%), comparing to H2O-treated KO controls (KO: 46.61 ± 6.40%). *p = 0.049. N = 3 independent experiments. k Representative confocal images of c-FOS labeled nuclei (green) in the dentate gyrus in WT and ATG5 KO mice sacrificed after acquiring the memory on novel object recognition. To reveal the neurons, sections were co-immunostained for NeuN (magenta). Scale bars, 800 µm, 200 µm inserts. l The number of c-FOS-labeled nuclei is significantly decreased in the dentate gyrus of mice lacking ATG5 (75.12 ± 8.88%) when compared to the WT. *p = 0.020. N = 4 independent experiments. All graphs show mean ± SEM, statistical analysis was performed by unpaired two-tailed Student’s t‐test in (f, m, s, t, u, v, l), paired Student’s t‐test in (h) and one-sample Student’s t‐test in (b, c, d, f, j). In all graphs the KO was normalized to the WT set to 100%. n.s.-non-significant. Total number of neurons in N experiments is shown in Supplementary Table 3. Source data are provided as a Source Data file.

References

    1. Kapitein LC, Hoogenraad CC. Building the neuronal microtubule cytoskeleton. Neuron. 2015;87:492–506. doi: 10.1016/j.neuron.2015.05.046. - DOI - PubMed
    1. Rao AN, Baas PW. Polarity sorting of microtubules in the axon. Trends Neurosci. 2018;41:77–88. doi: 10.1016/j.tins.2017.11.002. - DOI - PMC - PubMed
    1. Howard J, Hyman AA. Dynamics and mechanics of the microtubule plus end. Nature. 2003;422:753. doi: 10.1038/nature01600. - DOI - PubMed
    1. Akhmanova A, Steinmetz MO. Control of microtubule organization and dynamics: two ends in the limelight. Nat. Rev. Mol. Cell Biol. 2015;16:711. doi: 10.1038/nrm4084. - DOI - PubMed
    1. Song Y, Brady ST. Post-translational modifications of tubulin: pathways to functional diversity of microtubules. Trends Cell Biol. 2015;25:125–136. doi: 10.1016/j.tcb.2014.10.004. - DOI - PMC - PubMed

Publication types

MeSH terms