. 2020 Mar 24;11(1):1543.
doi: 10.1038/s41467-020-15330-9.

Ultrasensitive detection of nucleic acids using deformed graphene channel field effect biosensors

Affiliations

Ultrasensitive detection of nucleic acids using deformed graphene channel field effect biosensors

Michael Taeyoung Hwang et al. Nat Commun. .

Abstract

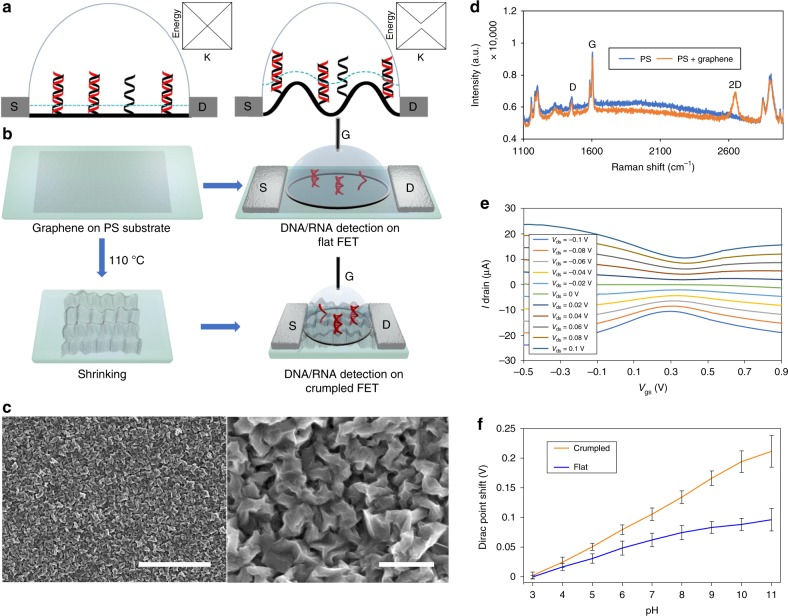
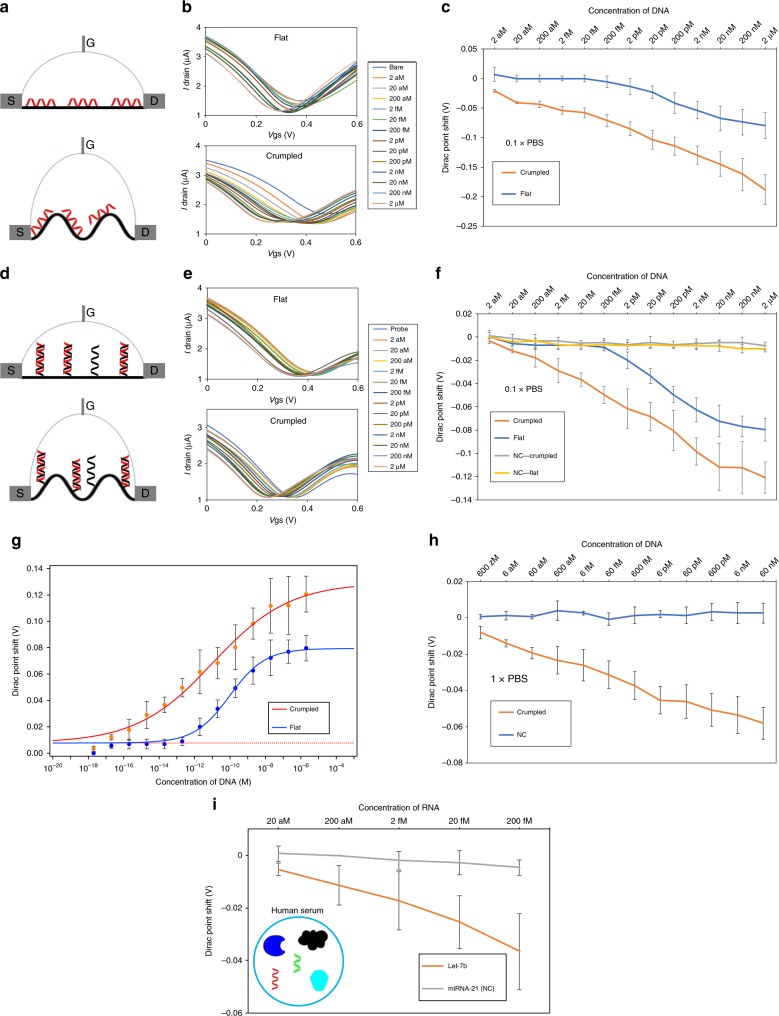
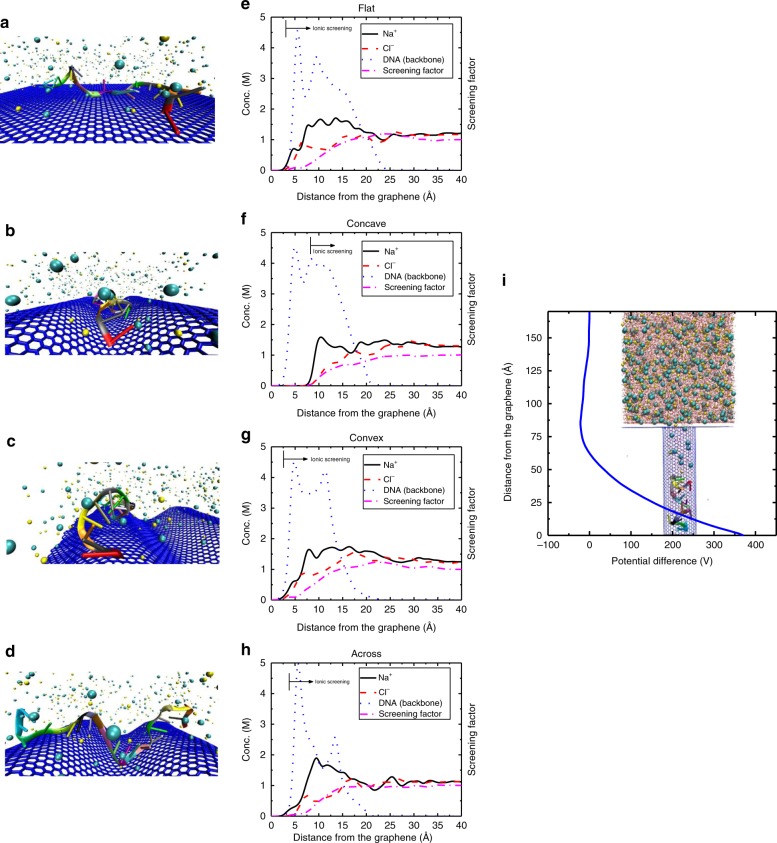
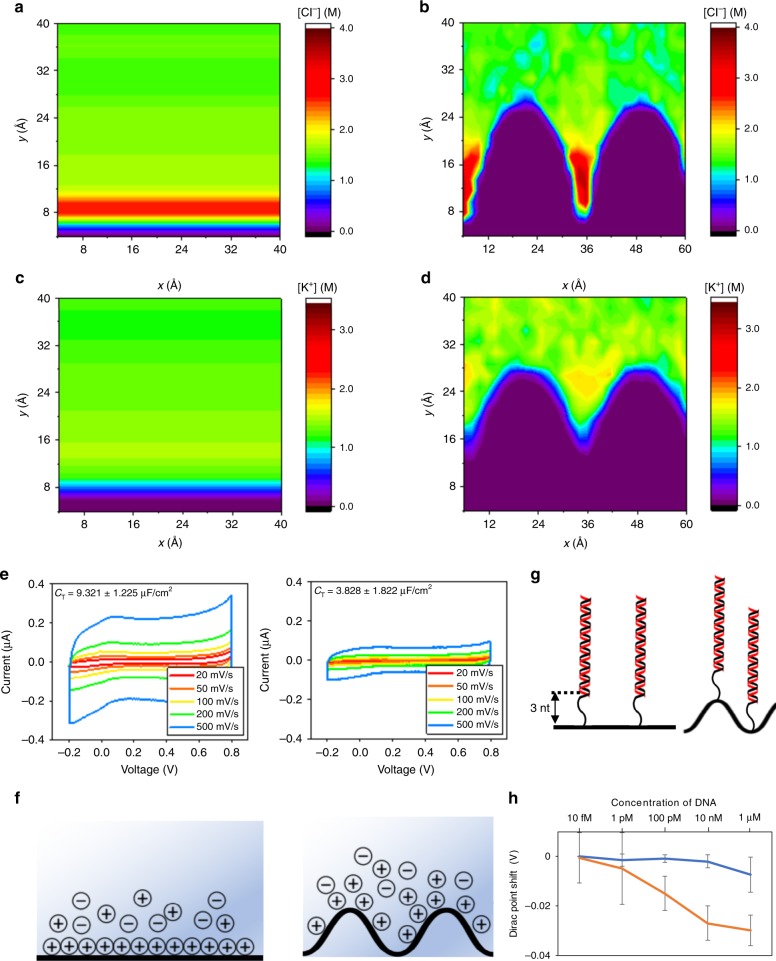
Field-effect transistor (FET)-based biosensors allow label-free detection of biomolecules by measuring their intrinsic charges. The detection limit of these sensors is determined by the Debye screening of the charges from counter ions in solutions. Here, we use FETs with a deformed monolayer graphene channel for the detection of nucleic acids. These devices with even millimeter scale channels show an ultra-high sensitivity detection in buffer and human serum sample down to 600 zM and 20 aM, respectively, which are ∼18 and ∼600 nucleic acid molecules. Computational simulations reveal that the nanoscale deformations can form 'electrical hot spots' in the sensing channel which reduce the charge screening at the concave regions. Moreover, the deformed graphene could exhibit a band-gap, allowing an exponential change in the source-drain current from small numbers of charges. Collectively, these phenomena allow for ultrasensitive electronic biomolecular detection in millimeter scale structures.


Conflict of interest statement

The authors declare no competing interests.

Figures

Fig. 1
Fig. 1. Scheme and characterization of flat and crumpled graphene FET biosensor.
a Cross-sectional scheme of the flat (left) and crumpled (right) graphene FET DNA sensor. Probe (black) and target (red) DNA strands are immobilized on the surface of graphene. The blue dot lines represent Debye length in the ionic solution and the length is increased at the convex region of the crumpled graphene, thus more area DNA is inside the Debye length, which makes the crumpled graphene more electrically susceptible to the negative charge of DNA. The inset boxes represent qualitative energy diagram in K-space. Graphene does not have intrinsic bandgap. However, crumpled graphene may open bandgap, which is discussed in the later section and supplementary table 4. b fabrication of FETs and experimental process flow. Graphene on pre-strained PS substrate was annealed at 110 °C to shrink the substrate and crumple the graphene. Then source and drain electrodes were applied and solution-top gate was used. In case of flat graphene FET, the annealing process was omitted. c SEM images of crumpled graphene. The scale bar is 5 µm (left) and 500 nm (right). d Raman spectroscopy of crumpled graphene and PS substrate. e Charge transfer characteristics of the fabricated crumpled graphene FET. Vgs vs Ids (bottom) with the variation of Vds graphs showed shift in the Dirac point. f Dirac point shifts of the FET sensor plotted as a function of pH values. n = 5, mean ± std.
Fig. 2
Fig. 2. Nucleic acids absorption and hybridization test on flat and crumpled FET.
a Lateral image of the flat (top) and crumpled (bottom) graphene FET DNA sensors. DNA (red strand) is absorbed on the graphene surface by π-π stacking. b I–V relationship of the flat (top) and crumpled (bottom) graphene FET sensors for the DNA absorption. DNA absorption shifted the I–V curve according to the indicated concentrations. The I–V curves shift of crumpled graphene is significantly larger than the flat device. c Dirac voltage shift of the FET sensor. The Dirac voltage shift is plotted as a function of the added target DNA concentration. d Lateral image of the flat (top) and crumpled (bottom) graphene FET DNA sensors. DNA (red strand) is hybridized with probe DNA (black strand) on the graphene surface. e I–V relationship of the flat (top) and crumpled (bottom) graphene FET sensors for the DNA hybridization. DNA hybridization shifted the I–V curve according to the indicated concentrations. The I–V curves shift of crumpled graphene is significantly larger than the flat device. f Dirac voltage shift of the FET sensor with detection of hybridization using DNA probe. NC is non-complementary control sequences used in the experiments. g Sips model fitting results Y-axis is absolute values of Dirac point shift. h Dirac voltage shift of the FET sensor with detection of hybridization using PNA probe. i Dirac voltage shift of the FET sensor with miRNA detection of hybridization. Target RNA spiked in human serum was treated on the FET sensor. Human serum is complex mixture of biological components. The DNA and RNA sequence used in the experiments is shown in Supplementary Table 1. All the data points are obtained from three different devices. mean ± std. *P < 0.05.
Fig. 3
Fig. 3. The schematic of the simulations for equilibrated DNA on.
a Flat graphene, b concave surface of crumpled graphene, c convex surface of crumpled graphene, and d across the graphene crumples. Graphene is shown in blue, ions are presented as cyan and yellow spheres and the DNA bases are shown in different colors. Water molecules are not shown for better presentation. The molar concentration of ions (sodium and chloride) and the backbone of DNA strand along with the screening factor of ions are plotted as a function of the distance from the graphene surface for e flat, f concave, g convex, and h across configurations of DNA. The location where the ionic screening starts to take place is shown using an arrow. In the concave region, ions are excluded due to its confinement and most of the adsorbed DNA molecule remains unscreened electrostatically. Less screening increases NDNAunscreend and induces more charge density in graphene resulting in a larger Dirac point shift. i The 2.45-nm diameter CNT that is used to model a narrow trench in crumpled graphene, is shown with CNT and graphene carbon atoms in blue, ions in cyan and yellow, water molecules in red and DNA strand bases in different colors. The DNA adsorbs to the bottom of the trench and excludes ions near the surface (maximizing NDNAunscreend). The resulting giant electric potential modifies the carrier charge density of graphene. The potential is obtained from V(z)=z0zqzAε0dzdz, where q(z), A and εo are the net charge of the system (ions, DNA and water) in z, surface area of the bottom of the trench and vacuum dielectric constant, respectively.
Fig. 4
Fig. 4. Capacitance measurement and charge layer distance effect.
ad The molar concentration map of ions (sodium and chloride) are plotted for flat and crumpled charged graphene sheet. The counter-ions are distributed over a longer distance away from the surface of graphene in the concave region of the crumpled graphene. e EDL capacitance of flat and crumpled graphene. As EDL of the flat graphene is denser than the crumpled graphene, flat graphene had about three times larger capacitance than crumpled graphene. f ELD structures of flat (left) and crumpled graphene (right). Loosely structured EDL of crumpled graphene leads to the smaller capacitance value. g To determine if the crumpled graphene device has longer Debye length, distance of double strand (probe + target) DNA part was 3 nt further from the surface. h The flat graphene device (blue line) is not able to measure the 19 nt (3 nt short) target DNA while, the crumpled graphene (the orange line) showed left shift of IV curves. n = 3, mean ± std.

References

    1. Gilliland G, Perrin S, Blanchard K, Bunn HF. Analysis of cytokine mRNA and DNA: detection and quantitation by competitive polymerase chain reaction. Proc. Natl Acad. Sci. USA. 1990;87:2725 LP–2722729. doi: 10.1073/pnas.87.7.2725. - DOI - PMC - PubMed
    1. Inouye M, Ikeda R, Takase M, Tsuri T, Chiba J. Single-nucleotide polymorphism detection with “wire-like” DNA probes that display quasi “on–off” digital action. Proc. Natl Acad. Sci. USA. 2005;102:11606 LP–11611610. doi: 10.1073/pnas.0502078102. - DOI - PMC - PubMed
    1. Schweitzer B, et al. Immunoassays with rolling circle DNA amplification: A versatile platform for ultrasensitive antigen detection. Proc. Natl Acad. Sci. USA. 2000;97:10113 LP–10110119. doi: 10.1073/pnas.170237197. - DOI - PMC - PubMed
    1. Star A, et al. Label-free detection of DNA hybridization using carbon nanotube network field-effect transistors. Proc. Natl Acad. Sci. USA. 2006;103:921–926. doi: 10.1073/pnas.0504146103. - DOI - PMC - PubMed
    1. Hwang MT, et al. Highly specific SNP detection using 2D graphene electronics and DNA strand displacement. Proc. Natl Acad. Sci. 2016;113:7088–7093. doi: 10.1073/pnas.1603753113. - DOI - PMC - PubMed

Publication types