

doi: 10.1038/s41467-020-15351-4.
Dimensionality reduction by UMAP to visualize physical and genetic interactions
Affiliations
- PMID: 32210240
- PMCID: PMC7093466
- DOI: 10.1038/s41467-020-15351-4
Item in Clipboard
Dimensionality reduction by UMAP to visualize physical and genetic interactions
Nat Commun.
.
Abstract
Dimensionality reduction is often used to visualize complex expression profiling data. Here, we use the Uniform Manifold Approximation and Projection (UMAP) method on published transcript profiles of 1484 single gene deletions of Saccharomyces cerevisiae. Proximity in low-dimensional UMAP space identifies groups of genes that correspond to protein complexes and pathways, and finds novel protein interactions, even within well-characterized complexes. This approach is more sensitive than previous methods and should be broadly useful as additional transcriptome datasets become available for other organisms.
Conflict of interest statement
The authors declare no competing interests.
Figures
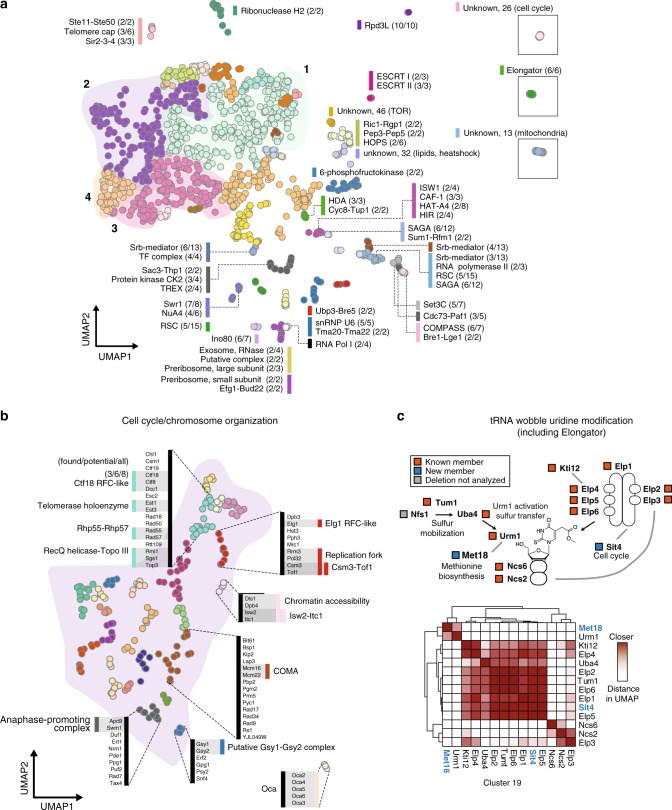
a UMAP coordinates of 1484 single-gene deletion strains clustered by similarity in transcriptional effects. The initial 50 individual clusters are each shown in a different color. Strains that comprise protein complexes are indicated alongside a bar colored according to cluster identity. Each complex is represented as a fraction: the number of complex members found in the cluster over the number of complex members in the set of 1484 mutants. Clusters with coordinates far from the main group are shown in boxes. Clusters without a known complex are marked as “unknown,” along with an arbitrary cluster number; these clusters are annotated with a broad GO term enriched in that cluster. b Cluster 2 shows more distinct groupings when re-clustered separately. Annotations as in a. Cluster 2 as a whole was enriched for cell cycle and chromosome organization, with individual clusters corresponding to parts of this process. c The tRNA wobble uridine pathway, captured entirely within the cluster containing the Elongator complex (boxed green cluster in a). Complex members within this cluster are annotated with orange boxes, while new members are annotated in blue. One pathway member, Nfs1, was not present in the single-gene deletion dataset. The heatmap represents fine-scale distances between each pair of points within the cluster. Darker shades of red indicate points nearer in UMAP space; hierarchical clustering was applied on this distance metric to group proteins within this pathway. Heterodimeric interactions, such as Ncs6-Ncs2 (bottom-right corner of heatmap), are nearer to each other than other members of the pathway. Novel members of this pathway (blue text) are grouped with other members based on their similarity of UMAP distance, and these new interactions are indicated with gray lines in the pathway diagram.
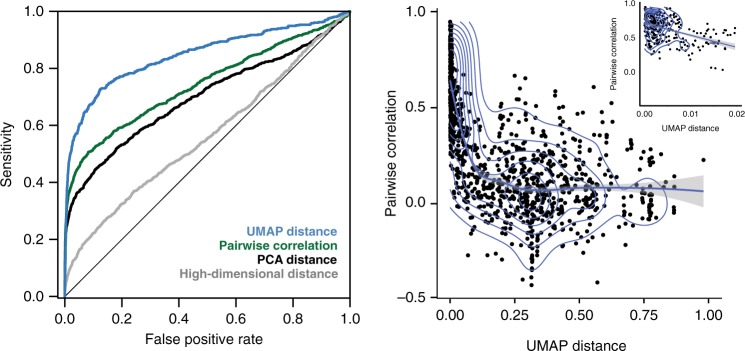
a A receiver-operator curve showing the ability of UMAP distance to capture known protein-protein interactions (sensitivity) as a function of its false positive detection. UMAP distance (blue) performs better than pairwise correlation (green), PCA distance (dark gray), and high-dimensional distance (light gray) in identifying interactions. b For each protein-protein interaction, the distance between points in UMAP space was plotted against the pairwise correlation of that pair of transcriptomes. The density of points is indicated with blue lines. Inset in the upper right shows a zoomed-in portion of the x-axis; points with UMAP distance in this range are highly enriched for true interactions that are not captured by pairwise correlation.
References
-
- Hughes Timothy R, Marton Matthew J, Jones Allan R, Roberts Christopher J, Stoughton Roland, Armour Christopher D, Bennett Holly A, Coffey Ernest, Dai Hongyue, He Yudong D, Kidd Matthew J, King Amy M, Meyer Michael R, Slade David, Lum Pek Y, Stepaniants Sergey B, Shoemaker Daniel D, Gachotte Daniel, Chakraburtty Kalpana, Simon Julian, Bard Martin, Friend Stephen H. Functional Discovery via a Compendium of Expression Profiles. Cell. 2000;102(1):109–126. doi: 10.1016/S0092-8674(00)00015-5. - DOI - PubMed
-
- Laurens van der Maaten, Hinton G. Visualizing data using t-SNE Laurens. J. Mach. Learn. Res. 2008;9:2579–2605.
Publication types
MeSH terms
Substances
Grants and funding
LinkOut - more resources
Full Text Sources
Molecular Biology Databases
