. 2020 Mar 24;11(1):1539.
doi: 10.1038/s41467-020-15344-3.

A Staphylococcus pro-apoptotic peptide induces acute exacerbation of pulmonary fibrosis

Affiliations

A Staphylococcus pro-apoptotic peptide induces acute exacerbation of pulmonary fibrosis

Corina N D'Alessandro-Gabazza et al. Nat Commun. .

Abstract

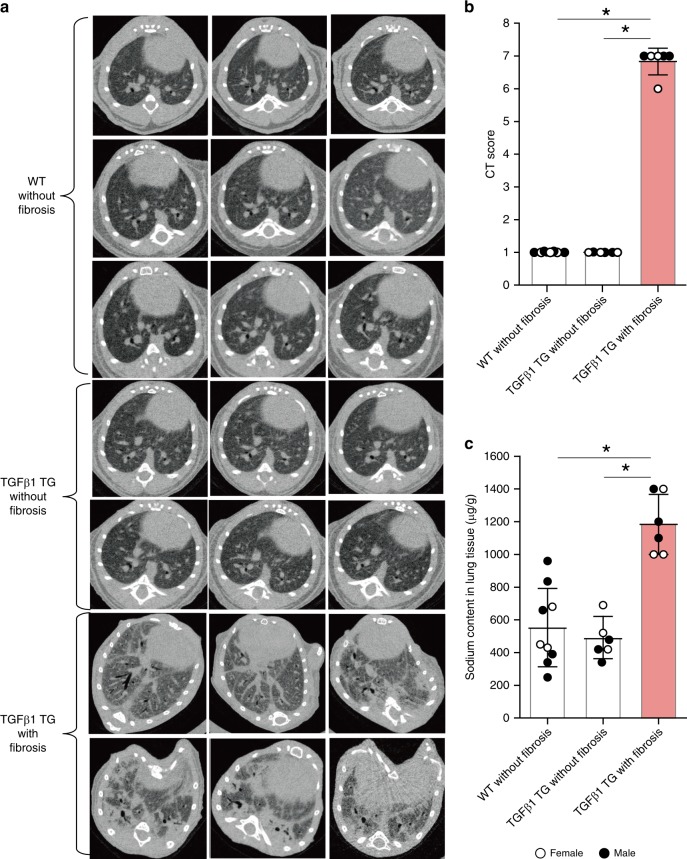
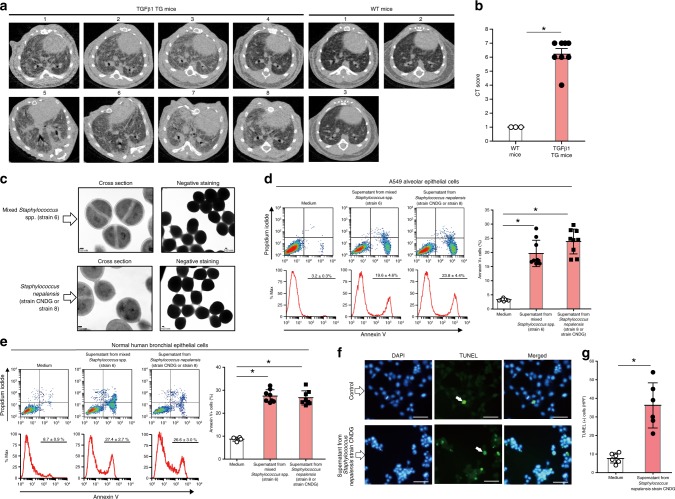
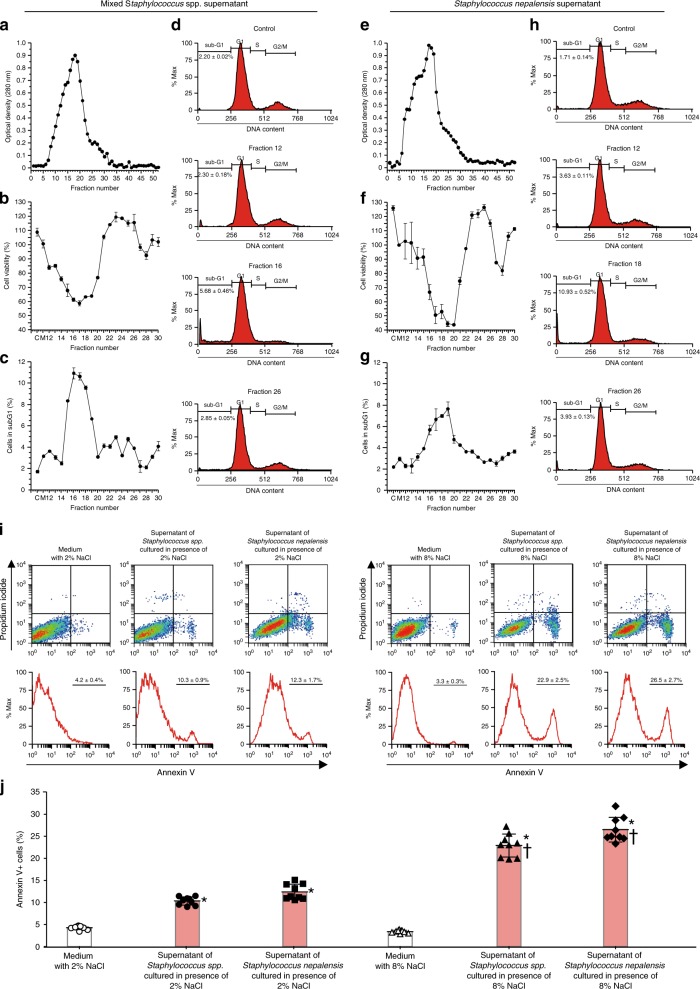
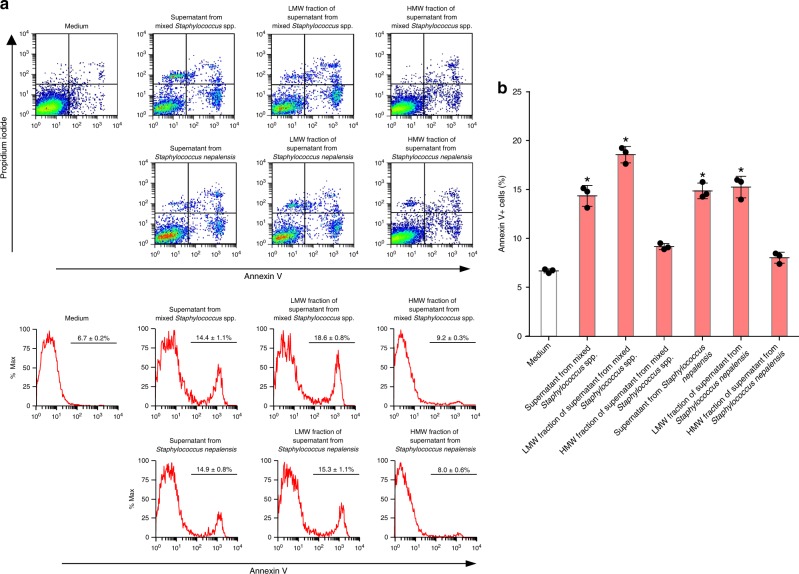
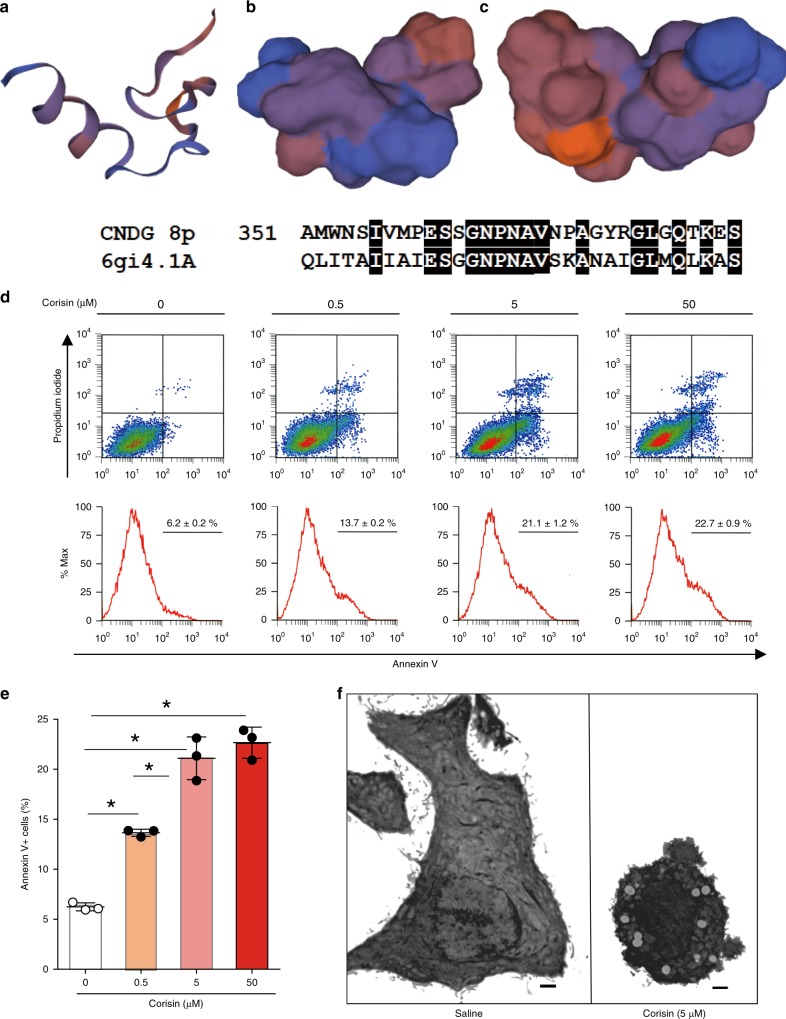
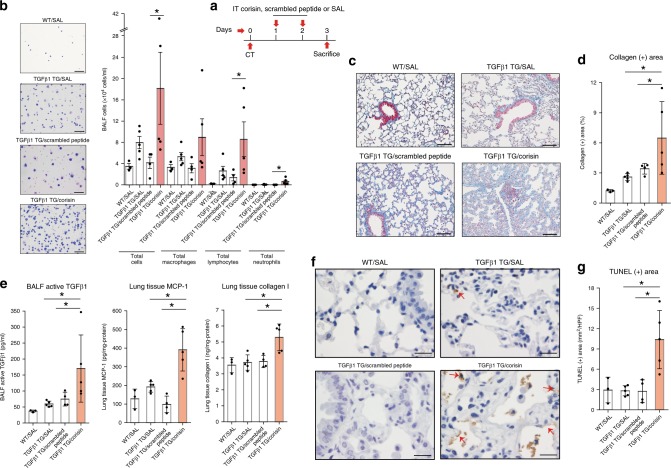
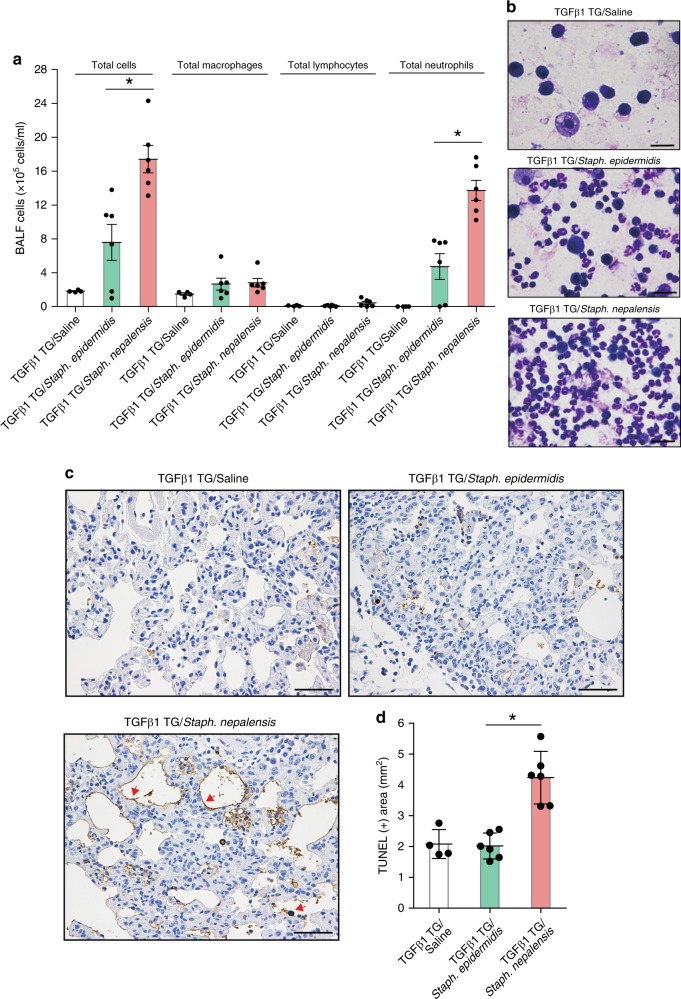
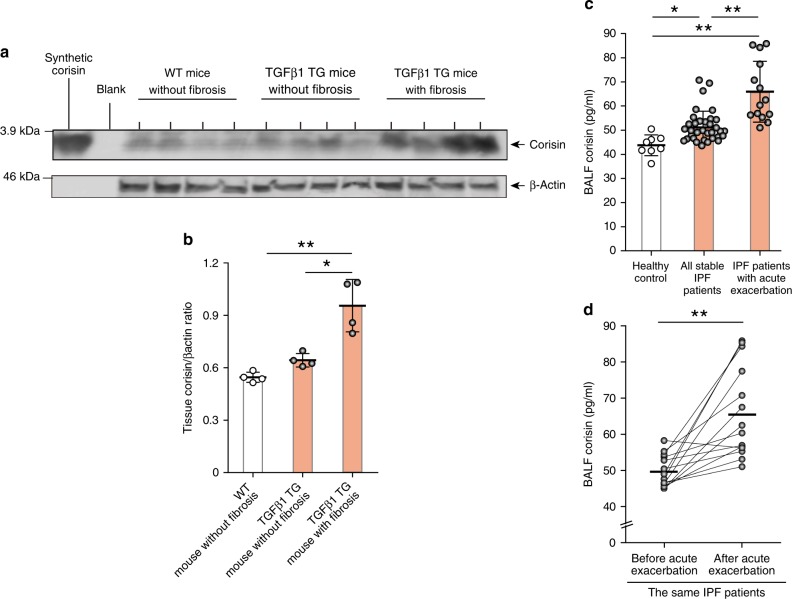
Idiopathic pulmonary fibrosis (IPF) is a chronic and fatal disease of unknown etiology; however, apoptosis of lung alveolar epithelial cells plays a role in disease progression. This intractable disease is associated with increased abundance of Staphylococcus and Streptococcus in the lungs, yet their roles in disease pathogenesis remain elusive. Here, we report that Staphylococcus nepalensis releases corisin, a peptide conserved in diverse staphylococci, to induce apoptosis of lung epithelial cells. The disease in mice exhibits acute exacerbation after intrapulmonary instillation of corisin or after lung infection with corisin-harboring S. nepalensis compared to untreated mice or mice infected with bacteria lacking corisin. Correspondingly, the lung corisin levels are significantly increased in human IPF patients with acute exacerbation compared to patients without disease exacerbation. Our results suggest that bacteria shedding corisin are involved in acute exacerbation of IPF, yielding insights to the molecular basis for the elevation of staphylococci in pulmonary fibrosis.


Conflict of interest statement

C.N.D.G: and E.C.G. have a patent on the TGFβ1 TG mice used in the present study. There is an invention disclosure by C.N.D.G:, E.C.G., and I.C. on the apoptotic peptides identified in this study. None of the other authors declared any conflict of interest regarding the present work.

Figures

Fig. 1
Fig. 1. The fibrotic lung tissue is a salty microenvironment.
a, b Chest computed tomography (CT) findings and CT scores of wild-type and TGFβ1 transgenic (TG) mice. n = 9 in WT without fibrosis, n = 6 in TGFβ1 TG without fibrosis and TGFβ1 TG with fibrosis. Bars indicate the means ± S.D. Statistical analysis by ANOVA with Tukey’s test. *p < 0.001. c The lung tissue Na+ was measured by microwave analysis/inductively coupled plasma mass spectrometry. Fibrotic lung tissues excised from wild-type and transforming growth factor (TGF)β1 TG mice with and without (n = 6) lung fibrosis. n = 9 in WT without fibrosis, n = 6 in TGFβ1 TG without fibrosis and TGFβ1 TG with fibrosis. Bars indicate the means ± S.D. Statistical analysis by Mann–Whitney U test. Statistical analysis by ANOVA with Tukey’s test. *p < 0.001. The source data underlying Fig. 1b, c are provided in the Source Data file.
Fig. 2
Fig. 2. Growth of bacteria from fibrotic lung tissue cultured under hypersaline conditions and apoptosis induced by their culture supernatants.
a, b Computed tomography (CT) and CT fibrosis scoring of wild-type (WT) mice (n = 3) and TGFβ1 transgenic (TG) mice (n = 8). Bars indicate the means ± standard error of the means. Statistical analysis by two-tailed Wilcoxon signed rank test. *p = 0.01. c Fibrotic lung tissues excised under sterile conditions from wild-type (n = 3) and TGFβ1 transgenic (n = 8) mice were cultured in hypersaline culture media for 48 h. Analysis of bacterial colonies by transmission electron microscope. Scale bars indicate 100 nm. d Flow cytometry analysis of A549 alveolar epithelal cells cultured for 48 h in DMEM medium containing 1/10 diluted spent culture supernatant of the mixture of Staphylococcus spp. (strain 6; n = 9), Staphylococcus nepalensis strain CNDG (n = 9), or control medium (n = 9). Bars indicate the means ± S.D. Statistical analysis by two-tailed Mann–Whitney U test. *p < 0.0001. e Flow cytometry analysis of normal human bronchial epithelial cells cultured for 48 h in DMEM medium containing 1/10 diluted spent culture supernatant of the mixture of Staphylococcus spp. (strain 6; n = 8), Staphylococcus nepalensis strain CNDG (n = 8), or control medium (n = 4). Bars indicate the means ± S.D. Statistical analysis by two-tailed Mann–Whitney U test. *p < 0.005. f, g TUNEL assay was performed as described under methods after culturing A549 alveolar epithelial cells in the presence of medium (n = 6) or supernatant of Staphylococcus nepalensis strain CNDG (n = 6). Scale bars indicate 20 µm. Bars indicate the means ± S.D. Statistical analysis by two-tailed Mann–Whitney U test. *p < 0.01. Abbreviations are defined as HPF, high-power field; TUNEL, terminal deoxynucleotidyl transferase dUTP nick end labeling; DAPI, 4′,6-diamidino-2-phenylindole. The source data underlying 2b, d, e, g are provided in the Source Data file.
Fig. 3
Fig. 3. Fractions of culture supernantant with high protein concentration and spent medium with high salt concentration induce potent apoptotic activity.
a Absorbance of fractions from the culture supernatant of the mixture of Staphylococcus spp. after gel filtration using Sephadex G25 column. b Cell viability after treating A549 alveolar epithelial cells with the culture supernatant of the mixture of Staphylococcus spp. (each fraction n = 3). c Cells in sub-G1 phase after treating A549 cells with culture supernatant of the mixture of Staphylococcus spp. (each fraction n = 3). d Representative histograms of A549 cells in sub-G1 phase after treatment with culture supernatant of the mixture of Staphylococcus spp. e Absorbance of fractions from the culture supernatant of Staphylococcus nepalensis strain CNDG after gel filtration. f Cell viability after treating A549 cells with culture supernatant of Staphylococcus nepalensis strain CNDG (each fraction n = 3). g Cells in sub-G1 phase after treating A549 cells with culture supernatant of Staphylococcus nepalensis strain CNDG (each fraction n = 3). h Representative histograms of A549 cells in sub-G1 phase after treatment with culture supernatant of Staphylococcus nepalensis strain CNDG. One mL of each sample was applied into the Sephadex G25 column. The material eluted was collected in 2 ml fractions and then absorbance was measured at 280 nm. Cell viability was evaluated by using a commercial cell counting kit and the percentage of cells in sub-G1 by flow cytometry. i, j Bacteria were cultured in medium containing 2% or 8% salt and the culture supernatant of the mixture of Staphylococcus spp. (n = 9), Staphylococcus nepalensis CNDG strain (n = 9) or medium (n = 9) was prepared by centrifugation and added to the culture medium of A549 alveolar epithelial cells at 1/10 dilution. Flow cytometry of A549 cells was performed after staining with propidium iodide and annexin V. Bars indicate the means ± S.D. Statistical analysis by ANOVA with Tukey’s test. *p < 0.001 vs medium control; †p < 0.0001 vs supernatant of bacteria cultured in medium with 2%NaCl. The source data underlying ac, eg, and i are provided in the Source Data file.
Fig. 4
Fig. 4. The apoptotic factor in culture supernatant from bacteria is a low molecular weight protein.
a, b Culture supernatant from bacteria was separated into fractions of <10 kDa and >10 kDa by filtration and each fraction was added to A549 alveolar epithelial cells after 1/10 dilution to determine apoptosis by flow cytometry. For each group, n = 3. Bars indicate the means ± S.D. Statistical analysis by ANOVA and Tukey’s test. *p < 0.001 vs medium control. LMW low molecular weight, HMW high molecular weight. The source data underlying b are provided in the Source Data file.
Fig. 5
Fig. 5. Structure prediction and apoptotic activity of corisin.
The full length of the transglycosylase 351 from Staphylococcus nepalensis strain CNDG was submitted to the protein structure prediction search engine at Swiss model (https://swissmodel.expasy.org/) but the full-length structure aligned with proteins of <20% identity. ac However, using the pro-apoptotic peptide alone, a model was predicted by the search engine through a structural alignment with the entry 6gi4.1.A, an endo-type membrane-bound lytic murein transglycosylase A, with which it (peptide) shares 46.88% identity. d, e Flow cytometry analysis of A549 alveolar epithelial cells cultured for 48 h in DMEM medium containing increasing concentrations of the pro-apoptotic peptide (corisin from Peptide Institute Incorporation, Japan). Each concentration with n = 3 (triplicates). Bars indicate the means ± S.D. Statistical analysis by ANOVA and Tukey’s test. *p < 0.001. f Electron micrographs of A549 cells cultured in the presence of saline or corisin. Representative microphotographs out of two experiments with similar results are shown. Scale bars indicate 1 µm. The source data underlying e are provided in the Source Data file.
Fig. 6
Fig. 6. Corisin exacerbates lung fibrosis in transforming growth factor β1 transgenic mice.
a Transforming growth factorβ1 transgenic mice (TGFβ1 TG) mice with matched lung fibrosis based on computed tomography (CT) score received intra-tracheal corisin (n = 5) or scrambled peptide (n = 4) or 0.9% NaCl solution (SAL; n = 5) on days 1 and 2 and sacrificed on day 3 to evaluate changes in lung inflammation and fibrosis. Wild-type (WT) mice without lung fibrosis (n = 3) treated with 0.9% NaCl solution were used as controls. n = 3 in WT/SAL, n = 4 in TGFβ1 TG/scrambled peptide, n = 5 in TGFβ1 TG/SAL and TGFβ1 TG/corisin groups. b Counting of bronchoalveolar lavage fluid cells. Scale bars indicate 100 µm. n = 3 in WT/SAL, n = 4 in TGFβ1 TG/scrambled peptide, n = 5 in TGFβ1 TG/SAL and TGFβ1 TG/corisin groups. Statistical analysis by two-tailed Mann–Whitney U test. *p < 0.05. c, d Quantification of collagen area by WinROOF software. Scale bars indicate 100 µm. n = 3 in WT/SAL, n = 4 in TGFβ1 TG/scrambled peptide, n = 5 in TGFβ1 TG/SAL and TGFβ1 TG/corisin groups. Bars indicate the means ± S.D. Statistical analysis by ANOVA with Newman-Keuls test. *p < 0.05. e The concentrations of TGFβ1, monocyte chemoattractant protein (MCP)-1 and collagen I were measured by enzyme immunoassays. n = 3 in WT/SAL, n = 5 in TGFβ1 TG/SAL and TGFβ1 TG/corisin, and n = 4 in TGFβ1 TG/scrambled peptide groups. Bars indicate the means ± S.D. Statistical analysis by ANOVA with Newman-Keuls test. *p < 0.05. f, g DNA fragmentation was evaluated by staining through terminal deoxynucleotidyl transferase dUTP Nick-End Labeling (TUNEL). Scale bars indicate 50 µm. n = 3 in WT/SAL, n = 5 in TGFβ1 TG/SAL and TGFβ1 TG/corisin, and n = 4 in TGFβ1 TG/scrambled peptide groups. Bars indicate the means ± S.D. Statistical analysis by ANOVA with Newman-Keuls test. *p < 0.01. The source data underlying b, d, e, g are provided in the Source Data file.
Fig. 7
Fig. 7. Intra-pulmonary Instillation of the corisin-containing Staphylococcus nepalensis strain CNDG exacerbates pulmonary fibrosis in hTGFβ1 TG mice.
Transforming growth factor (TGF)β1 transgenic (TG) mice with matched lung fibrosis based on computed tomography (CT) score received intra-tracheal instillation of saline (n = 4), Staphylococcus epidermidis ATCC14990 (n = 6), or Staphylococcus nepalensis strain CNDG (n = 6) as described under methods. a, b The number of cells in bronchoalveolar lavage fluid (BALF) was counted and then stained with Giemsa on the second day after intra-tracheal instillation of saline or each bacterium. Scale bars indicate 100 µm. Bars indicate the means ± standard error of the means. Representative microphotographs out of two experiments with similar results are shown. Statistical analysis by ANOVA with Tukey’s test. *p < 0.01. c, d DNA fragmentation was evaluated by staining with terminal deoxynucleotidyl transferase dUTP Nick-End Labeling (TUNEL), and then quantified using the image WinROOF software. Representative microphotographs out of two experiments with similar results are shown. Scale bars indicate 50 µm. Bars indicate the means ± S.D. Statistical analysis by ANOVA with Tukey’s test. *p < 0.001. The source data underlying a, d are provided in the Source Data file.
Fig. 8
Fig. 8. Significant increase in corisin level in TGFβ1 TG mice with lung fibrosis and in patients with idiopathic pulmonary fibrosis.
a, b Western blotting of corisin in lung tissue from wild-type and transforming growth factor (TGF)β1 transgenic (TG) mice performed as described under methods and the ratio of corisin to β-actin. Quantification was performed using ImageJ, a public domain image processing program. Each mouse group with n = 4. Bars indicate the means ± S.D. Statistical analysis by ANOVA with Tukey’s test. *p < 0.01, **p < 0.001. c Corisin was measured using a competitive enzyme immune assay as described under methods. Healthy controls, n = 8; all stable idiopathic pulmonary fibrosis (IPF) patients, n = 34; IPF patients with acute exacerbation, n = 14. Bars indicate the means ± S.D. Statistical analysis by ANOVA with Newman-Keuls test. *p < 0.05, **p < 0.001. d Analysis of bronchoalveolar lavage fluid levels of corisin in the same IPF patients before and after acute exacerbation, n = 14. Bars indicate the means. Statistical analysis by two-tailed Mann–Whitney U Test. **p < 0.001. The source data underlying ad are provided in the Source Data file.

References

    1. Ley B, Collard HR, King TE., Jr. Clinical course and prediction of survival in idiopathic pulmonary fibrosis. Am. J. Respir. Crit. Care Med. 2011;183:431–440. doi: 10.1164/rccm.201006-0894CI. - DOI - PubMed
    1. Richeldi L, Collard HR, Jones MG. Idiopathic pulmonary fibrosis. Lancet. 2017;389:1941–1952. doi: 10.1016/S0140-6736(17)30866-8. - DOI - PubMed
    1. du Bois RM. An earlier and more confident diagnosis of idiopathic pulmonary fibrosis. Eur. Respir. Rev. 2012;21:141–146. doi: 10.1183/09059180.00000812. - DOI - PMC - PubMed
    1. King TE, Jr., Pardo A, Selman M. Idiopathic pulmonary fibrosis. Lancet. 2011;378:1949–1961. doi: 10.1016/S0140-6736(11)60052-4. - DOI - PubMed
    1. King TE, Jr., Noble PW, Bradford WZ. Treatments for idiopathic pulmonary fibrosis. N. Engl. J. Med. 2014;371:783–784. - PubMed

Publication types

MeSH terms

Supplementary concepts