. 2020 Mar 24;10(1):5320.
doi: 10.1038/s41598-020-62074-z.

The Human Lung Glycome Reveals Novel Glycan Ligands for Influenza A Virus

Affiliations

The Human Lung Glycome Reveals Novel Glycan Ligands for Influenza A Virus

Nan Jia et al. Sci Rep. .

Abstract

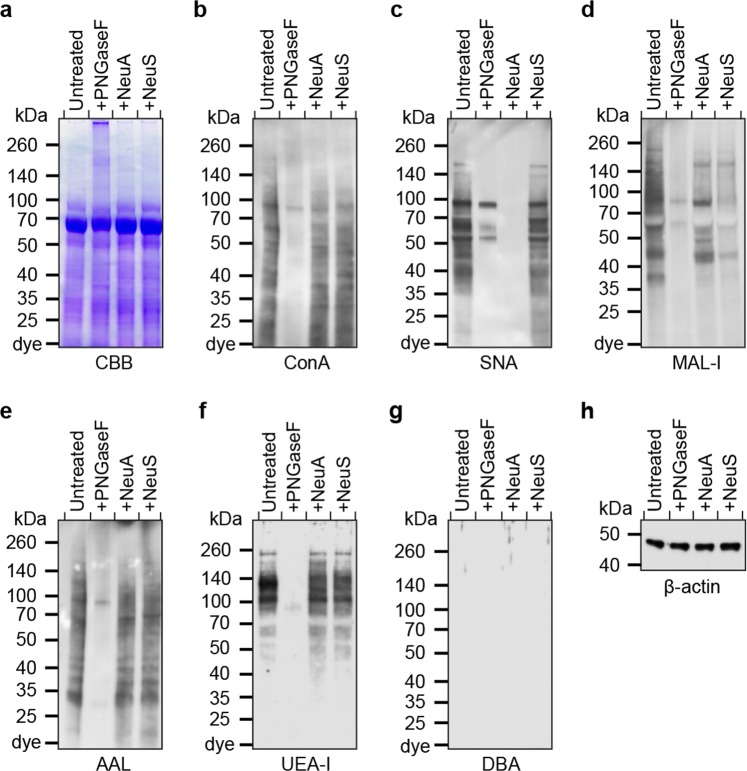
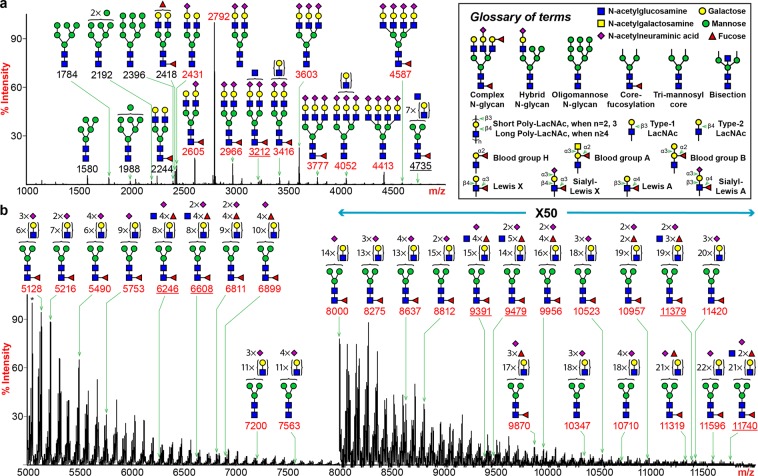
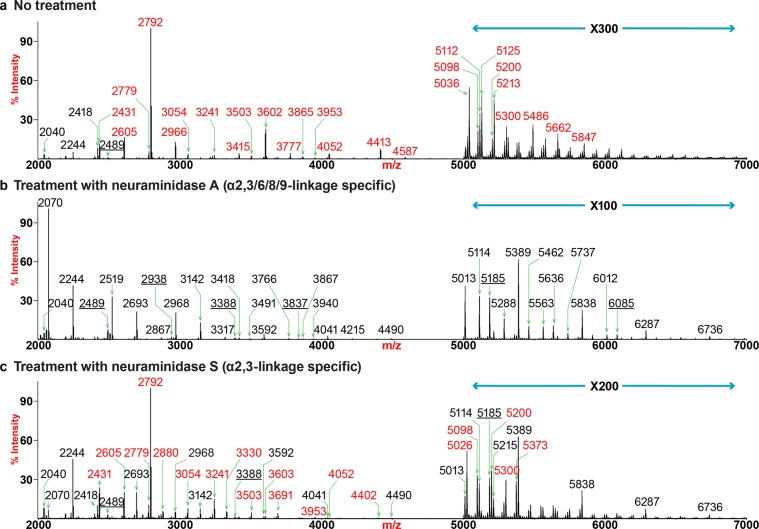
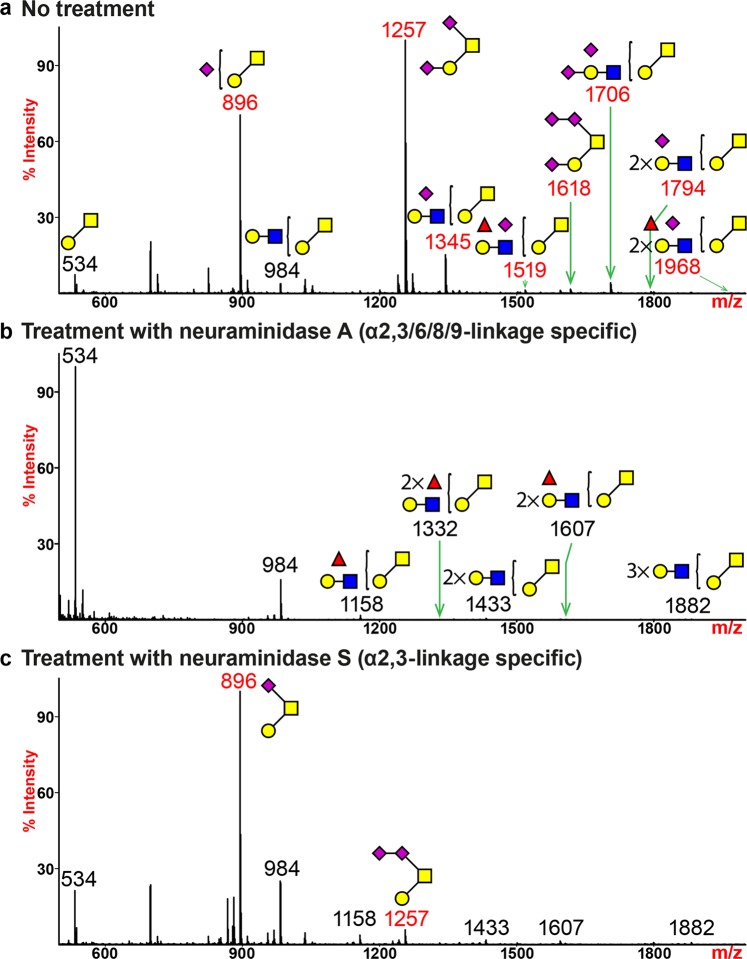
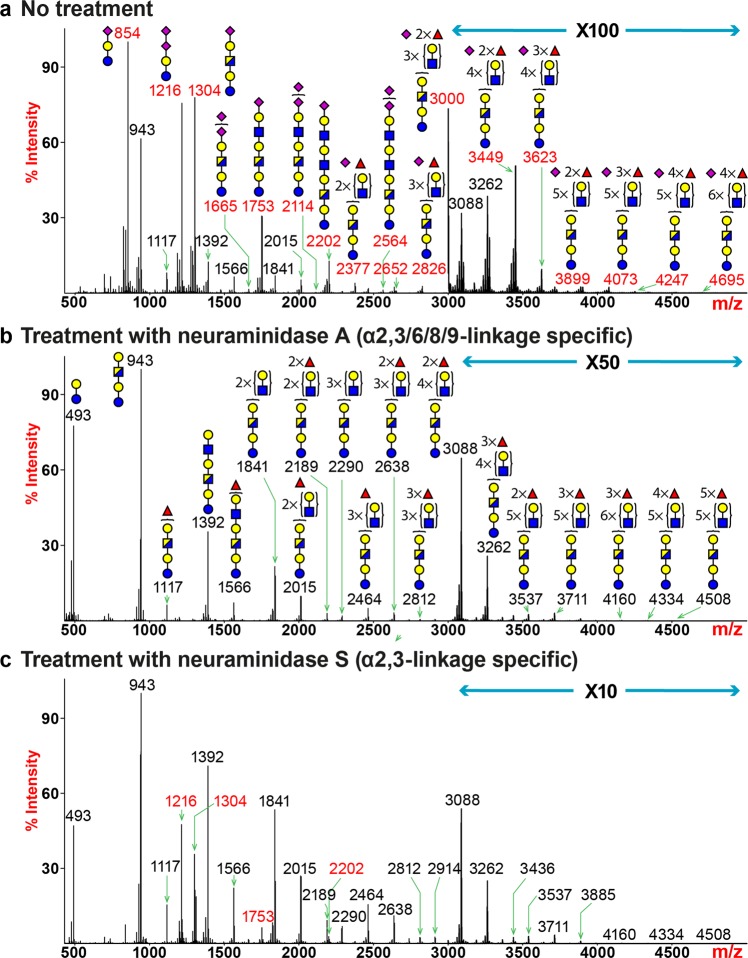
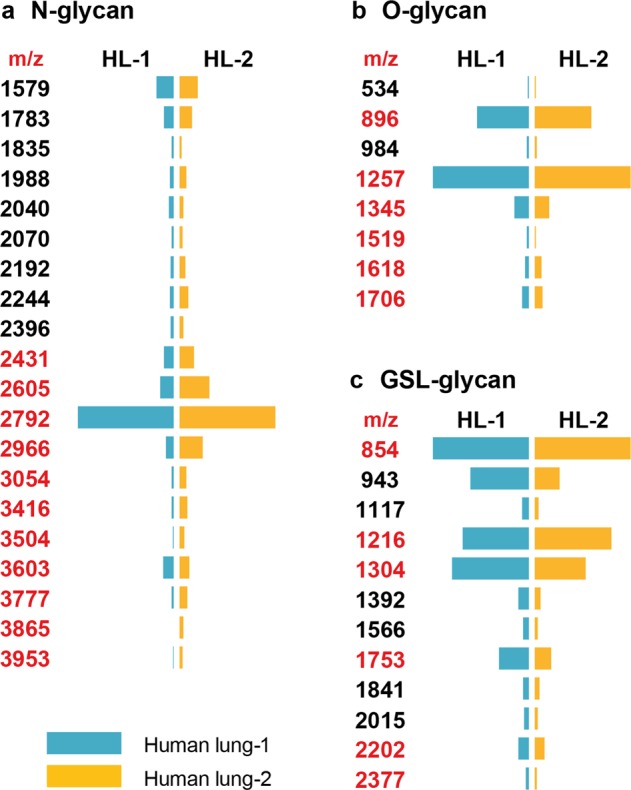
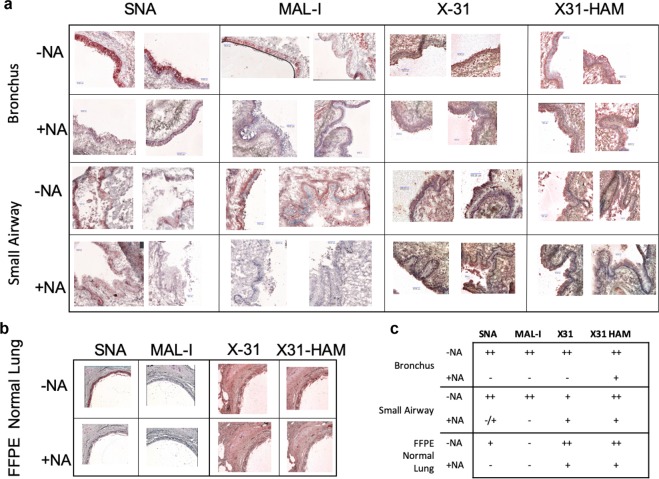
Glycans within human lungs are recognized by many pathogens such as influenza A virus (IAV), yet little is known about their structures. Here we present the first analysis of the N- and O- and glycosphingolipid-glycans from total human lungs, along with histological analyses of IAV binding. The N-glycome of human lung contains extremely large complex-type N-glycans with linear poly-N-acetyllactosamine (PL) [-3Galβ1-4GlcNAcβ1-]n extensions, which are predominantly terminated in α2,3-linked sialic acid. By contrast, smaller N-glycans lack PL and are enriched in α2,6-linked sialic acids. In addition, we observed large glycosphingolipid (GSL)-glycans, which also consists of linear PL, terminating in mainly α2,3-linked sialic acid. Histological staining revealed that IAV binds to sialylated and non-sialylated glycans and binding is not concordant with respect to binding by sialic acid-specific lectins. These results extend our understanding of the types of glycans that may serve as binding sites for human lung pathogens.


Conflict of interest statement

The authors declare no competing interests.

Figures

Figure 1
Figure 1
Western blot of human lung. Tissue homogenate in a human lung were treated with PNGase F (PNGaseF), Neuraminidase A (NeuA), or Neuraminidase S (NeuS), and separated by SDS-PAGE. The gel was stained with Coomassie Brilliant Blue solution (a), or analyzed by Western blot using ConA (b), SNA (c), MAL-I (d), AAL (e), UEA-I (f), and DBA (g). β-actin antibody staining was used as an internal control (h).
Figure 2
Figure 2
N-glycan MS profile of human lung. All molecular ions detected represent permethylated species and are present in the form of [M + Na]+. (a) MALDI-TOF-MS spectrum covers the m/z range between 1000 and 5000. (b) MALDI-TOF-MS spectrum covers the m/z range between 5000 and 12000. The relative intensity of the most abundant peak in each spectrum is set at 100%. The relative intensity of the highest peak in the panel (b), as indicated by an asterisk (*), equals 0.1% of the highest peak in panel (a), if both peaks are plotted in the same panel. Selected peak masses were annotated to reflect the diversity of structural features including sialylated glycans (red), non-sialylated (black) and bisected (underline) glycans. Cartoon symbols appear above a curly parenthesis indicates that the sequences corresponding to these compositions cannot be unequivocally defined with linkage information. Symbol representations of monosaccharides are: yellow circle, Galactose; green circle, Mannose; red triangle, Fucose; blue square, N-acetylglucosamine; purple diamond, N-acetylneuraminic acid.
Figure 3
Figure 3
N-glycan MS profiles of human lung following neuraminidase treatment. All molecular ions detected represent permethylated species and are present in the form of [M + Na]+. (a) MALDI-TOF-MS spectrum of untreated human lung N-glycans. (b) MALDI-TOF-MS spectrum of human lung N-glycans treated with neuraminidase A. (c) MALDI-TOF-MS spectrum of human lung N-glycans treated with neuraminidase S. Peaks representing sialylated glycans are colored in red, non-sialylated glycans are in black and bisected glycans are underlined.
Figure 4
Figure 4
O-glycan MS profiles of human lung following neuraminidase treatment. All molecular ions detected represent permethylated species and are present in the form of [M + Na]+. (a) MALDI-TOF-MS spectrum of untreated human lung O-glycans. (b) MALDI-TOF-MS spectrum of human lung O-glycans treated with neuraminidase A. (c) MALDI-TOF-MS spectrum of human lung O-glycans treated with neuraminidase S. Peaks representing sialylated glycans are colored in red and non-sialylated glycans are in black. Symbol representations of monosaccharides are: yellow circle, Galactose; green circle, Mannose; red triangle, Fucose; blue square, N-acetylglucosamine; yellow square, N-acetylgalactosamine; purple diamond, N-acetylneuraminic acid.
Figure 5
Figure 5
Glycosphingolipid (GSL)-glycan MS profiles of human lung following neuraminidase treatment. All molecular ions detected represent reduced, permethylated species and are present in the form of [M + Na]+. (a) MALDI-TOF-MS spectrum of untreated human lung GSL-glycans. (b) MALDI-TOF-MS spectrum of human lung GSL-glycans treated with neuraminidase S. (c) MALDI-TOF-MS spectrum of human lung GSL-glycans treated with neuraminidase A. Peaks representing sialylated glycans are colored in red and non-sialylated glycans are in black. Symbol representations of monosaccharides are: yellow circle, Galactose; red triangle, Fucose; blue square, N-acetylglucosamine; half-blue/half-yellow square, N-acetylhexosamine; purple diamond, N-acetylneuraminic acid.
Figure 6
Figure 6
Comparison of glycosylation patterns between two human lungs. The relative intensities of selected N-glycans (a), O-glycans (b) and GSL-glycans (c) expressed by two human lungs are presented in a diverging bar chat. The length of a bar is proportional to the relative intensity (0–100%) of a peak detected on a MALDI-TOF-MS spectrum. A blue bar indicates the glycan is expressed by human lung-1 and an orange bar indicates the glycan is expressed by human lung-2. Peaks representing sialylated glycans are colored in red and non-sialylated glycans are in black.
Figure 7
Figure 7
Immunohistochemistry staining of human lung sections. To visualize the localization of α2,3- and α2,6-linked sialic acids and the patterns of influenza virus attachment, human respiratory tissue sections were stained with lectins and influenza viruses. (a) Lectin-histochemistry staining images of frozen human bronchus and small airway sections with lectins SNA and MAL-I or with X-31 and X31-HAM strains of influenza viruses before (−NA) or after (+NA) neuraminidase treatment. (b) Lectin-histochemistry staining images of formalin fixed paraffin embedded (FFPE) human lung sections with lectins SNA and MAL-I or with X-31 and X31-HAM strains of influenza viruses before (−NA) or after (+NA) neuraminidase treatment. (c) Summary of immunohistochemistry staining results. ++, strong staining; +, moderate staining; −/+, weak staining; −, no staining.

References

    1. Apweiler R, Hermjakob H, Sharon N. On the frequency of protein glycosylation, as deduced from analysis of the SWISS-PROT database. Biochim. Biophys. Acta. 1999;1473:4–8. doi: 10.1016/S0304-4165(99)00165-8. - DOI - PubMed
    1. Varki, A. Essentials of glycobiology. Third edition/Edited by Ajit Varki et al. Cold Spring Harbor Press (2017).
    1. Xu C, Ng DT. Glycosylation-directed quality control of protein folding. Nat. Rev. Mol. Cell Biol. 2015;16:742–752. doi: 10.1038/nrm4073. - DOI - PubMed
    1. Hardivillé S, Hart GW. Nutrient regulation of signaling, transcription, and cell physiology by O-GlcNAcylation. Cell Metab. 2014;20:208–213. doi: 10.1016/j.cmet.2014.07.014. - DOI - PMC - PubMed
    1. Macauley MS, Crocker PR, Paulson JC. Siglec-mediated regulation of immune cell function in disease. Nat. Rev. Immunol. 2014;14:653–666. doi: 10.1038/nri3737. - DOI - PMC - PubMed

Publication types