

miR-216a-targeting theranostic nanoparticles promote proliferation of insulin-secreting cells in type 1 diabetes animal model
- PMID: 32210316
- PMCID: PMC7093482
- DOI: 10.1038/s41598-020-62269-4
miR-216a-targeting theranostic nanoparticles promote proliferation of insulin-secreting cells in type 1 diabetes animal model
Abstract
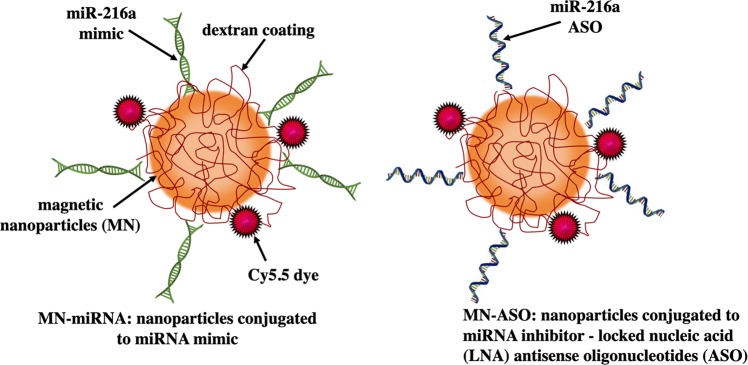
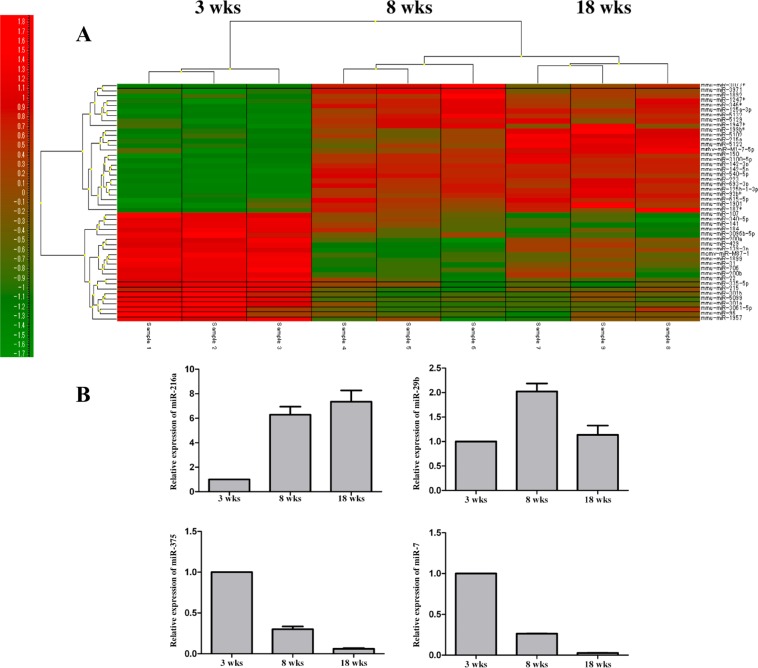
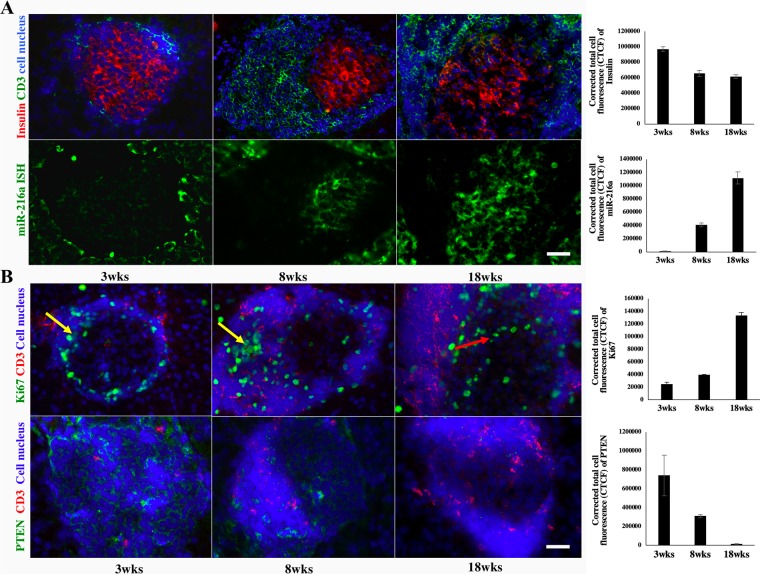
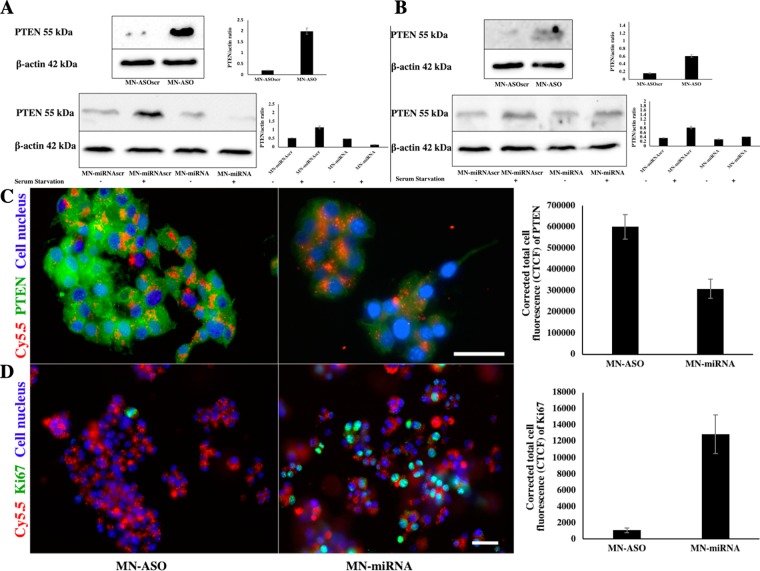
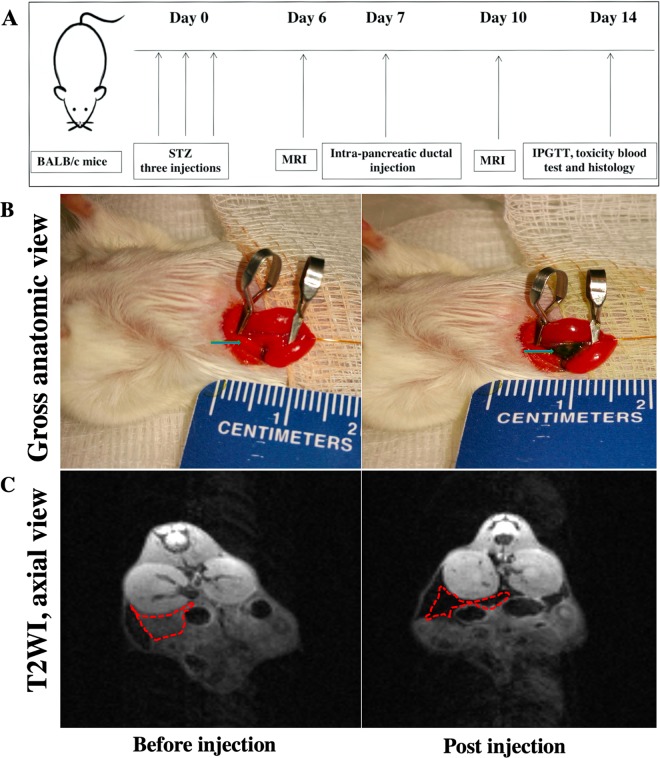
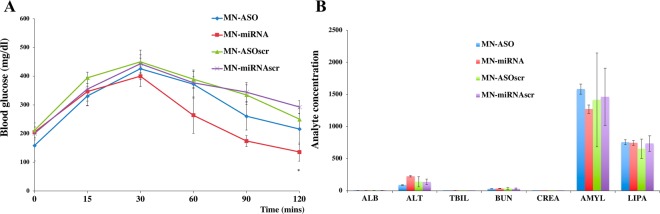
Aberrant expression of miRNAs in pancreatic islets is closely related to the development of type 1 diabetes (T1D). The aim of this study was to identify key miRNAs dysregulated in pancreatic islets during T1D progression and to develop a theranostic approach to modify their expression using an MRI-based nanodrug consisting of iron oxide nanoparticles conjugated to miRNA-targeting oligonucleotides in a mouse model of T1D. Isolated pancreatic islets were derived from NOD mice of three distinct age groups (3, 8 and 18-week-old). Total RNA collected from cultured islets was purified and global miRNA profiling was performed with 3D-Gene global miRNA microarray mouse chips encompassing all mouse miRNAs available on the Sanger miRBase V16. Of the miRNAs that were found to be differentially expressed across three age groups, we identified one candidate (miR-216a) implicated in beta cell proliferation for subsequent validation by RT-PCR. Alterations in miR-216a expression within pancreatic beta cells were also examined using in situ hybridization on the frozen pancreatic sections. For in vitro studies, miR-216a mimics/inhibitors were conjugated to iron oxide nanoparticles and incubated with beta cell line, βTC-6. Cell proliferation marker Ki67 was evaluated. Expression of the phosphatase and tensin homolog (PTEN), which is one of the direct targets of miR-216a, was analyzed using western blot. For in vivo study, the miR-216a mimics/inhibitors conjugated to the nanoparticles were injected into 12-week-old female diabetic Balb/c mice via pancreatic duct. The delivery of the nanodrug was monitored by in vivo MRI. Blood glucose of the treated mice was monitored post injection. Ex vivo histological analysis of the pancreatic sections included staining for insulin, PTEN and Ki67. miRNA microarray demonstrated that the expression of miR-216a in the islets from NOD mice significantly changed during T1D progression. In vitro studies showed that treatment with a miR-216a inhibitor nanodrug suppressed proliferation of beta cells and increased the expression of PTEN, a miR-216a target. In contrast, introduction of a mimic nanodrug decreased PTEN expression and increased beta cell proliferation. Animals treated in vivo with a mimic nanodrug had higher insulin-producing functionality compared to controls. These observations were in line with downregulation of PTEN and increase in beta cell proliferation in that group. Our studies demonstrated that miR-216a could serve as a potential therapeutic target for the treatment of diabetes. miR-216a-targeting theranostic nanodrugs served as exploratory tools to define functionality of this miRNA in conjunction with in vivo MR imaging.
Conflict of interest statement
The authors declare no competing interests.
Figures

Similar articles
-
miRNA Theranostic Nanoparticles Promote Pancreatic Beta Cell Proliferation in Type 1 Diabetes Model.Methods Mol Biol. 2023;2592:207-218. doi: 10.1007/978-1-0716-2807-2_15. Methods Mol Biol. 2023. PMID: 36507996
-
MiR-132 controls pancreatic beta cell proliferation and survival through Pten/Akt/Foxo3 signaling.Mol Metab. 2020 Jan;31:150-162. doi: 10.1016/j.molmet.2019.11.012. Epub 2019 Nov 22. Mol Metab. 2020. PMID: 31918917 Free PMC article.
-
Transforming growth factor (TGF)-β-induced microRNA-216a promotes acute pancreatitis via Akt and TGF-β pathway in mice.Dig Dis Sci. 2015 Jan;60(1):127-35. doi: 10.1007/s10620-014-3261-9. Epub 2014 Dec 12. Dig Dis Sci. 2015. PMID: 25501921
-
The small RNA miR-375 - a pancreatic islet abundant miRNA with multiple roles in endocrine beta cell function.Mol Cell Endocrinol. 2017 Nov 15;456:95-101. doi: 10.1016/j.mce.2017.02.043. Epub 2017 Feb 27. Mol Cell Endocrinol. 2017. PMID: 28254488 Review.
-
microRNAs in Type 1 Diabetes: Roles, Pathological Mechanisms, and Therapeutic Potential.Int J Mol Sci. 2025 Apr 2;26(7):3301. doi: 10.3390/ijms26073301. Int J Mol Sci. 2025. PMID: 40244147 Free PMC article. Review.
Cited by
-
The miR-216/miR-217 Cluster Regulates Lipid Metabolism in Laying Hens With Fatty Liver Syndrome via PPAR/SREBP Signaling Pathway.Front Vet Sci. 2022 May 31;9:913841. doi: 10.3389/fvets.2022.913841. eCollection 2022. Front Vet Sci. 2022. PMID: 35711801 Free PMC article.
-
Artificial Intelligence Analysis of Magnetic Particle Imaging for Islet Transplantation in a Mouse Model.Mol Imaging Biol. 2021 Feb;23(1):18-29. doi: 10.1007/s11307-020-01533-5. Epub 2020 Aug 24. Mol Imaging Biol. 2021. PMID: 32833112 Free PMC article.
-
Altered Expression of Vitamin D Metabolism Genes and Circulating MicroRNAs in PBMCs of Patients with Type 1 Diabetes: Their Association with Vitamin D Status and Ongoing Islet Autoimmunity.Noncoding RNA. 2023 Oct 7;9(5):60. doi: 10.3390/ncrna9050060. Noncoding RNA. 2023. PMID: 37888206 Free PMC article.
-
Advanced Delivery Strategies for Immunotherapy in Type I Diabetes Mellitus.BioDrugs. 2023 May;37(3):331-352. doi: 10.1007/s40259-023-00594-6. Epub 2023 May 13. BioDrugs. 2023. PMID: 37178431 Free PMC article. Review.
-
Current Progress and Perspective: Clinical Imaging of Islet Transplantation.Life (Basel). 2020 Sep 19;10(9):213. doi: 10.3390/life10090213. Life (Basel). 2020. PMID: 32961769 Free PMC article. Review.
References
-
- Panwar, N., et al. Nanocarbons for Biology and Medicine: Sensing, Imaging, and Drug Delivery. Chem Rev. (2019). - PubMed
MeSH terms
Substances
Grants and funding
LinkOut - more resources
Full Text Sources
Medical
Molecular Biology Databases
Research Materials
