. 2020 Feb 21;16(8):1363-1375.
doi: 10.7150/ijbs.41395. eCollection 2020.

Quantitative determination of niraparib and olaparib tumor distribution by mass spectrometry imaging

Affiliations

Quantitative determination of niraparib and olaparib tumor distribution by mass spectrometry imaging

Lavinia Morosi et al. Int J Biol Sci. .

Abstract

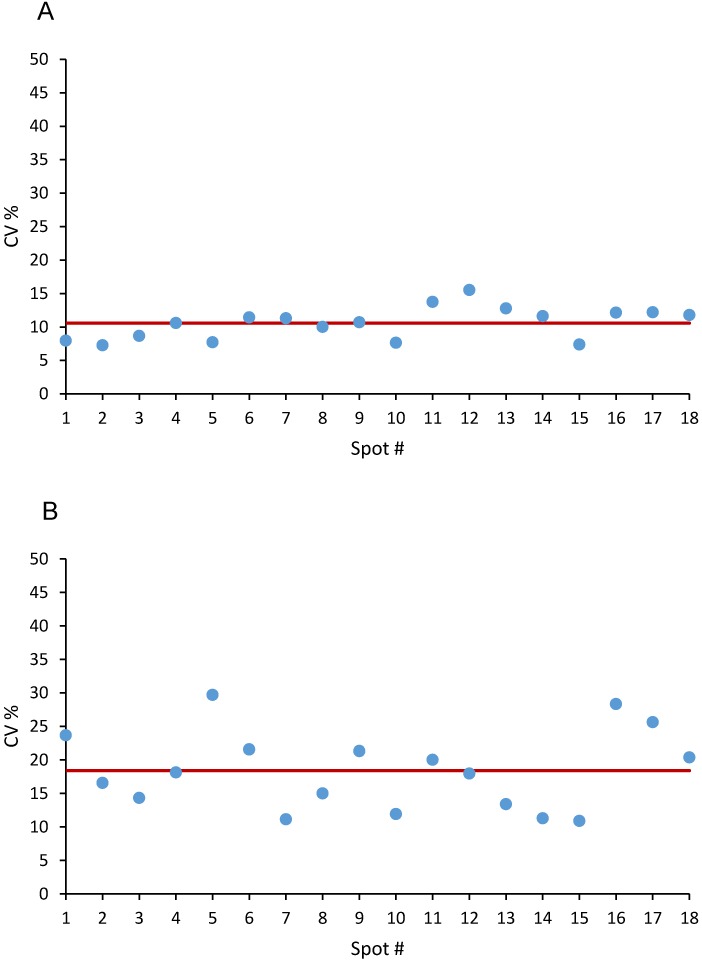
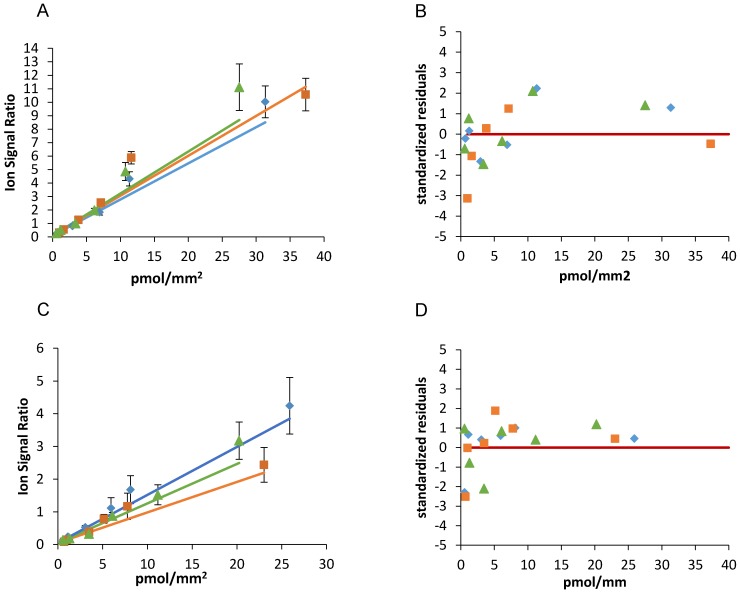
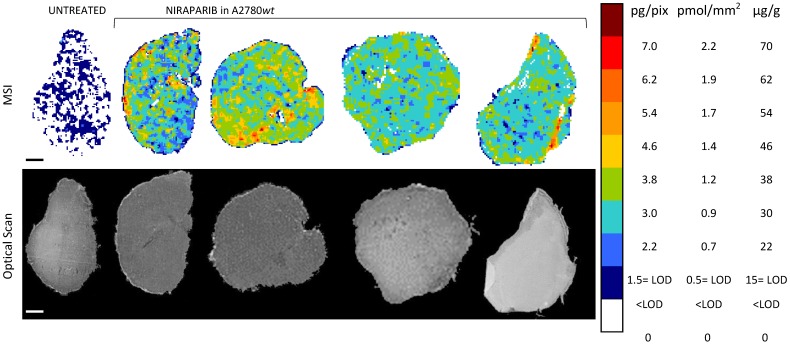
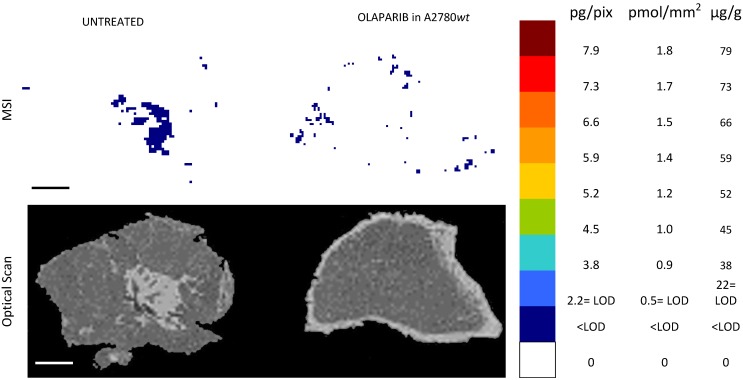
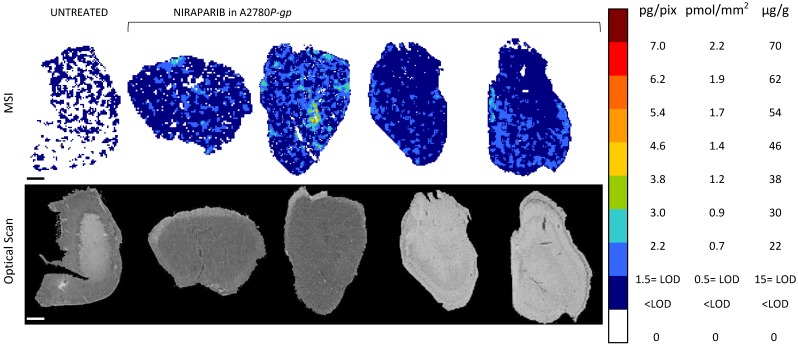
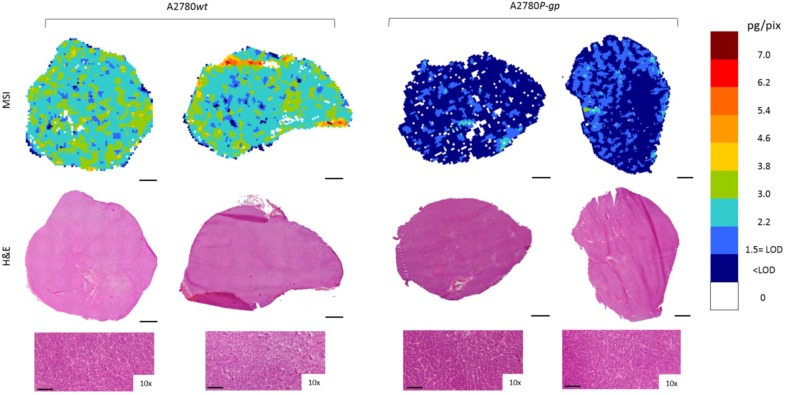
Rationale: Optimal intratumor distribution of an anticancer drug is fundamental to reach an active concentration in neoplastic cells, ensuring the therapeutic effect. Determination of drug concentration in tumor homogenates by LC-MS/MS gives important information about this issue but the spatial information gets lost. Targeted mass spectrometry imaging (MSI) has great potential to visualize drug distribution in the different areas of tumor sections, with good spatial resolution and superior specificity. MSI is rapidly evolving as a quantitative technique to measure the absolute drug concentration in each single pixel. Methods: Different inorganic nanoparticles were tested as matrices to visualize the PARP inhibitors (PARPi) niraparib and olaparib. Normalization by deuterated internal standard and a custom preprocessing pipeline were applied to achieve a reliable single pixel quantification of the two drugs in human ovarian tumors from treated mice. Results: A quantitative method to visualize niraparib and olaparib in tumor tissue of treated mice was set up and validated regarding precision, accuracy, linearity, repeatability and limit of detection. The different tumor penetration of the two drugs was visualized by MSI and confirmed by LC-MS/MS, indicating the homogeneous distribution and higher tumor exposure reached by niraparib compared to olaparib. On the other hand, niraparib distribution was heterogeneous in an ovarian tumor model overexpressing the multidrug resistance protein P-gp, a possible cause of resistance to PARPi. Conclusions: The current work highlights for the first time quantitative distribution of PAPRi in tumor tissue. The different tumor distribution of niraparib and olaparib could have important clinical implications. These data confirm the validity of MSI for spatial quantitative measurement of drug distribution providing fundamental information for pharmacokinetic studies, drug discovery and the study of resistance mechanisms.

Keywords: PARPi; drug distribution; mass spectrometry imaging.


Conflict of interest statement

Competing Interests: The authors have declared that no competing interest exists.

Figures

Figure 1
Figure 1
2D images of the normalized niraparib ion signal after application of the median filter (3x3) in an untreated tumor (A) and in a calibration curve section (B). The dotted white square depict the 100 pixel ROIs taken into account for calibration. Cumulative distribution of normalized drug-related signals in the pixel of untreated tumor and of the ROIs of each calibration spot (C). The value at 95% of the distribution of untreated tumor (dotted black line) corresponds to the LOB. The LOD correspond to the mean of first distribution whose only the 5% is under the LOB (D). In this example the LOD is the mean of the signals of spot 1pmol (dotted red line).
Figure 2
Figure 2
Precision at single pixel level expressed as CV% in 18 spot of Niraparib (A) and of Olaparib (B). The red line corresponds to the mean CV%.
Figure 3
Figure 3
Niraparib (A) and olaparib (C) calibration curves spotted the same working day and the corresponding standardized residuals (B and D). The red lines indicate the zero.
Figure 4
Figure 4
Niraparib quantitative distribution by MSI in the ovarian cancer model A2780wt. One representative section of the three analyzed for each tumor is shown. The lower panel shows the corresponding optical scan of the sections. Scale bar: 1mm
Figure 5
Figure 5
Olaparib resulted undetectable by MSI in the ovarian cancer model A2780wt. One representative tumor of the four analyzed is shown. The lower panel shows the corresponding optical scan of the sections. Scale bar: 1mm
Figure 6
Figure 6
Niraparib quantitative distribution by MSI in the ovarian cancer model A2780P-gp. One representative section of the three analyzed for each tumor is shown. The lower panel shows the corresponding optical scan of the sections. Scale bar: 1mm
Figure 7
Figure 7
Niraparib quantitative distribution by MSI in the ovarian cancer models compared to H&E staining on the adjacent section. The lower panels show a 10x enlargement of the section. One representative section of the three analyzed for each tumor is shown. Scale bar: 1mm or 100µm (10x images)

References

    1. Webb PM, Jordan SJ. Epidemiology of epithelial ovarian cancer. Best Pract Res Clin Obstet Gynaecol. 2017;41:3–14. doi: 10.1016/j.bpobgyn.2016.08.006. - DOI - PubMed
    1. Christie EL, Bowtell DDL. Acquired chemotherapy resistance in ovarian cancer. Ann Oncol. 2017;28:viii13–5. doi: 10.1093/annonc/mdx446. - DOI - PubMed
    1. Mirza MR, Monk BJ, Herrstedt J, Oza AM, Mahner S, Redondo A. et al. Niraparib Maintenance Therapy in Platinum-Sensitive, Recurrent Ovarian Cancer. N Engl J Med. 2016;375:2154–64. doi: 10.1056/NEJMoa1611310. - DOI - PubMed
    1. Ledermann J, Harter P, Gourley C, Friedlander M, Vergote I, Rustin G. et al. Olaparib maintenance therapy in platinum-sensitive relapsed ovarian cancer. N Engl J Med. 2012;366:1382–92. doi: 10.1056/NEJMoa1105535. - DOI - PubMed
    1. Kaufman B, Shapira-Frommer R, Schmutzler RK, Audeh MW, Friedlander M, Balmaña J. et al. Olaparib monotherapy in patients with advanced cancer and a germline BRCA1/2 mutation. J Clin Oncol. 2015;33:244–50. doi: 10.1200/JCO.2014.56.2728. - DOI - PMC - PubMed

Publication types