. 2020 Mar 10:14:167.
doi: 10.3389/fnins.2020.00167. eCollection 2020.

Differences in Net Information Flow and Dynamic Connectivity Metrics Between Physically Active and Inactive Subjects Measured by Functional Near-Infrared Spectroscopy (fNIRS) During a Fatiguing Handgrip Task

Affiliations

Differences in Net Information Flow and Dynamic Connectivity Metrics Between Physically Active and Inactive Subjects Measured by Functional Near-Infrared Spectroscopy (fNIRS) During a Fatiguing Handgrip Task

Elizabeth L Urquhart et al. Front Neurosci. .

Abstract

Twenty-three young adults (4 Females, 25.13 ± 3.72 years) performed an intermittent maximal handgrip force task using their dominant hand for 20 min (3.5 s squeeze/6.5 s release, 120 blocks) with concurrent cortical activity imaging by functional Near-Infrared Spectroscopy (fNRIS; OMM-3000, Shimadzu Corp., 111 channels). Subjects were grouped as physically active (n = 10) or inactive (n = 12) based on a questionnaire (active-exercise at least four times a week, inactive- exercise less than two times a week). We explored how motor task fatigue affected the vasomotion-induced oscillations in ΔHbO as measured by fNIRS at each hemodynamic frequency band: endothelial component (0.003-0.02 Hz) associated to microvascular activity, neurogenic component (0.02-0.04 Hz) related to intrinsic neuronal activity, and myogenic component (0.04-0.15 Hz) linked to activity of smooth muscles of arterioles. To help understand how these three neurovascular regulatory mechanisms relate to handgrip task performance we quantified several dynamic fNIRS metrics, including directional phase transfer entropy (dPTE), a computationally efficient and data-driven method used as a marker of information flow between cortical regions, and directional connectivity (DC), a means to compute directionality of information flow between two cortical regions. The relationship between static functional connectivity (SFC) and functional connectivity variability (FCV) was also explored to understand their mutual dependence for each frequency band in the context of handgrip performance as fatigued increased. Our findings ultimately showed differences between subject groups across all fNIRS metrics and hemodynamic frequency bands. These findings imply that physical activity modulates neurovascular control mechanisms at the endogenic, neurogenic, and myogenic frequency bands resulting in delayed fatigue onset and enhanced performance. The dynamic cortical network metrics quantified in this work for young, healthy subjects provides baseline measurements to guide future work on older individuals and persons with impaired cardiovascular health.

Keywords: directional connectivity; directional phase transfer entropy; fatigue; functional connectivity variability; sensory-motor cortex.


Figures

FIGURE 1
FIGURE 1
Experimental set up and protocol timeline for the handgrip task. (A) FNIRS 111-channel layout with eleven regions of interest (ROIs) covered by the probe geometry: left and right frontopolar (lFP; rFP) (red), left and right pre-frontal cortex (lDLPFC; rDLPFC) (yellow), Broca’s area (green), left and right pre-motor cortex (lPMC; rPMC) (light blue), left and right primary motor and sensory cortical (lM1/S1; rM1/S1) areas (purple), and left and right sensory association cortex (lSAC; rSAC) (pink). (B) Each circle shows the spatial average of the probe coordinates in each ROI, per brain hemisphere. These averaged probe locations served as reference points for plotting dPTE and DC between ROIs in this work. (C) Schematic of the experimental set-up of the fNIRS (LABNIRS) system and the BIOPAC handgrip force sensor system with one representative source-detector channel shown for simplicity. (D) The handgrip task protocol, starting with a 5-minute baseline. Subjects performed intermittent handgrip contractions for 3.5 s followed by 6.5 s of rest for 120 blocks at 100% MVC.
FIGURE 2
FIGURE 2
Force produced during intermittent handgrip contractions while physically inactive and active subjects attempted to attain 100% MVC. Each bar represents an average of 60 consecutive trials, expressed as the Mean (bar height) ± Standard Error to the Mean (SEM; error bar). ∗∗p < 0.01, ∗∗∗p < 0.001.
FIGURE 3
FIGURE 3
Significant dPTE and DC in the endogenic frequency band for inactive and active subjects during the handgrip task for ΔHbO. Directed PTE t-values for each ROI as a color-coded map for inactive subjects (A–C) and active subjects (D–F). Hot (yellow-reds) and cold (light blue-dark blue) colors indicate information outflow and inflow, respectively. Arrows indicate statistically significant information flow between functional regions for inactive (G–I) and active subjects (J–L). Black arrows (p < 0.05); Red arrows (p < 0.01). Eleven regions of interest (ROIs) were mapped: left and right frontopolar (lFP; rFP) (red), left and right pre-frontal cortex (lDLPFC; rDLPFC) (yellow), Broca’s area (green), left and right pre-motor cortex (lPMC; rPMC) (light blue), left and right primary motor and sensory cortical (lM1/S1; rM1/S1) areas (purple), and left and right sensory association cortex (lSAC; rSAC) (pink).
FIGURE 4
FIGURE 4
Significant dPTE and DC in the neurogenic frequency band for inactive and active subjects during the handgrip task for ΔHbO. Directed PTE t-values for each ROI as a color-coded map for inactive subjects (A–C) and active subjects (D–F). Hot (yellow-reds) and cold (light blue-dark blue) colors indicate information outflow and inflow, respectively. Arrows indicate statistically significant information flow between functional regions for inactive (G–I) and active subjects (J–L). Black arrows (p < 0.05); Red arrows (p < 0.01). Eleven regions of interest (ROIs) were mapped: left and right frontopolar (lFP; rFP) (red), left and right pre-frontal cortex (lDLPFC; rDLPFC) (yellow), Broca’s area (green), left and right pre-motor cortex (lPMC; rPMC) (light blue), left and right primary motor and sensory cortical (lM1/S1; rM1/S1) areas (purple), and left and right sensory association cortex (lSAC; rSAC) (pink).
FIGURE 5
FIGURE 5
Significant dPTE and DC in the myogenic frequency band for inactive and active subjects during the handgrip task for ΔHbO. Directed PTE t-values for each ROI as a color-coded map for inactive subjects (A–C) and active subjects (D–F). Hot (yellow-reds) and cold (light blue-dark blue) colors indicate information outflow and inflow, respectively. Arrows indicate statistically significant information flow between functional regions for inactive (G–I) and active subjects (J–L). Black arrows (p < 0.05); Red arrows (p < 0.01). Eleven regions of interest (ROIs) were mapped: left and right frontopolar (lFP; rFP) (red), left and right pre-frontal cortex (lDLPFC; rDLPFC) (yellow), Broca’s area (green), left and right pre-motor cortex (lPMC; rPMC) (light blue), left and right primary motor and sensory cortical (lM1/S1; rM1/S1) areas (purple), and left and right sensory association cortex (lSAC; rSAC) (pink).
FIGURE 6
FIGURE 6
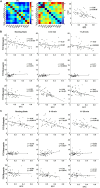
Pattern comparison between static functional connectivity (SFC) and functional connectivity variability (FCV) at endogenic, neurogenic, and myogenic frequencies for inactive and active subjects during the handgrip task. (A) A representative example of the group-averaged SFC matrix (left), the FCV matrix (middle), and the linear relationship between them (right). (B) Correlation plots between SFC and FCV for inactive subjects and (C) active subjects at endogenic (top), neurogenic (middle), and myogenic (bottom) frequencies during resting state (left), 0–10 min (middle), and 11–20 min (right) of the handgrip task.

References

    1. Aalkjaer C., Boedtkjer D., Matchkov V. (2011). Vasomotion - what is currently thought? Acta Physiol. 202 253–269. 10.1111/j.1748-1716.2011.02320.x - DOI - PubMed
    1. Allen E. A., Damaraju E., Plis S. M., Erhardt E. B., Eichele T., Calhoun V. D. (2014). Tracking whole-brain connectivity dynamics in the resting state. Cereb. Cortex 24 663–676. 10.1093/cercor/bhs352 - DOI - PMC - PubMed
    1. Andersen A. V., Simonsen S. A., Schytz H. W., Iversen H. K. (2018). Assessing low-frequency oscillations in cerebrovascular diseases and related conditions with near-infrared spectroscopy: a plausible method for evaluating cerebral autoregulation? Neurophotonics 5:030901. 10.1117/1.NPh.5.3.030901 - DOI - PMC - PubMed
    1. Anwar A. R., Muthalib M., Perrey S., Galka A., Granert O., Wolff S., et al. (2013). Comparison of causality analysis on simultaneously measured fMRI and NIRS signals during motor tasks. Conf. Proc. IEEE Eng. Med. Biol. Soc. 2013 2628–2631. 10.1109/EMBC.2013.6610079 - DOI - PubMed
    1. Anwar A. R., Muthalib M., Perrey S., Galka A., Granert O., Wolff S., et al. (2016). Effective connectivity of cortical sensorimotor networks during finger movement tasks: a simultaneous fNIRS, fMRI, EEG study. Brain Topogr. 29 645–660. 10.1007/s10548-016-0507-1 - DOI - PubMed

LinkOut - more resources