. 2020 Mar 6:14:174.
doi: 10.3389/fnins.2020.00174. eCollection 2020.

Motorized Shoes Induce Robust Sensorimotor Adaptation in Walking

Affiliations

Motorized Shoes Induce Robust Sensorimotor Adaptation in Walking

Yashar Aucie et al. Front Neurosci. .

Abstract

The motor system has the flexibility to update motor plans according to systematic changes in the environment or the body. This capacity is studied in the laboratory through sensorimotor adaptation paradigms imposing sustained and predictable motor demands specific to the task at hand. However, these studies are tied to the laboratory setting. Thus, we asked if a portable device could be used to elicit locomotor adaptation outside the laboratory. To this end, we tested the extent to which a pair of motorized shoes could induce similar locomotor adaptation to split-belt walking, which is a well-established sensorimotor adaptation paradigm in locomotion. We specifically compared the adaptation effects (i.e. after-effects) between two groups of young, healthy participants walking with the legs moving at different speeds by either a split-belt treadmill or a pair of motorized shoes. The speeds at which the legs moved in the split-belt group was set by the belt speed under each foot, whereas in the motorized shoes group were set by the combined effect of the actuated shoes and the belts' moving at the same speed. We found that the adaptation of joint motions and measures of spatial and temporal asymmetry, which are commonly used to quantify sensorimotor adaptation in locomotion, were indistinguishable between groups. We only found small differences in the joint angle kinematics during baseline walking between the groups - potentially due to the weight and height of the motorized shoes. Our results indicate that robust sensorimotor adaptation in walking can be induced with a paired of motorized shoes, opening the exciting possibility to study sensorimotor adaptation during more realistic situations outside the laboratory.

Keywords: locomotion; motor learning; portable device; real-world; rehabilitation robotics.


Figures

FIGURE 1
FIGURE 1
(A) A motorized shoe involving proprietary technology was used to induce adaptation in the motorized shoes group. (B) Schematic of the motorized shoe. This consists of a motor, a controller box, a gearbox, two toothed timing belts, and four rubber wheels. (C) Mean time courses for foot speed across participants for the motorized shoes and the split-belt groups. The white background indicates experimental epochs of “tied” walking when both feet moved at the same speed, whereas the gray background indicates the epoch of “split” walking when the dominant leg moved three times faster than the non-dominant leg. The table summarizes the procedure used to set the slow, fast, and medium speeds for each foot. The same procedure was used in all epochs. It is worth pointing out that the treadmill always moved at 1.5 m/s during adaptation in the motorized shoes group. The speed difference between feet was achieved by locking the wheels on the fast side and moving the slow foot forward at 1 m/s to obtain a net speed of 0.5 m/s on the slow side. Of note, the foot’s speed on the fast side was slightly slower on the motorized shoes than the split-belt group.
FIGURE 2
FIGURE 2
(A) This schematic illustrates step length asymmetry and its decomposition into StepPosition, StepTime, and StepVelocity. Step length asymmetry is quantified as the difference between fast and slow step lengths, normalized by stride length. The equation and decomposition are explained in detail in the section “Materials and Methods” of this manuscript. In brief, (StepPosition) differences between the fast (black leg) and the slow (gray leg) leading leg’s positions contribute to step length asymmetry. Similarly, differences in the trailing leg’s positions (white legs) also contribute to step length asymmetry. The trailing leg’s position depends on step time and step velocity. Consequently, differences in step times (tfast and tslow) or step velocity (Vfast and Vslow) leads to step length asymmetry. We also show a schematic of Cadence, which is computed as the inverse of the gait period (T). (B) Illustration of reflective marker positions and joint angle conventions. (C) Epochs of interest are illustrated by the red circles placed over a schematic of step length asymmetry. Shaded gray area represents the adaptation period when the feet move at different speeds (“split” walking), whereas white areas represent when the feet move at the same speed.
FIGURE 3
FIGURE 3
Modulation of step length asymmetry and step lengths. (A–C, Left panel) Time courses for step length asymmetry and individual step lengths during medium baseline, adaptation, and post-adaptation. Shaded gray area represents the adaptation period when the feet move at different speeds (“split” walking), whereas white areas represent when the feet move at the same speed. Colored dots represent the group average of five consecutive strides and colored shaded regions indicate the standard error for each group (motorized shoes: red; split-belt: blue). (A–C, Right panel) Bar plots indicate the mean ± standard errors for step length asymmetry and step lengths for each group and epoch of interest. Note that the reported step lengths are unbiased. This was done by subtracting the averaged step length values during baseline at medium speed in each participant. Significant differences for post hoc tests were indicated as follows. Black asterisks over the bracket above each epoch represent statistical significant differences between the motorized shoes and the split-belt groups (p < 0.05). Colored asterisks over the bars indicate significant after-effects (i.e. early post-adaptation is significantly different from baseline; p < 0.05) for each of the groups (motorized shoes: red; split-belt: blue). The small bar plots on the right indicate the mean ± standard errors for the step lengths for each group during medium baseline.
FIGURE 4
FIGURE 4
Adaptation of spatiotemporal components of step length asymmetry. (A–C, Left panel) Time courses for StepPosition, StepTime, and StepVelocity before, during, and after adaptation. Shaded gray area represents the adaptation period when the feet move at different speeds (“split” walking), whereas white areas represent when the feet move at the same speed. Colored dots represent the group average of five consecutive strides and colored shaded regions indicate the standard error for each group (motorized shoes: red; split-belt: blue). (A–C, Right panel) The bar plots indicate the mean ± standard errors for StepPosition, StepTime, and StepVelocity for each group and epoch of interest. Gray dots represent individual participants. Note that the values were corrected for baseline biases. Significant differences for post hoc tests were indicated as follows. Black asterisks over the bracket above each epoch represent statistical significant differences between the motorized shoes and the split-belt groups (p < 0.05). Colored asterisks over the bars indicate significant after-effects (i.e. early post-adaptation is significantly different from baseline; p < 0.05) for each of the groups (motorized shoes: red; split-belt: blue). (D) Scatter plots illustrate the association between the StepVelocity at steady state and either the StepPosition or StepTime at steady-state during adaptation (i.e. LAdapt). We present the p-values for the multiple regression model (p), for the continuous variable (StepVelocity, p_velocity) and for the categorical variable (group, p_group). (E) Scatter plots illustrate the association between the LAdapt and EPost for StepPosition and StepTime. No significant relations were observed for neither StepPosition nor StepTime.
FIGURE 5
FIGURE 5
Modulation of cadence. (Left) Time courses during medium baseline, adaptation, and post-adaptation for the average cadence is shown for each group. Shaded gray area represents the adaptation period when the feet move at different speeds (“split” walking), whereas white areas represent when the feet move at the same speed. Colored dots represent the group average of five consecutive strides and colored shaded regions indicate the standard error for each group (motorized shoes: red; split-belt: blue). (Right) Bar plots indicate the mean ± standard errors for cadence for each group and epoch of interest. Note that the values were corrected for baseline biases (i.e. MidBase). Colored asterisks over the bars indicate significant after-effects (i.e. early post-adaptation is significantly different from baseline; p < 0.05) for each of the groups (motorized shoes: red; split-belt: blue). The small bar plot on the right indicates the mean ± standard errors for the Cadence for each group during medium baseline.
FIGURE 6
FIGURE 6
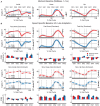
Joint angles over the gait cycle during baseline and adaptation. (A) Baseline joint angles are shown for the group walking with regular sneakers (i.e. blue trace) and the group walking with the motorized shoes (i.e. red trace). Solid lines represent the group average and shaded areas represent standard errors. Asterisks indicate instances during the gait cycle when joint angles were significantly different across groups. The overall motion for all joints was similar across groups, but hip flexion, knee flexion, and ankle dorsiflexion were smaller when wearing the motorized shoes. (B) Speed specific baseline (gray) and steady-state angle trajectories during adaptation for the motorized shoes (red) and the split-belt (blue) groups. Solid lines represent the motion of the leg walking fast in the split condition (colored lines) and in the fast baseline (gray) condition. The dashed lines represent the motion of the leg walking slow in the split condition (colored lines) and in the slow baseline (gray) condition. The bars represent the change from the speed-specific baseline to late adaptation in joint angles during different phases of the gait cycle. DS, double support; SS, single stance; SW, swing; DF, dorsiflexion; PF, plantarflexion; F, flexion; E, extension.

References

    1. Afzal M. R., Oh M. K., Lee C. H., Park Y. S., Yoon J. (2015). A portable gait asymmetry rehabilitation system for individuals with stroke using a vibrotactile feedback. Biomed Res. Int. 2015:375638. 10.1155/2015/375638 - DOI - PMC - PubMed
    1. Aucie Y., Zhang X., Sargent R., Torres-oviedo G., Robotics N., Torres-oviedo G. (2019). Motorized shoes induce robust sensorimotor adaptation in walking. bioRxiv [Preprint] - PMC - PubMed
    1. Awad L. N., Bae J., O’Donnell K., De Rossi S. M. M., Hendron K., Sloot L. H., et al. (2017). A soft robotic exosuit improves walking in patients after stroke. Sci. Transl. Med. 9:eaai9084. 10.1126/scitranslmed.aai9084 - DOI - PubMed
    1. Bae J., Siviy C., Rouleau M., Menard N., Odonnell K., Geliana I., et al. (2018). “A lightweight and efficient portable soft exosuit for paretic ankle assistance in walking after stroke,” in Proceedings of the IEEE International Conference on Robotics and Automation, Brisbane, 2820–2827. 10.1109/ICRA.2018.8461046 - DOI
    1. Benjamini Y., Hochberg Y. (1995). Controlling the false discovery rate: a practical and powerful approach to multiple testing. J. R. Stat. Soc. Ser. B 57 289–300. 10.1111/j.2517-6161.1995.tb02031.x - DOI

LinkOut - more resources