. 2020 Mar 10:14:43.
doi: 10.3389/fncel.2020.00043. eCollection 2020.

CD8 T-cell Recruitment Into the Central Nervous System of Cuprizone-Fed Mice: Relevance to Modeling the Etiology of Multiple Sclerosis

Affiliations

CD8 T-cell Recruitment Into the Central Nervous System of Cuprizone-Fed Mice: Relevance to Modeling the Etiology of Multiple Sclerosis

Mohammed S M Almuslehi et al. Front Cell Neurosci. .

Abstract

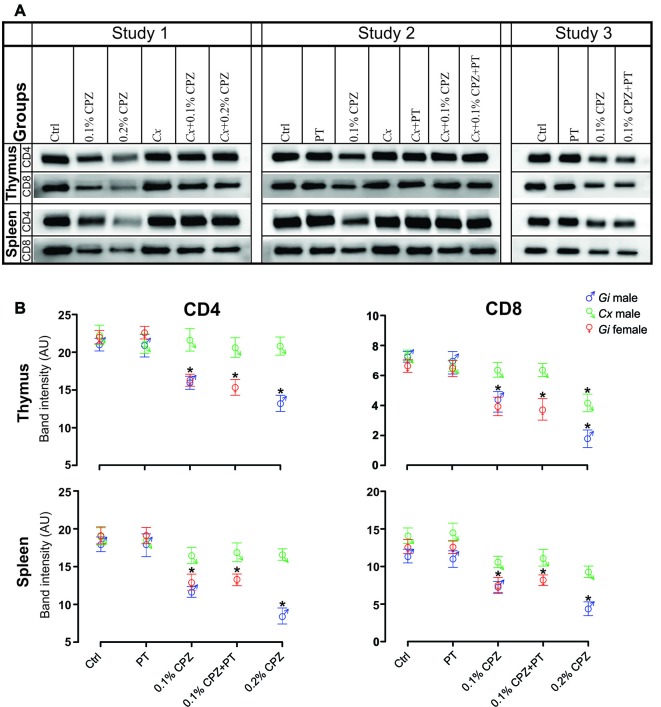
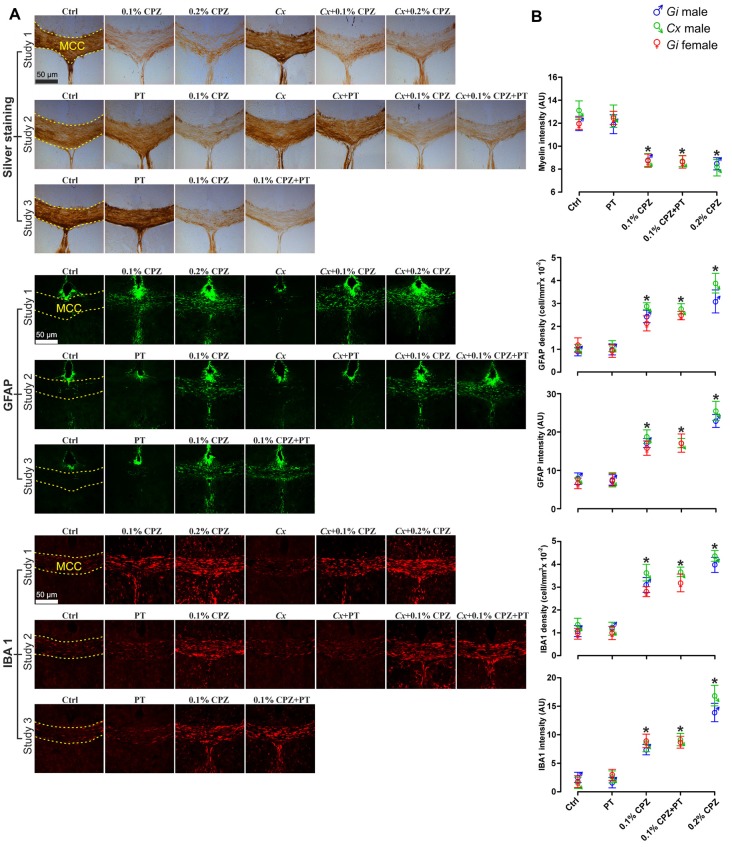
Cuprizone (CPZ)-feeding in mice induces atrophy of peripheral immune organs (thymus and spleen) and suppresses T-cell levels, thereby limiting its use as a model for studying the effects of the immune system in demyelinating diseases such as Multiple Sclerosis (MS). To investigate whether castration (Cx) can protect the peripheral immune organs from CPZ-induced atrophy and enable T-cell recruitment into the central nervous system (CNS) following a breach of the blood-brain barrier (BBB), three related studies were carried out. In Study 1, Cx prevented the dose-dependent reductions (0.1% < 0.2% CPZ) in thymic and splenic weight, size of the thymic medulla and splenic white pulp, and CD4 and CD8 (CD4/8) levels remained comparable to gonadally intact (Gi) control males. Importantly, 0.1% and 0.2% CPZ were equipotent at inducing central demyelination and glial activation. In Study 2, combining Cx with 0.1% CPZ-feeding and BBB disruption with pertussis toxin (PT) enhanced CD8+ T-cell recruitment into the CNS. The increased CD8+ T-cell level observed in the parenchyma of the cerebrum, cerebellum, brainstem and spinal cord were confirmed by flow cytometry and western blot analyses of CNS tissue. In Study 3, PT+0.1% CPZ-feeding to Gi female mice resulted in similar effects on the peripheral immune organs, CNS demyelination, and gliosis comparable to Gi males, indicating that testosterone levels alone were not responsible for the immune response seen in Study 2. The combination of Cx+0.1% CPZ-feeding+PT indicates that CPZ-induced demyelination can trigger an "inside-out" immune response when the peripheral immune system is spared and may provide a better model to study the initiating events in demyelinating conditions such as MS.

Keywords: atrophy; castration; demyelination; gliosis; gonadally intact; inside-out; peripheral immune organs.


Figures

Figure 1
Figure 1
Effects of cuprizone (CPZ)-feeding or castration (Cx) on thymus and spleen size and weight. Representative examples of the gross appearance of the thymus and spleen organs (A) and quantification of the wet weights (B) of the different treatment groups used in the three different studies. In gondally intact (Gi) males and females, CPZ-feeding produced a dose-dependent reduction in immune organ mass (p < 0.05). In the Cx groups, Cx significantly increased thymic mass compared to Gi males and females (p < 0.05) and prevented CPZ-induced thymic and splenic atrophy (p > 0.05). In Gi female mice CPZ-induced atrophy was indistinguishable to that observed in Gi males. Data are presented as mean ± SEM, one-way analysis of variance (ANOVA), n = 10 thymic or spleens/group. *Indicates a significant difference from Ctrl (p < 0.05).
Figure 2
Figure 2
Effects of CPZ-feeding or castration on peripheral immune organs histology. H&E images of the thymus (A) and spleen (B), headed arrows identifying the thymic cortex ), medulla (), the splenic red pulp () and white pulp () regions, in the different groups of the three separate studies. Quantification of the mean ± SEM thymic cortex/medulla (C) and splenic red pulp/white pulp ratios (D). Thymic cortex/medulla and splenic red pulp/white pulp ratios were significantly decreased by 0.1% CPZ in both Gi male and female mice and by 0.2% CPZ in Gi males compared to Ctrl whereas these ratios were unchanged in Cx groups. One-way ANOVA, n = 3 thymic or spleens/group, five sections/organ; *indicates significant difference from Ctrl (p < 0.05).
Figure 3
Figure 3
Effects of CPZ-feeding or castration (Cx) on CD4 and CD8 signal intensity in the immune organs of male and female mice. Representative examples of western blot images of CD4 and CD8 signal intensities (A) and their quantification (B) in the different groups in the three separate studies. CD4/8 signal intensities were significantly reduced in the thymus and spleen of Gi CPZ-fed male and female mice, whereas CD4/8 signals were completely restored in all Cx groups in thymus and spleen except that CD8 signal of the thymus in Cx+0.2% CPZ group was markedly attenuated. SDS-PAGE gels were loaded with a 20 μg/well of total protein; one-way ANOVA, n = 3 thymic or spleens/group, all samples were processed in triplicate; *indicates significant difference from Ctrl (p < 0.05).
Figure 4
Figure 4
Effects of CPZ-feeding or Cx on the central nervous system (CNS) histology. Representative silver, GFAP and IBA 1 staining images (A) and quantification (B) of silver staining intensity and astrocytes/microglia fluorescence intensity and cell density (cell/mm3) in the midline corpus callosum (MCC). 0.1% and 0.2% CPZ-feeding produced identical loss (p < 0.05) of myelin intensity in Gi male mice. The silver intensity was unaffected following Cx in all castrated groups. 0.1% CPZ-feeding to Gi male and female mice induced comparable demyelination. Fluorescence intensity and cell density of GFAP and IBA 1 stained sections were significantly (p < 0.05) increased in a dose-dependent manner (0.1% < 0.2% CPZ) in Gi and Cx males. The increase in the fluorescence intensity and density were indistinguishable between males and females when mice were fed with 0.1% CPZ. One-way ANOVA, n = 5 mice/group, 10 sections/brain; *indicates significant difference from Ctrl (p < 0.05), and dashed yellow line indicates quantification area.
Figure 5
Figure 5
Flow cytometric analysis of T-cell subpopulations (CD4+ and CD8+) in the immune organs of male mice. Representative flow cytometry dot blots of thymic CD4 and CD8 T-cells (A) and the quantification of their cell number in thymus and spleen tissue from Study 2 (B). CD4/8 number was significantly reduced in the thymus and spleen of 0.1% CPZ-fed mice compared to Ctrl. The numbers of CD4/8 increased in all Cx groups compared to Ctrl and were unaffected by CPZ. Cell counts in the quadrant 1 (Q1) for CD4 and quadrant 3 (Q3) for CD8 were used to quantify cell number in each experimental group. No significant (ns, p > 0.05) changes in the ratio of CD4/CD8 were observed in thymus and spleen (C). A one-way ANOVA (n = 3 thymic or spleens per group, 20,000 events/sample) was used to determine significant differences from Ctrl (*p < 0.05).
Figure 6
Figure 6
Combined effects of CPZ-feeding and Cx with pertussis toxin (PT) on CD8+ T-cells in the CNS. Representative images of CD8+ T-cells detected in the CNS tissue (A) and quantification (B) of CD8+ T-cell numbers in the CNS (cerebrum, cerebellum, brainstem, and spinal cord). In Study 2, the number of CD8+ T cells was significantly (p < 0.05) higher in each part of the CNS in the Cx+0.1% CPZ+PT group than in all other groups. Section (C) shows representative images of double labeling with CD8 and IBA 1 antibodies in the brain tissue, nuclear DAPI staining, and merged images confirming the identity of CD8+ T-cells. As indicated by white arrows, regions of the images were magnified five times and these appear as insets at the bottom of the image panel; one-way ANOVA, n = 3 mice/group, 10 sections/brain or spinal cord, five sections/cerebellum or brainstem; *indicates significant difference from Ctrl (p < 0.05).
Figure 7
Figure 7
Detection of CD4/8 signals in the CNS homogenate. Representative images of western blot analysis of CD4 and CD8 antigen detection in the brain and spinal cord. No CD4 signal was detected in the CNS tissue across all groups in Studies 1–3. In contrast, the CD8 signal band was detected only in brains and spinal cords of Cx+0.1% CPZ+PT mice in Study 2 (red arrows). SDS-PAGE gels were loaded with 60 μg/well of total protein, all samples were processed in triplicate, and standard purified CD4 and CD8 protein concentrations were 5 ng/well and 5 μg/well, respectively.
Figure 8
Figure 8
Flow cytometric analysis of T-cell subpopulations (CD4 and CD8) in the brain and spinal cord of male mice. Representative CD8+ T-cells dot blots in the brain (A) and quantification (B) of CD4+ and CD8+ T-cell numbers in the brain and spinal cord. In Study 2, no significant (ns) changes in the number of CD4+ T-cell of the brain and spinal cord were observed, whereas the number of CD8+ T-cells was significantly (p < 0.05) increased only in the brains and spinal cord of the Cx+0.1% CPZ+PT group. Cell counts in quadrant 3 (Q3) for CD8 were used to quantify cell number in each experimental group. The ratio of CD4/CD8 in the brain and spinal cord was unchanged (ns) in all groups except in the Cx+0.1% CPZ+PT group in which the ratio was significantly decreased in both brain and spinal cord (C). A one-way ANOVA (n = 3 thymic or spleens per group, 20,000 events/sample) was used to determine significant differences from Ctrl (*p < 0.05).

References

    1. Ahlgren C., Odén A., Lycke J. (2011). High nationwide prevalence of multiple sclerosis in Sweden. Mult. Scler. 17, 901–908. 10.1177/1352458511403794 - DOI - PubMed
    1. Alt C., Laschinger M., Engelhardt B. (2002). Functional expression of the lymphoid chemokines CCL19 (ELC) and CCL 21 (SLC) at the blood-brain barrier suggests their involvement in G-protein-dependent lymphocyte recruitment into the central nervous system during experimental autoimmune encephalomyelitis. Eur. J. Immunol. 32, 2133–2144. 10.1002/1521-4141(200208)32:8<2133::aid-immu2133>3.0.co;2-w - DOI - PubMed
    1. Aspinall R., Andrew D. (2001). Gender-related differences in the rates of age associated thymic atrophy. Dev. Immunol. 8, 95–106. 10.1155/2001/17064 - DOI - PMC - PubMed
    1. Azar A., Rank M. A., Zarka M. A., Chang Y. H., Lal D. (2017). Gender-specific differences in serum immunoglobulin E levels and prevalence of fungus in sinonasal tissue noted in patients with chronic rhinosinusitis who underwent endoscopic sinus surgery. Am. J. Rhinol. Allergy 31, 370–375. 10.2500/ajra.2017.31.4471 - DOI - PubMed
    1. Babbe H., Roers A., Waisman A., Lassmann H., Goebels N., Hohlfeld R., et al. . (2000). Clonal expansions of CD8(+) T cells dominate the T cell infiltrate in active multiple sclerosis lesions as shown by micromanipulation and single cell polymerase chain reaction. J. Exp. Med. 192, 393–404. 10.1084/jem.192.3.393 - DOI - PMC - PubMed