. 2020 Mar 10:11:372.
doi: 10.3389/fimmu.2020.00372. eCollection 2020.

Pretreatment Innate Cell Populations and CD4 T Cells in Blood Are Associated With Response to Immune Checkpoint Blockade in Melanoma Patients

Affiliations

Pretreatment Innate Cell Populations and CD4 T Cells in Blood Are Associated With Response to Immune Checkpoint Blockade in Melanoma Patients

Mehdi R Pirozyan et al. Front Immunol. .

Abstract

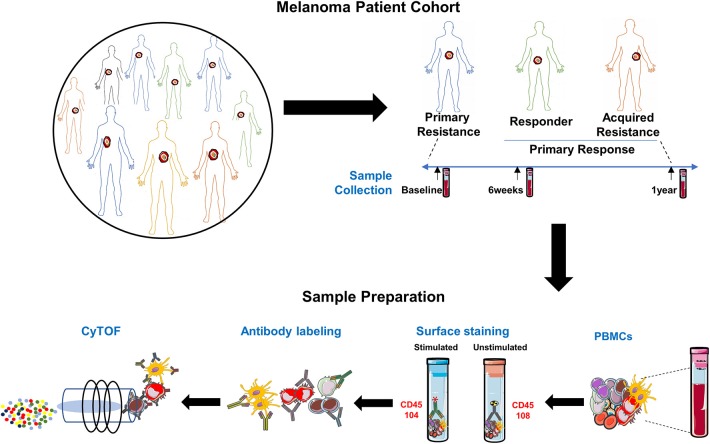
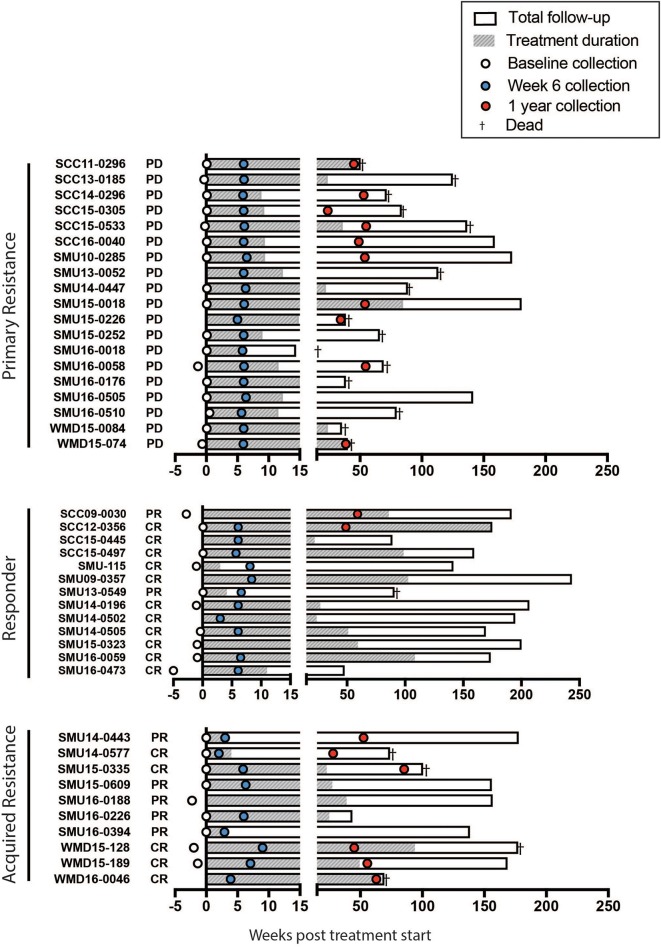
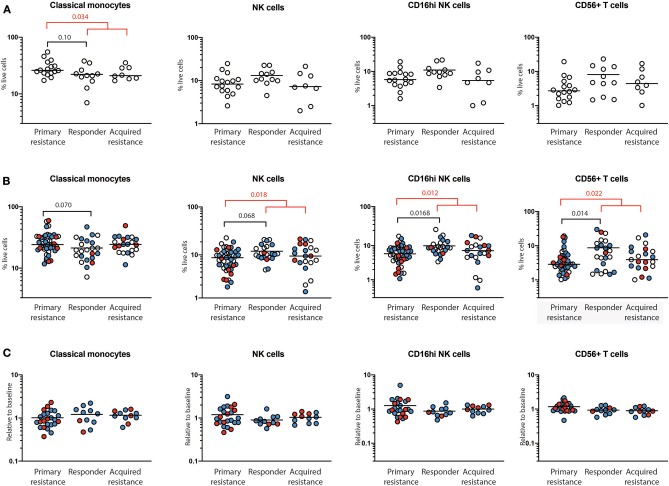
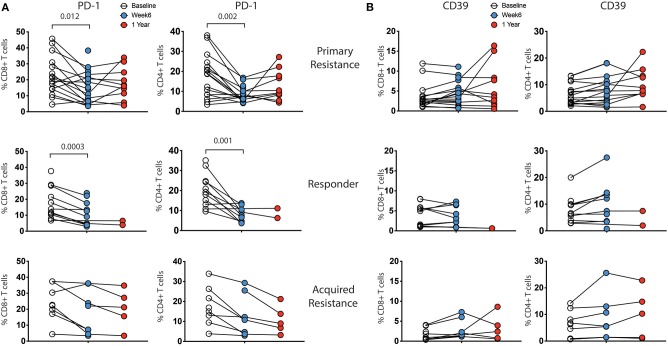
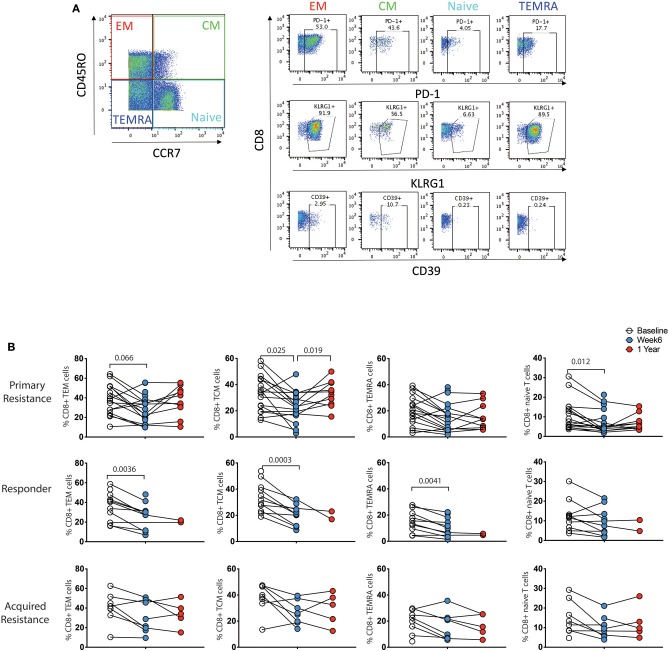
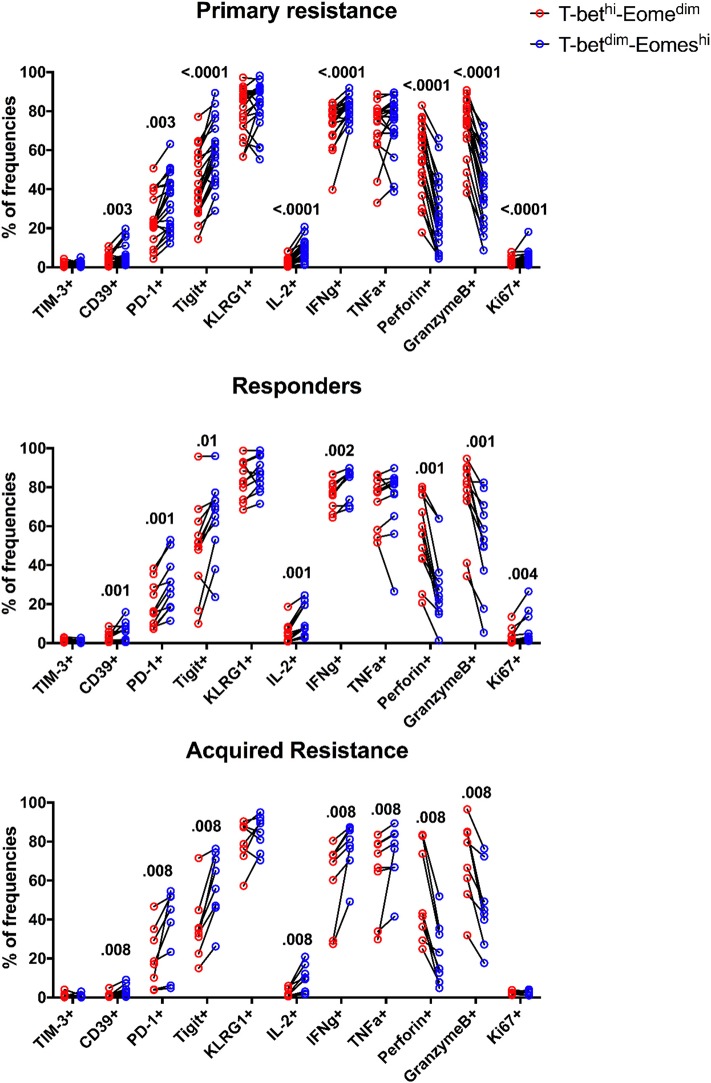
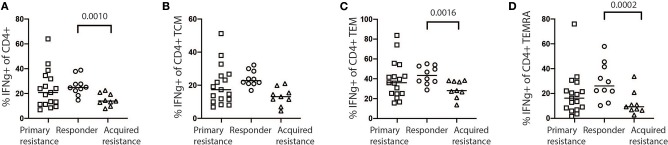
The development of changes in T cells, referred to as T cell exhaustion, has been suggested as a cause of primary or acquired resistance to immunotherapy by immune checkpoint blockade (ICB). A limited number of studies, largely performed on tumor infiltrating lymphocytes (TILs), has provided evidence in support of this hypothesis, but whether similar changes occur in circulating blood lymphocytes has received little attention. In the present study, a comprehensive analysis of peripheral blood leukocytes from 42 patients taken over the course of treatment with anti-PD-1 was undertaken. The patients included those grouped as responders (who did not progress), primary non-responders (primary resistance) and those with acquired resistance (who initially responded then subsequently progressed). Analysis included surface markers of exhaustion, production of cytokines following in vitro stimulation, and assessment of transcription factor levels associated with T cell exhaustion. There were differences in innate cell populations between responders and non-responders at baseline and maintained throughout therapy. Frequencies of total and classical CD14+CD16- monocytes were higher and the major subset of NK cells (CD16hiCD56+) was significantly smaller in the primary resistance group compared with responders. However, differences in peripheral blood expression of exhaustion markers were not evident between the treatment groups. T cell exhaustion markers were expressed in practically all patients and the major observation was an increase in CD39 on CD4 T cells during treatment. The results confirm the association of Eomes transcription factor with T cell exhaustion but levels of expression and the ratio with T-bet over Eomes did not differ between the patient groups. Thus, peripheral blood expression of T cell exhaustion markers does not distinguish between responders and non-responders to anti-PD-1 therapy. CD4 T cell expression of IFNγ also differed in pre-treatment samples, indicating that predictors of response unrelated to exhaustion may be present in peripheral blood. The association of response with innate cell populations and CD4 T cell responses requires further study.

Keywords: CD4 T cells; CyTOF; NK cells; T cell exhaustion; cancer immunotherapy; checkpoint inhibition; melanoma.


Figures

Figure 1
Figure 1
Experimental schema. Experimental setup for processing PBMCs from matched samples before and after anti-PD-1 immunotherapy. Samples (n = 97) comprised 36 from melanoma patients prior to beginning anti-PD-1 treatment [Primary Resistance (PR) = 17, Responders (R) = 10 and Acquired Resistance (AR) = 9]; 39 from 6 weeks post-treatment (PR = 19, R = 11, and AR = 9) and 18 from the 1 year time point (PR = 10, R = 2, and AR = 6). PMA/Ionomycin stimulated cells were stained with 104Pd metal tagged anti-CD45 antibody while unstimulated cells from the same sample were stained with 108Pd metal tagged anti-CD45 antibody. Barcoded samples were washed, pooled, and subsequently stained with a panel of 39 antibodies, each conjugated to a different metal isotope, and analyzed by mass cytometry. Cells were nebulized into single-cell droplets, and an elemental mass spectrum was acquired for each. The integrated elemental reporter signals for each cell were then analyzed using a supervised gating strategy (FlowJo). For some analyses, responder and acquired resistance groups were pooled into a primary responder group equivalent to the responder groups in published studies in which progression after 3 month RECIST assessment was not used to subdivide the responder group.
Figure 2
Figure 2
Swimmers plot illustrates treatment duration of patients treated with anti-PD-1 (filled bars), within the study follow up period (open bars) for primary resistance, responders, and acquired resistance groups. Death is illustrated with a cross. Blood samples were obtained at baseline (open circles, range 0-5 weeks before the start of therapy), week 6 (blue filled circles, range 2-9 weeks) and 1 year (red filled circles, range 35-85 weeks) post treatment. CR, complete response; PR, partial response; PD, progressive disease, as assessed using RECIST.
Figure 3
Figure 3
Quantification of immune cells populations using mass cytometry. PBMCs from primary resistance, responder and acquired resistance groups were analyzed for multiple T cell, B cell, NK cell, and myeloid populations, as illustrated in Supplementary Figures 2, 3. Only populations that differed between groups are shown. (A) Frequencies of baseline cell populations in each of the groups. Each individual sample is indicated by a circle, with the group mean shown as a bar. (B) Frequencies of cell populations from all timepoints in each of the groups. Baseline, open circles; week 6, blue filled circles; 1 year, red filled circles. (C) Changes in frequencies within individual subjects over time. Values at 6 weeks, expressed as a proportion of baseline values, are indicated by blue filled circles while values at year 1, expressed as a proportion of baseline values, are indicated by red filled circles. Differences in frequencies of immune cell populations between primary resistance, responder, and acquired resistance groups were assessed using ANOVA followed by Tukey's multiple comparisons test and p-values are shown in black. Differences between primary resistance and primary responder (i.e., pooled responder and acquired resistance) groups were assessed using an unpaired t-test and p-values are indicated in red. Where no p-values are indicated, the relevant tests indicated p > 0.05.
Figure 4
Figure 4
Expression levels of inhibitory receptors on CD4 and CD8 T cells by treatment outcome. PBMCs were analyzed for expression of CD39, PD-1, TIGIT, TIM-3, and KLRG1 on CD4 and CD8 T cells. There were no significant differences in expression between the groups at any timepoint. Expression of (A) PD-1 and (B) CD39 showed changes within individual subjects over the course of therapy, while TIM-3, TIGIT, and KLRG1 did not (not shown). Baseline, open circles; week 6, blue filled circles; 1 year, red filled circles. Differences in frequencies of immune cell populations between the 3 timepoints were assessed using a repeated measures mixed effects analysis followed by Tukey's multiple comparisons test and p-values are indicated.
Figure 5
Figure 5
Differential expression pattern of PD-1 within effector/memory compartments of CD8 T cells. (A) Gating strategy to distinguish effector memory (TEM), central memory (TCM), effector memory CD45RA (TEMRA), and naïve compartments. (B) Longitudinal analysis of PD-1 expression. Baseline, open circles; week 6, blue filled circles; 1 year, red filled circles. Differences in frequencies of immune cell populations between the 3 timepoints were assessed using a repeated measures mixed effects analysis followed by Tukey's multiple comparisons test and p-values are indicated.
Figure 6
Figure 6
Expression patterns of inhibitory receptors and cytokines on different subsets of CD8 T cells. The frequency of TIM-3, CD39, PD-1, TIGIT, KLRG1, IL-2, IFNγ, TNFα, Perforin, GranzymeB, and Ki-67 expressing cells within total T-betdimEomeshi (blue) and T-bethiEomesdim (red) CD8 T cells for all baseline samples. Statistical analysis was performed with a Wilcoxon matched-pairs single rank test.
Figure 7
Figure 7
Expression of IFNγ by stimulated baseline samples. (A) Comparison of primary resistance, responder, and acquired resistance groups revealed production by a significantly higher proportion of total CD4 T cells within the responder group, compared with the acquired resistance group, however not significant within the CD4 T cell CM compartments (B). The difference was also statistically significant within the CD4 T cell EM (C) and TEMRA (D) compartments. The statistical differences were analyzed using a Kruskall-Wallis multiple comparisons test.

References

    1. Hersey P, Kakavand H, Wilmott J, van der Westhuizen A, Gallagher S, Gowrishankar K, et al. . How anti-PD1 treatments are changing the management of melanoma. Melanoma Manag. (2014) 1:165-72. 10.2217/mmt.14.14 - DOI - PMC - PubMed
    1. Topalian SL, Drake CG, Pardoll DM. Immune checkpoint blockade: a common denominator approach to cancer therapy. Cancer Cell. (2015) 27:450–61. 10.1016/j.ccell.2015.03.001 - DOI - PMC - PubMed
    1. Robert C, Schachter J, Long GV, Arance A, Grob JJ, Mortier L, et al. . Pembrolizumab versus ipilimumab in advanced melanoma. N Engl J Med. (2015) 372:2521–32. 10.1056/NEJMoa1503093 - DOI - PubMed
    1. Ribas A, Hamid O, Daud A, Hodi FS, Wolchok JD, Kefford R, et al. . Association of pembrolizumab with tumor response and survival among patients with advanced melanoma. JAMA. (2016) 315:1600–9. 10.1001/jama.2016.4059 - DOI - PubMed
    1. Sharma P, Hu-Lieskovan S, Wargo JA, Ribas A. Primary, adaptive, and acquired resistance to cancer immunotherapy. Cell. (2017) 168:707–23. 10.1016/j.cell.2017.01.017 - DOI - PMC - PubMed

Publication types

MeSH terms