. 2020 Mar 4:11:182.
doi: 10.3389/fpls.2020.00182. eCollection 2020.

A New Remote Sensing-Based System for the Monitoring and Analysis of Growth and Gas Exchange Rates of Photosynthetic Microorganisms Under Simulated Non-Terrestrial Conditions

Affiliations

A New Remote Sensing-Based System for the Monitoring and Analysis of Growth and Gas Exchange Rates of Photosynthetic Microorganisms Under Simulated Non-Terrestrial Conditions

Mariano Battistuzzi et al. Front Plant Sci. .

Abstract

Oxygenic photosynthetic microorganisms are a focal point of research in the context of human space exploration. As part of the bioregenerative life-support systems, they could have a key role in the production of breathable O2, edible biomasses and in the regeneration of CO2 rich-atmospheres and wastewaters produced by astronauts. The test of the organism's response to simulated physico-chemical parameters of planetary bodies could also provide important information about their habitability potential. It is believed that the success of future planetary and space missions will require innovative technologies, developed on the base of preliminary experiments in custom-made laboratory facilities. In this context, simulation chambers will play a pivotal role by allowing the growth of the microorganisms under controlled conditions and the evaluation in real-time of their biomass productivity and impact on atmosphere composition. We here present a system capable of addressing these requirements with high replicability and low costs. The setup is composed by three main parts: 1) a Star Light Simulator, able to generate different light intensities and spectra, including those of non-solar stars; 2) an Atmosphere Simulator Chamber where cultures of photosynthetic microorganisms can be exposed to different gas compositions; 3) a reflectivity detection system to measure from remote the Normalized Difference Vegetation Indexes (NDVI). Such a setup allows us to monitor photosynthetic microorganism's growth and gas exchange performances under selected conditions of light quality and intensity, temperature, pressure, and atmospheres simulating non-terrestrial environments. All parameters are detected by remote sensing techniques, thus without interfering with the experiments and altering the environmental conditions set. We validated the setup by growing cyanobacteria liquid cultures under different light intensities of solar illumination, collecting data on their growth rate, photosynthetic activity, and gas exchange capacity. We utilized the reflectivity detection system to measure the reflection spectra of the growing cultures, obtaining their relative NDVI that was shown to correlate with optical density, chlorophyll content, and dry weight, demonstrating the potential application of this index as a proxy of growth.

Keywords: Normalized Difference Vegetation Indexes; cyanobacteria; photosynthesis; reflectance spectra; remote sensing; simulation chamber.


Figures

Figure 1
Figure 1
Rendering of the experimental setup in the “growth” configuration (A) and during the reflectance measurement (B). The optical fiber is mounted inside the baffling system (a). The light coming from the Star Light Simulator is collimated through the baffling system (b), in a way that leaves only a little portion of the culture exposed to the light (c).
Figure 2
Figure 2
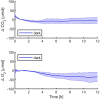
Synechocystis sp. PCC6803 carbon dioxide consumption and oxygen production over 12 h in the dark, with a starting atmospheric composition of air + 5%CO2. T0 was set at 3,600 s to exclude the initial gas equilibration period inside the chamber. Bold lines represent the average of three different biological replicates, with standard deviations reported as transparent areas.
Figure 3
Figure 3
Synechocystis sp. PCC6803 carbon dioxide consumption (A) and oxygen production (B) over 24 h under three different light intensities, with a starting atmospheric composition of air + 5%CO2. T0 was set at 3,600 s to exclude the initial gas equilibration period inside the chamber. For each light intensity, the bold line represents the average of three different biological replicates, with standard deviations reported as transparent areas.
Figure 4
Figure 4
Synechocystis sp. PCC6803 carbon dioxide consumption rates per hour (A) and oxygen production rates per hour (B) under the three light intensities of the 24 h experiments reported in Figure 3 . Data were obtained by calculating the second derivative of the curves in Figure 3 over time. In the figure, it is reported the linear fitting for each light intensity.
Figure 5
Figure 5
Synechocystis sp. PCC6803 carbon dioxide consumption (A) and oxygen production (B) over 24 h under 95 µmol of photons m−2s−1 of light intensity at two different optical densities, with a starting atmospheric composition of air + 5%CO2. T0 was set at 3,600 s to exclude the initial gas equilibration period inside the chamber. For each optical density, the bold line represents the average of three different replicates, with standard deviations reported as transparent areas.
Figure 6
Figure 6
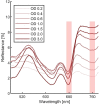
Synechocystis sp. PCC6803 reflectance spectra at different optical densities. Each measurement was averaged 10 times. Spectra were corrected for hot and dark pixels. Red shadowed rectangles represent were the Normalized Difference Vegetation Indexes (NDVI) can be calculated.
Figure 7
Figure 7
Reflectivity detection system (RDS) validation graphs. The NDVI was correlated with chlorophyll a content (µg/ml), dry weight (g/L), and optical density (OD), in (A–C), respectively. Validation experiments were performed with Synechocystis sp. PCC6803 for 24 or 48 h, at light intensities of 30, 45, and 95 µmol of photons m−2s−1, with a starting atmospheric composition of air + 5%CO2. Black: 48 h at 30 µmol of photons m−2s−1; Red: 48 h experiment, combining 24 h at 30 µmol of photons m−2s−1 followed by 24 h at 45 µmol of photons m−2s−1; green: 48 h experiment, combining 24 h at 30 µmol of photons m−2s−1 followed by 95 µmol of photons m−2s−1; blue: 24 h experiment at 45 µmol of photons m−2s−1; cyan: 24 h experiment at 95 µmol of photons m−2s−1. For each type of experiment, three biological replicates were obtained. In experiments marked in black, red, and green, at 24 h the ASC was opened to collect a sample for the optical density (OD) measurement, then the atmosphere simulator chamber (ASC) was sealed again, and an atmosphere of air + 5%CO2 was re-filled inside the chamber.
Figure 8
Figure 8
Example of Synechocystis sp. PCC6803 growth experiment monitored with the NDVI methodology (A), and with the CO2 and O2 sensors (B). The experiment was carried on for 48 h, the first 24 h at 30 µmol of photons m−2s−1, then at 95 µmol of photons m−2s−1 of light intensity, with a starting atmospheric composition of air + 5% CO2. At 24 h the atmosphere simulator chamber (ASC) was opened to collect a sample for the OD measurement, then the ASC was sealed again, and an atmosphere of air + 5%CO2 was re-filled inside the chamber. In (A) it is shown the growth over time of the OD (red dots) and the NDVI (black dots). In (B) it is shown the consumption of CO2 (upper box) and the production of O2 over time (lower box); in red are shown the first 24 h of the experiment at a light intensity of 30 µmol of photons m−2s−1, in blue the second 24 h, at 95 µmol of photons m−2s−1. T0 was set at 3,600 s to exclude the initial gas equilibration period inside the chamber. For each box, the bold lines represent the average of three different biological replicates, with standard deviations reported as transparent areas.
Figure 9
Figure 9
Reflectance spectra of different cyanobacteria and microalgae acquired with the RDS. Each measurement was averaged 10 times. Spectra were corrected for hot and dark pixels. Red shadowed rectangles represent were the Normalized Difference Vegetation Indexes (NDVI) are calculated. Green: Synechococcus sp. PCC7335; cyan: Synechocystis sp. PCC6803; Bordeaux: Chlorogloeopsis fritschii PCC6912; orange: Chroococcidiopsis thermalis PCC7203; blue: Arthrospira platensis SAG85/79; yellow: Nannochloropsis gaditana CCAP849/5; purple: Chlorella vulgaris CCAP221/11B.

References

    1. Allakhverdiev S. I., Kreslavski V. D., Thavasi V., Zharmukhamedov S. K., Klimov V. V., Nagata T., et al. (2009). Hydrogen photoproduction by use of photosynthetic organisms and biomimetic systems. Photochem. Photobiol. Sci. 8, 148–156. 10.1039/b814932a - DOI - PubMed
    1. Anglada-Escudé G., Amado P. J., Barnes J., Berdiñas Z. M., Butler R. P., Coleman G. A. L., et al. (2016). A terrestrial planet candidate in a temperate orbit around Proxima Centauri. Nature 536, 437–440. 10.1038/nature19106 - DOI - PubMed
    1. Billi D., Baqué M., Smith H. D., McKay C. P. (2013). Cyanobacteria from extreme deserts to space. Adv. Microbiol. 03, 80–86. 10.4236/aim.2013.36a010 - DOI
    1. Bugbee B., Spanarkel B., Johnson S., Monje O., Koerner G. (1994). CO2 crop growth enhancement and toxicity in wheat and rice. Adv. Sp. Res. 14, 257–267. 10.1016/0273-1177(94)90306-9 - DOI - PubMed
    1. Claudi R., Erculiani M. S., Galletta G., Billi D., Pace E., Schierano D., et al. (2015). Simulating super earth atmospheres in the laboratory. Int. J. Astrobiol. 15, 35–44. 10.1017/S1473550415000117 - DOI