

Composite Measure of Physiological Dysregulation as a Predictor of Mortality: The Long Life Family Study
- PMID: 32211364
- PMCID: PMC7067825
- DOI: 10.3389/fpubh.2020.00056
Composite Measure of Physiological Dysregulation as a Predictor of Mortality: The Long Life Family Study
Abstract
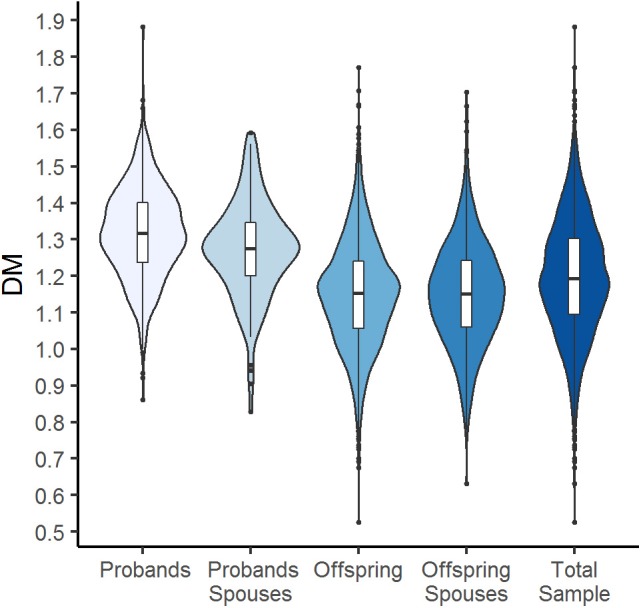
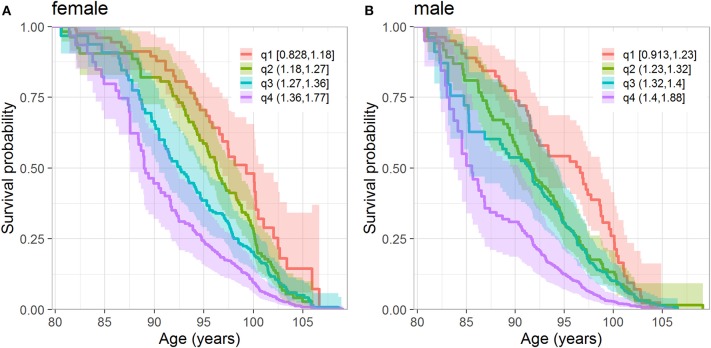
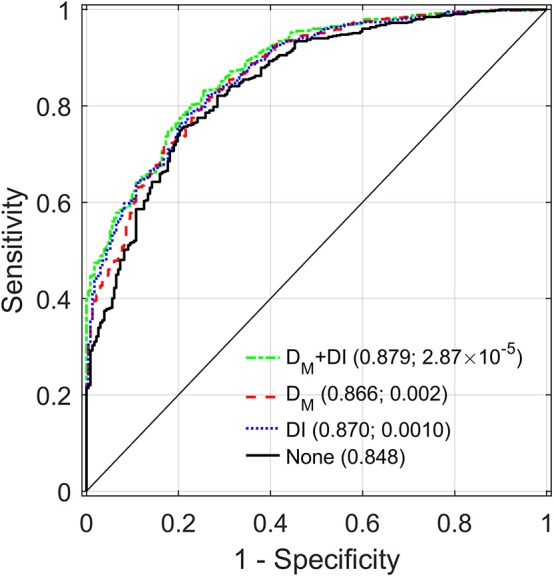
Biological aging results in changes in an organism that accumulate over age in a complex fashion across different regulatory systems, and their cumulative effect manifests in increased physiological dysregulation (PD) and declining robustness and resilience that increase risks of health disorders and death. Several composite measures involving multiple biomarkers that capture complex effects of aging have been proposed. We applied one such approach, the Mahalanobis distance (DM), to baseline measurements of various biomarkers (inflammation, hematological, diabetes-associated, lipids, endocrine, renal) in 3,279 participants from the Long Life Family Study (LLFS) with complete biomarker data. We used DM to estimate the level of PD by summarizing information about multiple deviations of biomarkers from specified "norms" in the reference population (here, LLFS participants younger than 60 years at baseline). An increase in DM was associated with significantly higher mortality risk (hazard ratio per standard deviation of DM: 1.42; 95% confidence interval: [1.3, 1.54]), even after adjustment for a composite measure summarizing 85 health-related deficits (disabilities, diseases, less severe symptoms), age, and other covariates. Such composite measures significantly improved mortality predictions especially in the subsample of participants from families enriched for exceptional longevity (the areas under the receiver operating characteristic curves are 0.88 vs. 0.85, in models with and without the composite measures, p = 2.9 × 10⁻⁵). Sensitivity analyses confirmed that our conclusions are not sensitive to different aspects of computational procedures. Our findings provide the first evidence of association of PD with mortality and its predictive performance in a unique sample selected for exceptional familial longevity.
Keywords: Long Life Family Study; aging; deficits index; mortality; physiological dysregulation; prediction; statistical distance.
Copyright © 2020 Arbeev, Bagley, Ukraintseva, Duan, Kulminski, Stallard, Wu, Christensen, Feitosa, Thyagarajan, Zmuda and Yashin.
Figures
Similar articles
-
Genetics of physiological dysregulation: findings from the long life family study using joint models.Aging (Albany NY). 2020 Apr 1;12(7):5920-5947. doi: 10.18632/aging.102987. Epub 2020 Apr 1. Aging (Albany NY). 2020. PMID: 32235003 Free PMC article.
-
A Random Forest-Induced Distance-Based Measure of Physiologic al Dysregulation.Curr Aging Sci. 2017;10(4):270-281. doi: 10.2174/1874609810666170117155756. Curr Aging Sci. 2017. PMID: 28103780
-
"Physiological Dysregulation" as a Promising Measure of Robustness and Resilience in Studies of Aging and a New Indicator of Preclinical Disease.J Gerontol A Biol Sci Med Sci. 2019 Mar 14;74(4):462-468. doi: 10.1093/gerona/gly136. J Gerontol A Biol Sci Med Sci. 2019. PMID: 29939206 Free PMC article.
-
Lipids: biomarkers of healthy aging.Biogerontology. 2021 Jun;22(3):273-295. doi: 10.1007/s10522-021-09921-2. Epub 2021 Apr 10. Biogerontology. 2021. PMID: 33837874 Review.
-
DNA Methylation as a Biomarker of Aging in Epidemiologic Studies.Methods Mol Biol. 2018;1856:219-231. doi: 10.1007/978-1-4939-8751-1_12. Methods Mol Biol. 2018. PMID: 30178254 Review.
Cited by
-
Development and Validation of 2 Composite Aging Measures Using Routine Clinical Biomarkers in the Chinese Population: Analyses From 2 Prospective Cohort Studies.J Gerontol A Biol Sci Med Sci. 2021 Aug 13;76(9):1627-1632. doi: 10.1093/gerona/glaa238. J Gerontol A Biol Sci Med Sci. 2021. PMID: 32946548 Free PMC article.
-
An objective metric of individual health and aging for population surveys.Popul Health Metr. 2022 Mar 31;20(1):11. doi: 10.1186/s12963-022-00289-0. Popul Health Metr. 2022. PMID: 35361249 Free PMC article.
-
Composite Measures of Physical Fitness to Discriminate Between Healthy Aging and Heart Failure: The COmPLETE Study.Front Physiol. 2020 Dec 15;11:596240. doi: 10.3389/fphys.2020.596240. eCollection 2020. Front Physiol. 2020. PMID: 33384610 Free PMC article.
-
Decline in biological resilience as key manifestation of aging: Potential mechanisms and role in health and longevity.Mech Ageing Dev. 2021 Mar;194:111418. doi: 10.1016/j.mad.2020.111418. Epub 2020 Dec 16. Mech Ageing Dev. 2021. PMID: 33340523 Free PMC article. Review.
References
Publication types
MeSH terms
Substances
Grants and funding
LinkOut - more resources
Full Text Sources
Medical
Molecular Biology Databases