. 2019 Mar-Jun;7(1-2):12-39.
doi: 10.1142/s233954781950002x. Epub 2019 Apr 26.

A protein interaction free energy model based on amino acid residue contributions: Assessment of point mutation stability of T4 lysozyme

Affiliations

A protein interaction free energy model based on amino acid residue contributions: Assessment of point mutation stability of T4 lysozyme

Lawrence J Williams et al. Technology (Singap World Sci). 2019 Mar-Jun.

Abstract

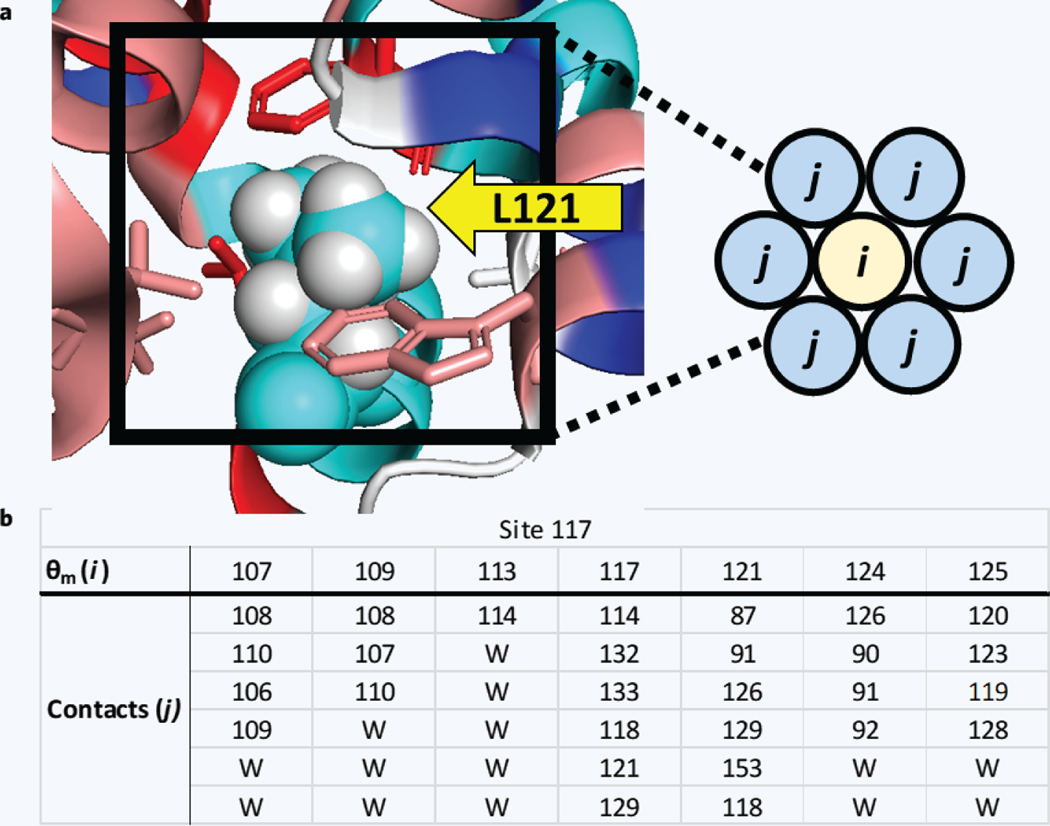
Here we present a model to estimate the interaction free energy contribution of each amino acid residue of a given protein. Protein interaction energy is described in terms of per-residue interaction factors, μ. Multibody interactions are implicitly captured in μ through the combination of amino acid terms (γ) guided by local conformation indices (σ). The model enables construction of an interaction factor heat map for a protein in a given fold, allows prima facie assessment of the degree of residue-residue interaction, and facilitates a qualitative and quantitative evaluation of protein association properties. The model was used to compute thermal stability of T4 bacteriophage lysozyme mutants across seven sites. Qualitative assessment of mutational effects provides a straightforward rationale regarding whether a particular site primarily perturbs native or non-native states, or both. The presented model was found to be in good agreement with experimental mutational data (R 2 = 0.73) and suggests an approach by which to convert structure space into energy space.

Keywords: Coarse-Grain Protein Model; Peptide Engineering; Protein Engineering; Protein Interaction Free Energy; Protein Thermal Stability.


Figures

Figure 1
Figure 1
Toward a reduced complexity description of proteins. (a) Lysozyme of T4 bacteriophage (T4L, PDB ID: 3fa0). (b) Scale invariant fractional values for the 20 canonical amino acids and with the standard deviation (sdev) determined from the power law: αrN−γ (see Moret and Zebende, text, and Appendix). (c) Mutations are classified on the basis of whether the impact of mutation is expected to be primarily on the native state ensemble (NSE) — Mutation class I (MC-I) or on the non-native state ensemble (non-NSE) or on both the NSE and the non-NSE — Mutation class II (MC-II).
Figure 2
Figure 2
σ-Index classification of local protein conformation. Amino acid side chains are coarsened as blobs (circles). The degree of separation between a residue (blue-filled black circle) and the closest-linked nearest neighbor (CLNN, blue-filled orange circle) defines σ. Simplified schematic of each closest-linked nearest neighbor index is shown for σ = 1, 2, 3, and 4 (two views).
Figure 3
Figure 3
Computed μ-values of T4L. Per-residue values calculated according to Eq. 1 (blue lines in plot provided for clarity only). Color gradient (right) used to generate heat maps in Fig. 4, where red corresponds to the highest values (hot) and blue to the lowest (cold). Most of the hottest 31 residues make contiguous contacts and 21 aggregate in three clusters. Two of the largest are indicated (dotted lines). The first cluster (green) includes six of the hottest residues in the N-terminal domain. The second (black) includes 11 residues and is located in the C-terminal domain. The values and specific residue color used to determine the per-residue contributions and for visualization are given in Supplementary Table 4.
Figure 4
Figure 4
Heat maps of T4 lysozyme. (a) The protein interior is predominantly hot (red and salmon interstitial lines) and the exterior predominantly cold (blue and cyan surface lines). Residues M102 (left) and L33 (right) are shown in space filling mode for reference (both residues are hot; hydrogen atoms are shown light grey for clarity). As indicated in Fig. 3, red/salmon correspond to high μ-factors, whereas white indicates midrange values and cyan/blue indicate low range values. (b) The patch of hot surface residues corresponds to the substrate binding region (box). (c) The C-terminal core region (box) is dominated by hot residues; M102 is in contact with many hot core residues. (d) The N-terminal core region (box), though smaller, is also dominated by hot residues; L33 is in contact with many hot core residues. (e) Approximately 25% of the canonical hydrophilic residues are hot, including the key catalytic residue E11. (f) Approximately 25% of the canonical hydrophobic residues are cool, including L121, which is buried and makes many contacts with hot residues of the C-terminal core. Mutations that increase the μ-factor for L121 (e.g., S117V, as explained later in the text) would be expected to significantly increase the stability of the C-terminal core and increase the protein stability
Figure 5
Figure 5
Mutation impacts the contribution to interaction free energy of multiple residues. (a) Mutation of S117 (spheres) changes the μ-factors calculated for θm-related residues (sticks). Because serine has a low intrinsic value (γ, Fig. 1b), mutation to most other residues will increase these μ-factors. This set includes hot and cold residues that make many contacts with the hot residues of the C-terminal core and will therefore significantly stabilize the protein upon mutation of S in most cases. (b) Mutation of M102 (spheres) in most cases will decrease the μ-factors of the θm-related residues (sticks). This set of residues, which are hot core residues, will therefore cool down and significantly destabilize the protein.
Figure 6
Figure 6
Comparison of computed and experimental ΔΔG of T4L mutants. Differences in thermal stability of well-characterized single point mutants were compared to experimentally determined values (Ref. Baase et al.). The calculation is remarkably accurate, considering the only input is sequence and a list of side chain-side chain nearest neighbors. R2 = 0.73 (line); y-intercept = 0.44, average uncertainty in the sums and products of μ < 0.01 kcal/mol; average uncertainty attributable to estimated sidechain and backbone entropy <0.7 kcal/mol (Ref. Baxa et al.); average unassigned error (AUE) = 0.81 kcal/mol (white band); fit with (Eq. 3), ε = τ = 1, λ = 12.5 kcal/mol.
Figure 7
Figure 7
Contacts (i,j pairs) for members of the θm set of residue 117. (a) Interaction energy of each residue is determined by summing the interaction factor products of each residue (i) with its nearest neighbors (j, set to a maximum of 6). (b) The impact of a single point mutation requires evaluating all the contacts for each residue of θm. Mutation of site 117 is illustrated, and members (i residues) are listed in the top row and neighbors (j residues) are listed in the corresponding columns. Columns with less than six neighbors indicate solvent exposed residues.

References

    1. Bowman GR, Voelz VA & Pande VS Taming the complexity of protein folding. Curr. Opin. Struct. Biol. 21, 4–11 (2011). doi:10.1016/j.sbi.2010.10.006. - DOI - PMC - PubMed
    1. Brenner S Life’s code script. Nature 482, 461 (2012). doi:10.1038/482461a. - DOI - PubMed
    1. Carlson R Estimating the biotech sector’s contribution to the US economy. Nature Biotechnol. 34, 247 (2016). - PubMed
    1. Burley SK et al. In Protein Crystallography: Methods and Protocols. (eds.) Wlodawer A, Dauter Z & Jaskolski M. (Springer, New York, pp. 627–641, 2017).
    1. Baldwin RL Energetics of protein folding. J. Mol. Biol. 371, 283–301 (2007). doi:10.1016/j.jmb.2007.05.078. - DOI - PubMed

LinkOut - more resources