. 2020 Jan 27:4:13.
doi: 10.12688/gatesopenres.13107.1. eCollection 2020.

A grid-based sample design framework for household surveys

Affiliations

A grid-based sample design framework for household surveys

Gianluca Boo et al. Gates Open Res. .

Abstract

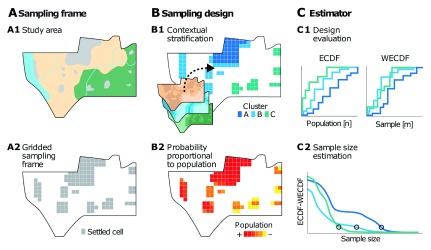
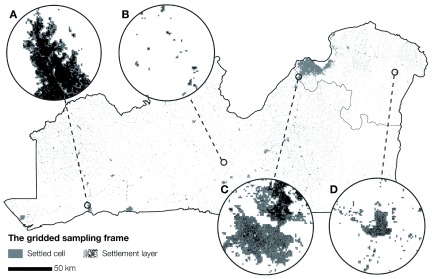
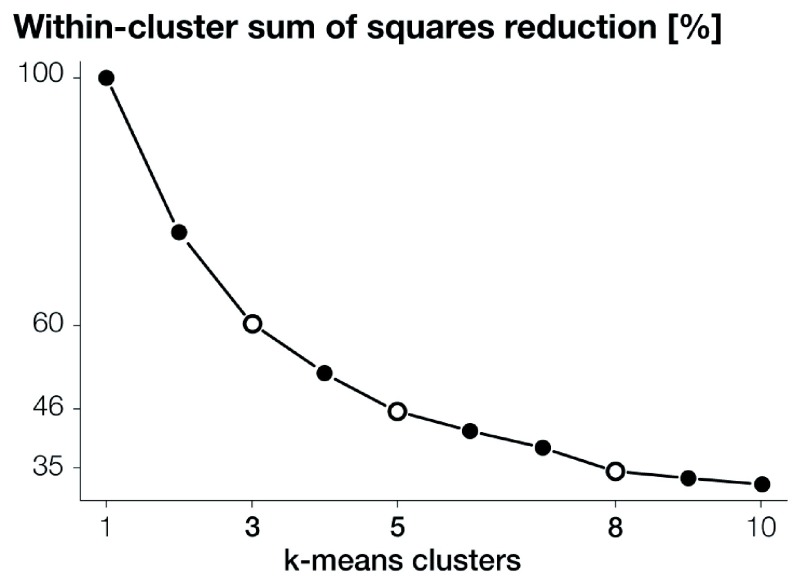
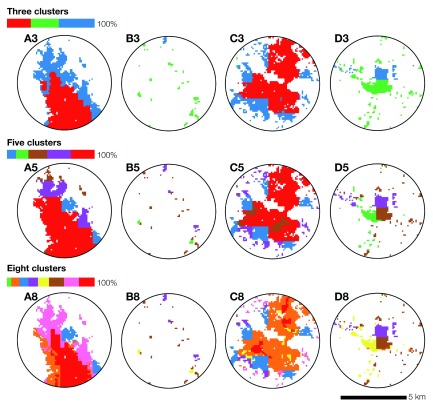
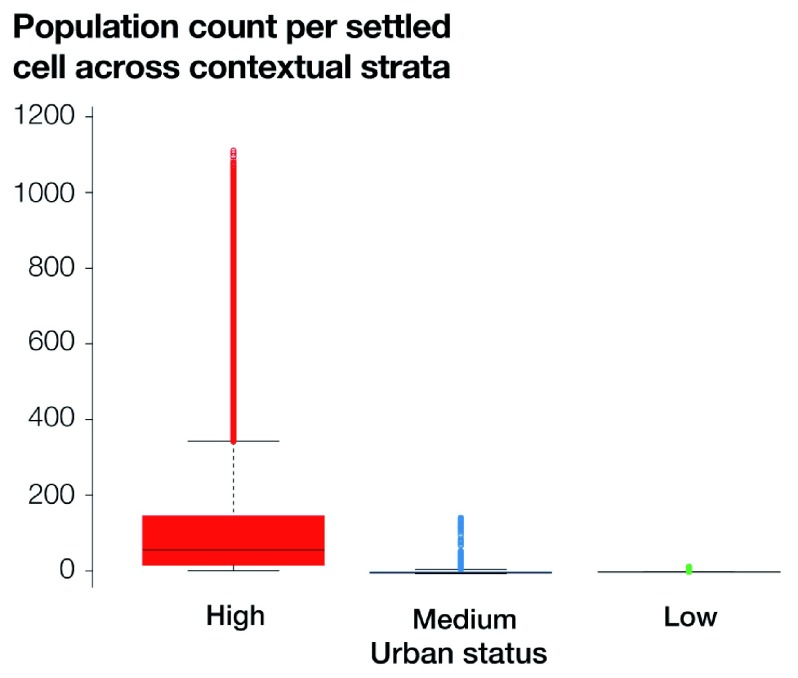
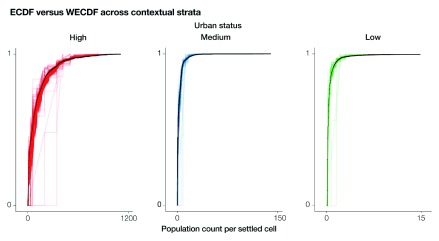
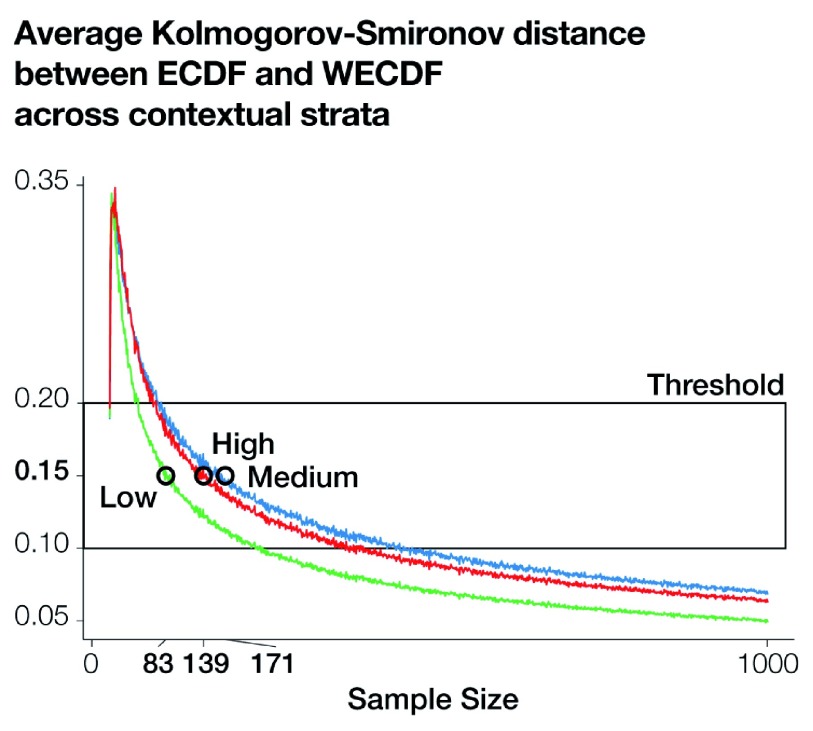
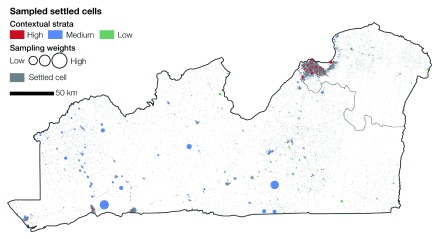
Traditional sample designs for household surveys are contingent upon the availability of a representative primary sampling frame. This is defined using enumeration units and population counts retrieved from decennial national censuses that can become rapidly inaccurate in highly dynamic demographic settings. To tackle the need for representative sampling frames, we propose an original grid-based sample design framework introducing essential concepts of spatial sampling in household surveys. In this framework, the sampling frame is defined based on gridded population estimates and formalized as a bi-dimensional random field, characterized by spatial trends, spatial autocorrelation, and stratification. The sampling design reflects the characteristics of the random field by combining contextual stratification and proportional to population size sampling. A nonparametric estimator is applied to evaluate the sampling design and inform sample size estimation. We demonstrate an application of the proposed framework through a case study developed in two provinces located in the western part of the Democratic Republic of the Congo. We define a sampling frame consisting of settled cells with associated population estimates. We then perform a contextual stratification by applying a principal component analysis (PCA) and k-means clustering to a set of gridded geospatial covariates, and sample settled cells proportionally to population size. Lastly, we evaluate the sampling design by contrasting the empirical cumulative distribution function for the entire population of interest and its weighted counterpart across different sample sizes and identify an adequate sample size using the Kolmogorov-Smirnov distance between the two functions. The results of the case study underscore the strengths and limitations of the proposed grid-based sample design framework and foster further research into the application of spatial sampling concepts in household surveys.

Keywords: Democratic Republic of the Congo; Demography; Gridded Population; Household Surveys; Sample Design; Spatial Sampling.


Conflict of interest statement

No competing interests were disclosed.

Figures

Figure 1.
Figure 1.. The grid-based sample design framework.
The key elements of this framework are the sampling frame ( A) defined by deriving from the study area ( A1) the gridded sampling frame ( A2); the sampling design ( B) consisting of contextual stratification ( B1) and sampling proportional to population size ( B2); and the estimator ( C) where the empirical cumulative distribution function and the weighted empirical cumulative distribution function are used to evaluate the design ( C1) and estimate sample size ( C2).
Figure 2.
Figure 2.. The study area comprising the Kongo-Central and Kinshasa provinces.
Cities and towns develop mostly across the Congo river basin, while smaller towns can be found in the sparsely-populated plateau at the North-West and South-East of the study area. At elevated locations, the vegetation is prominent with the rain forest at the North-West and the savannah at the South-East.
Figure 3.
Figure 3.. The settled cells constituting the gridded sampling frame.
The gaps between settlement layer and the settled cells tend to vary considerably across the urban area of Boma (A), the suburban areas at the outskirts of Kinshasa (C), the town of Mbankana (D), and the rural area north of the town of Kimpese (B).
Figure 4.
Figure 4.. Within-cluster sum of squares reduction for k-means clusters spanning between one and ten.
Three, five, and eight clusters are the best scenarios, according to the “elbow” method, for capturing the variance in the nine principal components derived from the gridded data attributes.
Figure 5.
Figure 5.. The spatial distribution of three, five and eight clusters for selected locations.
The legends show the ratio of settled cells allocated to the different clusters. Overall, the spatial patterns resulting from the three scenarios produce comparable outputs, with a clear distinction between the urban (Boma — A) and suburban (outskirts of Kinshasa — C) areas versus the town (Mbankana — D) and rural area (North of Kimpese — B).
Figure 6.
Figure 6.. Distribution of population counts per sampling-frame cell across the contextual strata defined based on the three clusters scenario.
The large horizontal black lines show the median, the boxes the interquartile range, the whiskers the minimum and maximum, and the dots the outliers.
Figure 7.
Figure 7.. Empirical cumulative distribution function (ECDF) and weighted ECDF (WECDF).
The ECDFs are depicted as black lines and the ECDFs as coloured lines. Sample sizes for the ECDFs span between 1 and 1000. The settled cells are selected using proportional to population size sampling for each contextual stratum (high, medium, and low urban status), independently.
Figure 8.
Figure 8.. Average Kolmogorov-Smirnov distance for each contextual stratum.
For sample sizes spanning between 1 and 1000, 1000 repetitions have been carried out and then averaged to produce a more robust assessment. The box highlights sample sizes resulting in reasonable distance metrics. The circles show the sample sizes resulting in a distance of 0.15.
Figure 9.
Figure 9.. Sampled settled cells across the different contextual strata.
The resulting sampling weights vary considerably across strata. Higher weights can be observed in areas of lower population counts per settled cell within the medium urban status stratum, while lower weights can be found in the sparsely populated low urban status stratum.

Similar articles

Cited by

References

    1. Robey B: Two hundred years and counting: the 1990 census. Popul Bull. 1989;44(1):3–43. - PubMed
    1. Corsi DJ, Neuman M, Finlay JE, et al. : Demographic and health surveys: a profile. Int J Epidemiol. 2012;41(6):1602–1613. 10.1093/ije/dys184 - DOI - PubMed
    1. Wright T: Sampling and Census 2000: The Concepts. Am Sci. 1998;86(3):245 Reference Source
    1. Delmelle EM: Spatial Sampling.In Handbook of Regional Science; Fischer, M.M., Nijkamp, P., Eds.; Springer Berlin Heidelberg: Berlin, Heidelberg,2014;1385–1399. 10.1007/978-3-642-23430-9_73 - DOI
    1. Thomson DR, Stevens FR, Ruktanonchai NW, et al. : GridSample: an R package to generate household survey primary sampling units (PSUs) from gridded population data. Int J Health Geogr. 2017;16(1):25. 10.1186/s12942-017-0098-4 - DOI - PMC - PubMed

LinkOut - more resources