. 2020 Oct 1;37(10):2808-2824.
doi: 10.1093/molbev/msaa082.

The Drosophila Y Chromosome Affects Heterochromatin Integrity Genome-Wide

Affiliations

The Drosophila Y Chromosome Affects Heterochromatin Integrity Genome-Wide

Emily J Brown et al. Mol Biol Evol. .

Abstract

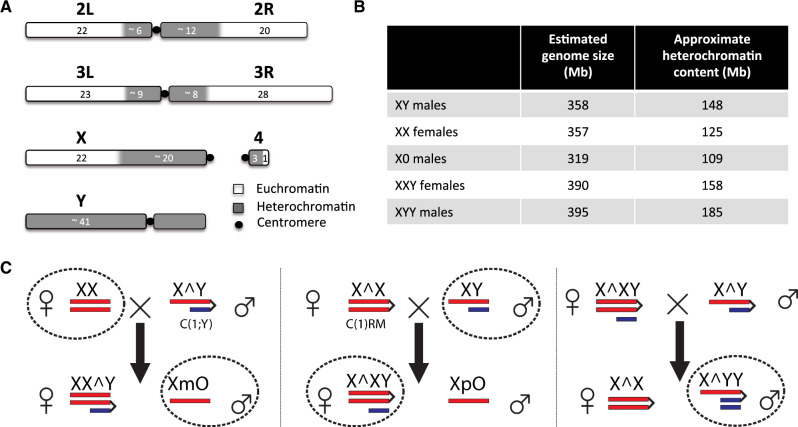
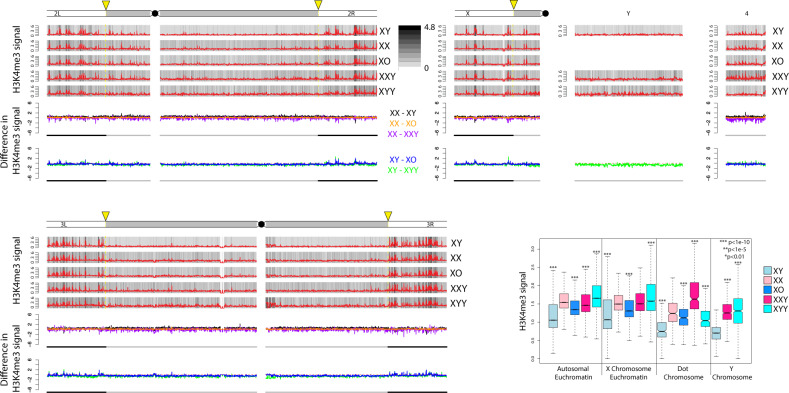
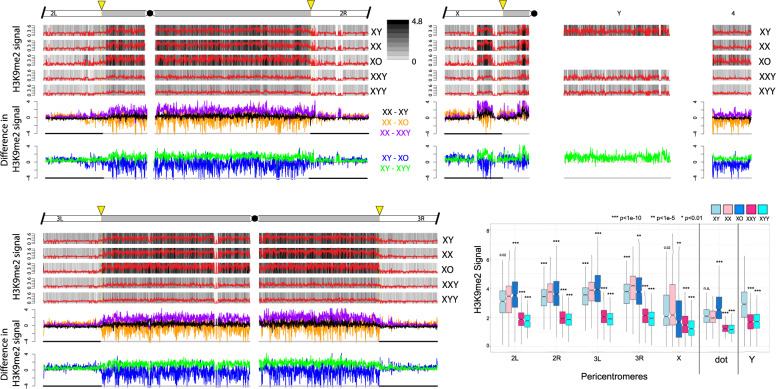
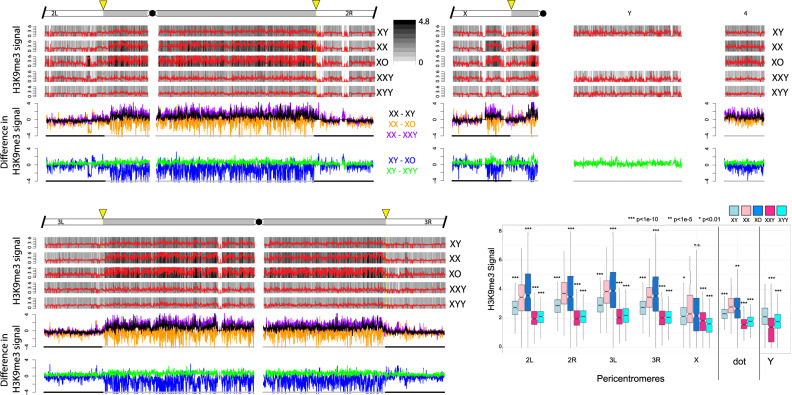
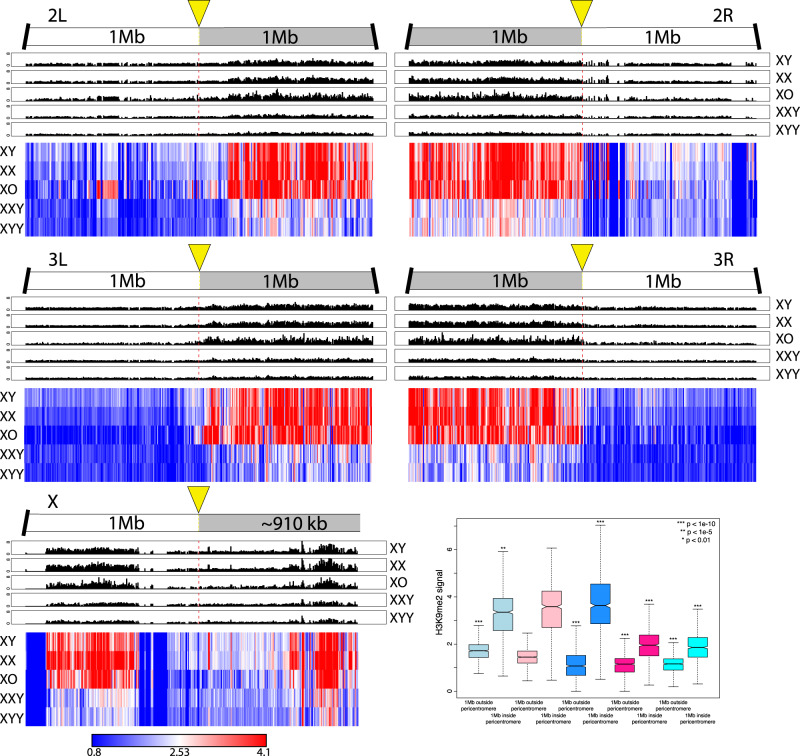
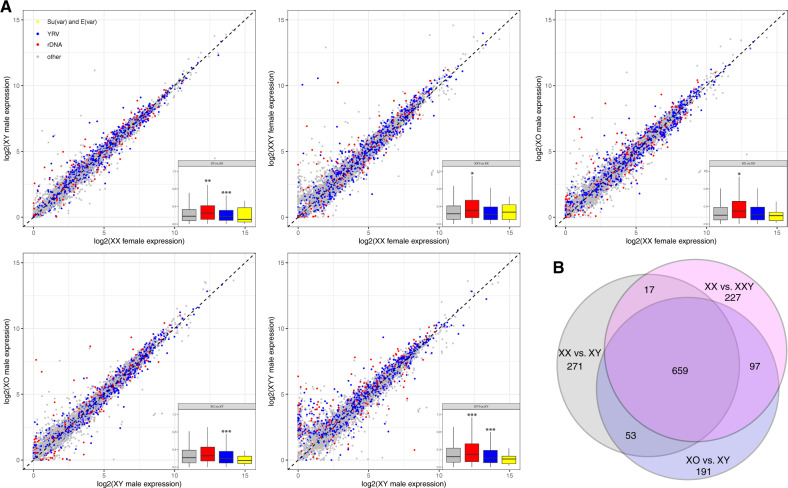
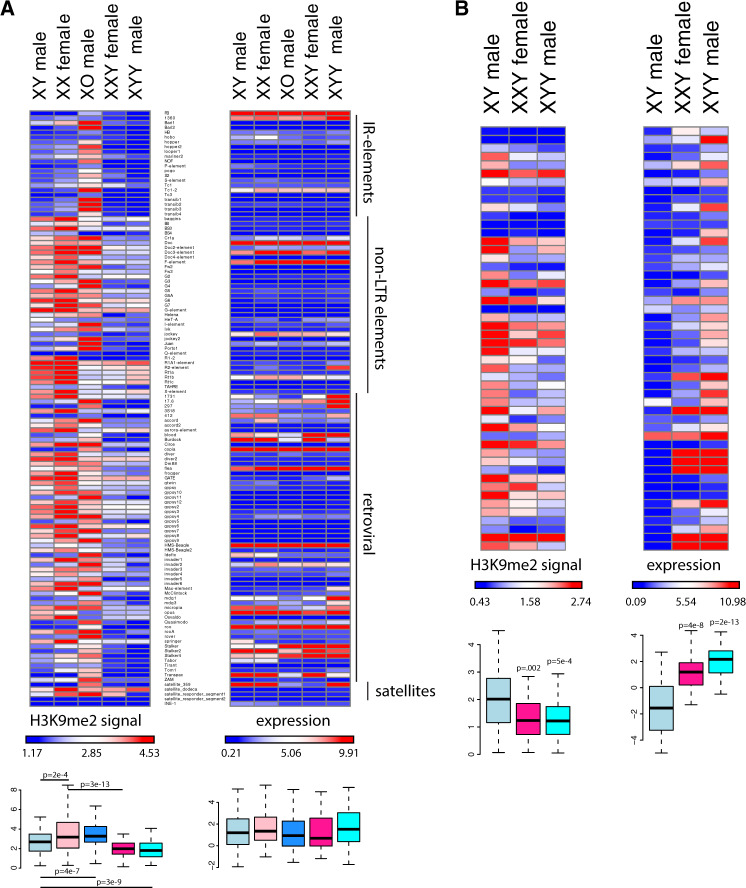
The Drosophila Y chromosome is gene poor and mainly consists of silenced, repetitive DNA. Nonetheless, the Y influences expression of hundreds of genes genome-wide, possibly by sequestering key components of the heterochromatin machinery away from other positions in the genome. To test the influence of the Y chromosome on the genome-wide chromatin landscape, we assayed the genomic distribution of histone modifications associated with gene activation (H3K4me3) or heterochromatin (H3K9me2 and H3K9me3) in fruit flies with varying sex chromosome complements (X0, XY, and XYY males; XX and XXY females). Consistent with the general deficiency of active chromatin modifications on the Y, we find that Y gene dose has little influence on the genomic distribution of H3K4me3. In contrast, both the presence and the number of Y chromosomes strongly influence genome-wide enrichment patterns of repressive chromatin modifications. Highly repetitive regions such as the pericentromeres, the dot, and the Y chromosome (if present) are enriched for heterochromatic modifications in wildtype males and females, and even more strongly in X0 flies. In contrast, the additional Y chromosome in XYY males and XXY females diminishes the heterochromatic signal in these normally silenced, repeat-rich regions, which is accompanied by an increase in expression of Y-linked repeats. We find hundreds of genes that are expressed differentially between individuals with aberrant sex chromosome karyotypes, many of which also show sex-biased expression in wildtype Drosophila. Thus, Y chromosomes influence heterochromatin integrity genome-wide, and differences in the chromatin landscape of males and females may also contribute to sex-biased gene expression and sexual dimorphisms.

Keywords: Drosophila; Y chromosome; chromatin sink; heterochromatin; sex chromosomes.


Figures

<sc>Fig</sc>. 1.
Fig. 1.
Chromosome structure of Drosophila melanogaster and crossing scheme utilized. (A) The left and right arms of chromosomes 2 (2L, 2R) and 3 (3L, 3R), the small chromosome 4 (the dot chromosome), and the sex chromosomes X and Y are shown (adapted from Hoskins et al. [2002]). The numbers correspond to approximate lengths in megabases but will differ among Drosophila strains. (B) Flow cytometry estimates of the mean diploid genome size of the five karyotypes investigated (based on three replicate measures). The approximate heterochromatin content for the strains investigated is indicated, assuming that the euchromatic size is constant for all chromosomes (i.e., 232 Mb for flies with 2 X chromosomes, and 210 Mb for flies with a single X chromosome, see A). (C) Crossing scheme utilized to obtain X0 and XYY males, and XXY females (only sex chromosomes are shown). Wildtype Canton-S males and females were crossed to the 2549 strain whose females have C(1)RM and males have C(1;Y). Circled karyotypes were used for the analyses.
<sc>Fig</sc>. 2.
Fig. 2.
Enrichment of H3K4me3 for Drosophila melanogaster strains with different karyotypes across the euchromatin/heterochromatin boundary along each chromosome arm. We show the centromere-proximal 1-Mb euchromatic region of chromosomes 2, 3, and X, as well as the complete assembled heterochromatin region for each chromosome. For each karyotype, the enrichment in 5-kb windows is shown in red lines (normalized ratio of ChIP to input, see Materials and Methods), and the same data are shown in gray scale according to the scale in the upper right. Note that the enrichment profiles for all five karyotypes are plotted on the same scale to allow for direct comparisons. Below the enrichment profiles for each chromosome arm, subtraction plots show the absolute difference in signal of 5-kb windows between pairs of karyotypes along the chromosome arms. The cytogenomically defined heterochromatin is marked by gray bars and the euchromatin/heterochromatin boundary is indicated by a yellow arrow. The box plots show the ChIP signal for all 5-kb windows in different chromosomal regions, with boxes extending from the first to the third quartile and whiskers to the most extreme data point within 1.5 times the interquantile range. P values were calculated relative to XX females for XY males and XXY females and relative to XY males for X0 and XYY males; P values for the Y chromosome were calculated relative to XY males (Wilcoxon test). For genome-wide enrichment plots, see supplementary figure S13, Supplementary Material online.
<sc>Fig</sc>. 3.
Fig. 3.
Enrichment of H3K9me2 for Drosophila melanogaster strains with different karyotypes across the euchromatin/heterochromatin boundary along each chromosome arm. We show the centromere-proximal 1-Mb euchromatic region of chromosomes 2, 3, and X, as well as the complete assembled heterochromatin region for each chromosome. For each karyotype, the enrichment in 5-kb windows is shown in red lines (normalized ratio of ChIP to input, see Materials and Methods), and the same data are shown in gray scale according to the scale in the upper right. Note that the enrichment profiles for all five karyotypes are plotted on the same scale to allow for direct comparisons. Below the enrichment profiles for each chromosome arm, subtraction plots show the absolute difference in signal of 5-kb windows between pairs of karyotypes along the chromosome arms. The cytogenomically defined heterochromatin is marked by gray bars and the euchromatin/heterochromatin boundary is indicated by a yellow arrow. The box plots show the ChIP signal for all 5-kb windows in different chromosomal regions, with boxes extending from the first to the third quartile and whiskers to the most extreme data point within 1.5 times the interquantile range. P values were calculated relative to XX females for XY males and XXY females and relative to XY males for X0 and XYY males; P values for the Y chromosome were calculated relative to XY males (Wilcoxon test).
<sc>Fig</sc>. 4.
Fig. 4.
Enrichment of H3K9me3 for Drosophila melanogaster strains with different karyotypes across the euchromatin/heterochromatin boundary along each chromosome arm. These plots were made in the same manner as those for H3K9me2 (see fig. 3).
<sc>Fig</sc>. 5.
Fig. 5.
Enrichment of H3K9me2 within 1 Mb of the heterochromatin/euchromatin boundaries (as defined in the Release 6 of the Drosophila melanogaster genome [Hoskins et al. 2015]). The upper panels show H3K9me2 signal in 5-kb windows for each chromosome arm, and the bottom panel shows scaled heatmaps for the same 5-kb windows, to allow direct comparisons of H3K9me2 signal across samples. For H3K9me3 plots, see supplementary figure S16, Supplementary Material online. Box plots show H3K9me2 signal of 5-kb windows in euchromatic regions 1 Mb outside the pericentromere versus 1 Mb inside the heterochromatin/euchromatin boundary. Significance values are all calculated using the Wilcoxon test.
<sc>Fig</sc>. 6.
Fig. 6.
Gene expression variation between flies with different sex chromosome karyotypes. (A) Pairwise expression comparisons for flies with different karyotypes. Genes marked in red are susceptible to YRV (Sackton and Hartl 2013), genes in blue are sensitive to rDNA copy number (Paredes et al. 2011), and genes in yellow are genetically defined Su(var) and E(var) genes in Drosophila melanogaster (Elgin and Reuter 2013); gray genes are all other genes. (B) Overlap of top 1,000 differentially expressed genes between wildtype XY male and XX female, and males and females with and without Y chromosomes, that is, XX versus XXY females and XY versus X0 males.
<sc>Fig</sc>. 7.
Fig. 7.
Chromatin and expression patterns at TE families. Shown is enrichment of H3K9me2 at different TE families (relative to genome-wide levels) and their expression levels for the various karyotypes. For H3K9me3 plots, see supplementary figure S24, Supplementary Material online. (A) All repeats from the library of consensus TEs and satellites from FlyBase. Boxplots summarize H3K9me2 and expression values across all repeats, and significance values were calculated using the Wilcoxon test; all comparisons of expression levels were not significant. (B) Putatively Y-linked (male-specific) de novo assembled repeats only. Boxplots summarize H3K9me2 and expression values across all putatively Y-linked repeats, and P values were calculated relative to XY males using the Wilcoxon test.

References

    1. Alekseyenko A, Larschan E, Lai W, Park P, Kuroda M.. 2006. High-resolution ChIP-chip analysis reveals that the Drosophila MSL complex selectively identifies active genes on the male X chromosome. Genes Dev. 20(7):848–857. - PMC - PubMed
    1. Ananiev EV, Barsky VE, Ilyin YV, Ryzic MV.. 1984. The arrangement of transposable elements in the polytene chromosomes of Drosophila melanogaster. Chromosoma 90(5):366–377.
    1. Assis R, Zhou Q, Bachtrog D.. 2012. Sex-biased transcriptome evolution in Drosophila. Genome Biol Evol. 4(11):1189–1200. - PMC - PubMed
    1. Baker WK. 1968. Position-effect variegation In: Caspari EW, editor. Advances in genetics. Academic Press; p. 133–169. - PubMed
    1. Belyaeva ES, Demakova OV, Umbetova GH, Zhimulev IF.. 1993. Cytogenetic and molecular aspects of position-effect variegation in Drosophila melanogaster. V. Heterochromatin-associated protein HP1 appears in euchromatic chromosomal regions that are inactivated as a result of position-effect variegation. Chromosoma 102(8):583–590. - PubMed

Publication types

Substances