

Longitudinal mouse-PET imaging: a reliable method for estimating binding parameters without a reference region or blood sampling
- PMID: 32211931
- PMCID: PMC7515949
- DOI: 10.1007/s00259-020-04755-5
Longitudinal mouse-PET imaging: a reliable method for estimating binding parameters without a reference region or blood sampling
Abstract
Longitudinal mouse PET imaging is becoming increasingly popular due to the large number of transgenic and disease models available but faces challenges. These challenges are related to the small size of the mouse brain and the limited spatial resolution of microPET scanners, along with the small blood volume making arterial blood sampling challenging and impossible for longitudinal studies. The ability to extract an input function directly from the image would be useful for quantification in longitudinal small animal studies where there is no true reference region available such as TSPO imaging.
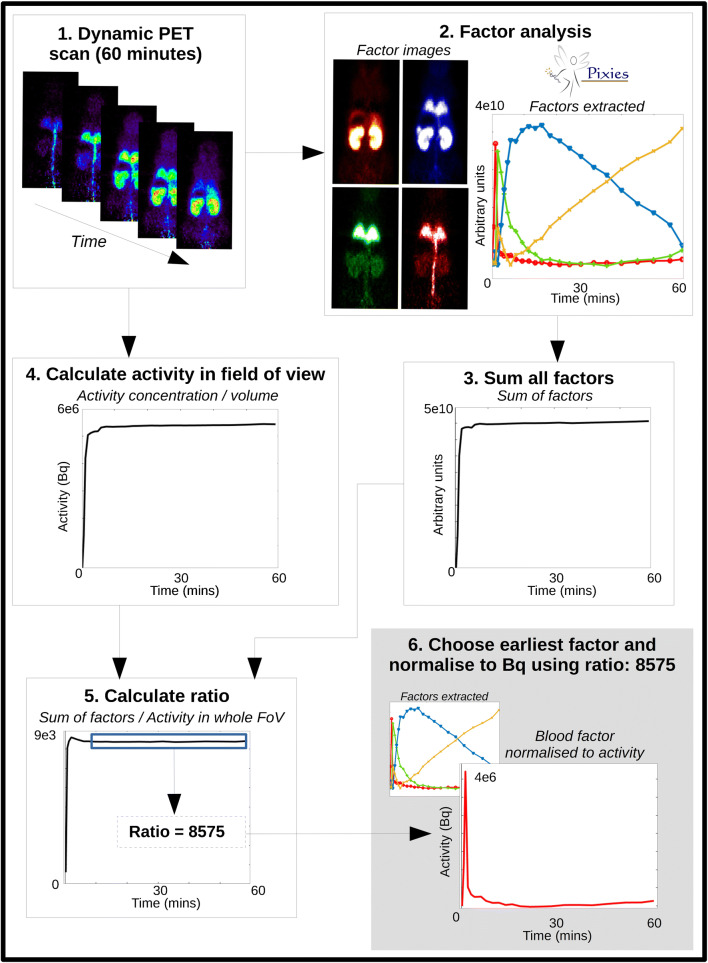
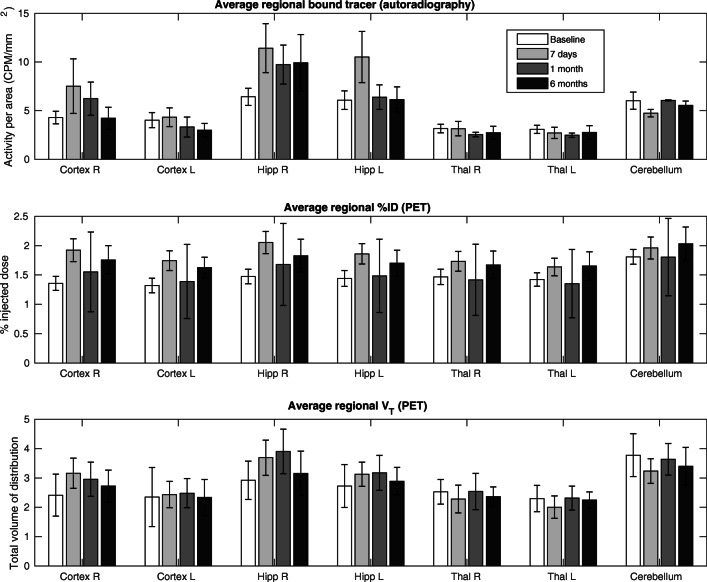
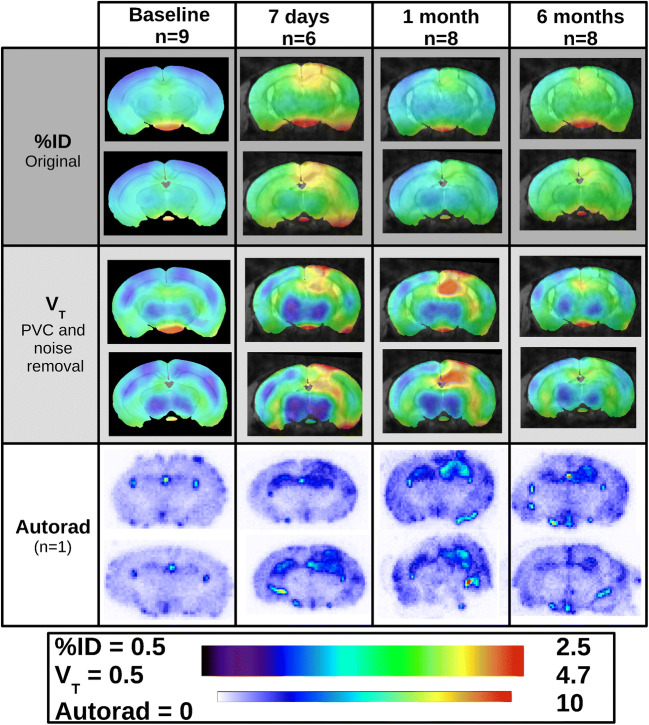
Methods: Using dynamic, whole-body 18F-DPA-714 PET scans (60 min) in a mouse model of hippocampal sclerosis, we applied a factor analysis (FA) approach to extract an image-derived input function (IDIF). This mouse-specific IDIF was then used for 4D-resolution recovery and denoising (4D-RRD) that outputs a dynamic image with better spatial resolution and noise properties, and a map of the total volume of distribution (VT) was obtained using a basis function approach in a total of 9 mice with 4 longitudinal PET scans each. We also calculated percent injected dose (%ID) with and without 4D-RRD. The VT and %ID parameters were compared to quantified ex vivo autoradiography using regional correlations of the specific binding from autoradiography against VT and %ID parameters.
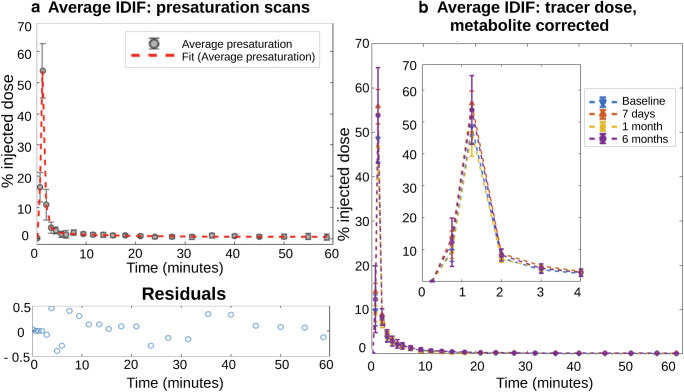
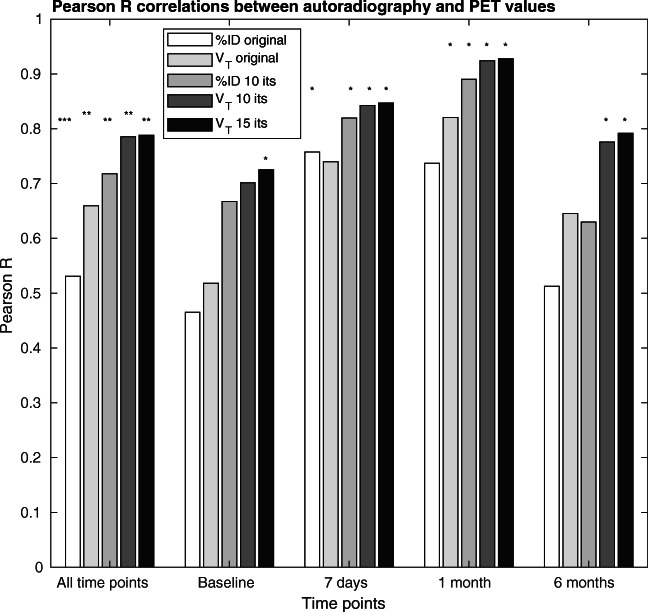
Results: The peaks of the IDIFs were strongly correlated with the injected dose (Pearson R = 0.79). The regional correlations between the %ID estimates and autoradiography were R = 0.53 without 4D-RRD and 0.72 with 4D-RRD over all mice and scans. The regional correlations between the VT estimates and autoradiography were R = 0.66 without 4D-RRD and 0.79 with application of 4D-RRD over all mice and scans.
Conclusion: We present a FA approach for IDIF extraction which is robust, reproducible and can be used in quantification methods for resolution recovery, denoising and parameter estimation. We demonstrated that the proposed quantification method yields parameter estimates closer to ex vivo measurements than semi-quantitative methods such as %ID and is immune to tracer binding in tissue unlike reference tissue methods. This approach allows for accurate quantification in longitudinal PET studies in mice while avoiding repeated blood sampling.
Keywords: Factor analysis; Image-derived input function; Mouse; PET; TSPO.
Conflict of interest statement
The authors declare that they have no competing interests.
Figures
References
-
- Morris ED, Endres CJ, Schmidt KC, Christian BT, Muzic RF, Fisher RE. Kinetic modeling in positron emission tomography. Emission Tomography: The Fundamentals of PET and SPECT. Elsevier Inc. 2004: 499–540.
-
- Brackhan M, Bascuñana P, Ross TL, Bengel FM, Bankstahl JP, Bankstahl M. [18 F]GE180 positron emission tomographic imaging indicates a potential double-hit insult in the intrahippocampal kainate mouse model of temporal lobe epilepsy. Epilepsia. 4 ed. Wiley/Blackwell (10.1111); 2018;59(3):617–26. - PubMed
-
- Nguyen D-L, Wimberley CJ, Truillet C, Jego B, Caillé F, Pottier G, et al. Longitudinal positron emission tomography imaging of glial cell activation in a mouse model of mesial temporal lobe epilepsy: toward identification of optimal treatment windows. Epilepsia. Wiley/Blackwell (10.1111); 2018;59(6):1234–44. - PubMed
-
- Wimberley CJ, Angelis G, Boisson F, Callaghan PD, Fischer K, Pichler B, et al. Simulation-based optimisation of the PET data processing for partial saturation approach protocols. Neuroimage. 2014;97:29–40. - PubMed
Publication types
MeSH terms
Grants and funding
LinkOut - more resources
Full Text Sources
