. 2020 Oct;18(4):517-530.
doi: 10.1007/s12021-020-09456-w.

NeAT: a Nonlinear Analysis Toolbox for Neuroimaging

Affiliations

NeAT: a Nonlinear Analysis Toolbox for Neuroimaging

Adrià Casamitjana et al. Neuroinformatics. 2020 Oct.

Abstract

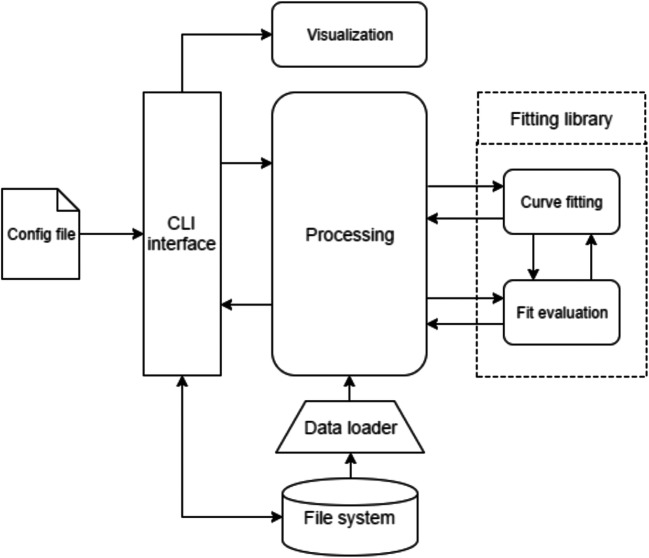
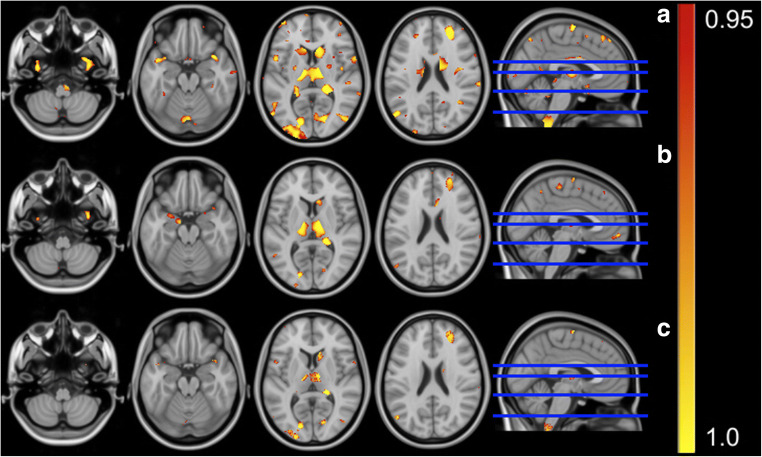
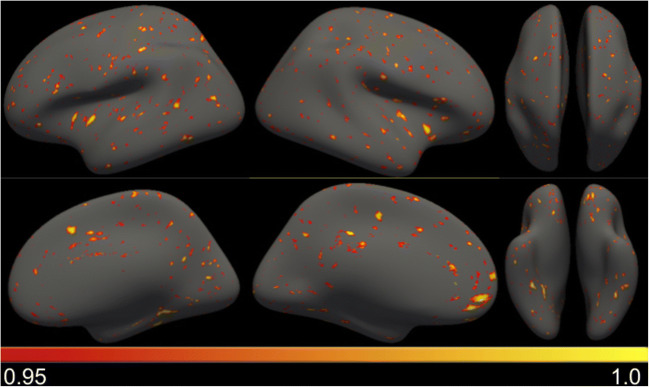
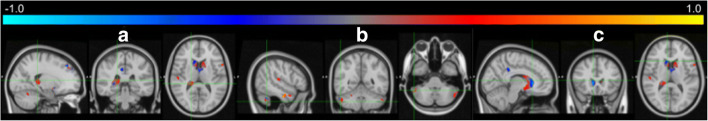
NeAT is a modular, flexible and user-friendly neuroimaging analysis toolbox for modeling linear and nonlinear effects overcoming the limitations of the standard neuroimaging methods which are solely based on linear models. NeAT provides a wide range of statistical and machine learning non-linear methods for model estimation, several metrics based on curve fitting and complexity for model inference and a graphical user interface (GUI) for visualization of results. We illustrate its usefulness on two study cases where non-linear effects have been previously established. Firstly, we study the nonlinear effects of Alzheimer's disease on brain morphology (volume and cortical thickness). Secondly, we analyze the effect of the apolipoprotein APOE-ε4 genotype on brain aging and its interaction with age. NeAT is fully documented and publicly distributed at https://imatge-upc.github.io/neat-tool/ .

Keywords: APOE; Alzheimer's disease; GAM; GLM; SVR; inference; neuroimaging; nonlinear.


Conflict of interest statement

Author Santi Puch is employed by company QMENTA and author Asier Aduriz is employed by company VILYNX. All other authors declare no competing interests.

Figures

Fig. 1
Fig. 1
Toolbox pipeline. The Processing module govern the interaction between all other libraries that will be explained through the manuscript
Fig. 2
Fig. 2
Comparison between different curve fitting models: third order polynomial expansion of GLM (blue), B-splines GAM (green), SVR with polynomial kernel (yellow) and SVR with Gaussian kernel (red). The best-map is used for statistical comparison, showing the best (in terms of F-test) model among all four models with statistical significance using uncorrected p < 0.001 separately for each model. Estimated curves show the variation of gray matter volume (y-axis) and AD-CSF index (x-axis). Based on CSF amyloid-beta and tau levels, the AD-CSF index measures biomarker progression using a single index normalized between 0 (no altered biomarkers) and 2 (full AD-like alteration) (Molinuevo, 2013). The figure on (A) corresponds to the left hippocampus and the figure on (B) corresponds to the right precuneus
Fig. 3
Fig. 3
Curve clustering algorithm run on relevant atrophy patterns along the AD-CSF index using GAM fitting. The number of clusters is set to NC = 6. On the left, we show the relevant voxels color-coded to describe the association of each voxel with each cluster. On the right, we show all curves associated to each cluster (red) and their respective centroid (black)
Fig. 4
Fig. 4
Subject distribution (left) and age distribution (right) along the AD-CSF index of the subset of ADNI used in the analysis. For the subject distribution we compute the histogram while for the age distribution we show a boxplot splitting the AD-CSF index into deciles
Fig. 5
Fig. 5
Statistical comparison maps between three different curve fitting methods (GLM, GAM and SVR with polynomial kernel). We use an RGB map (A) to show regions relevant for each method with the following legend: yellow (only GAM) green (only SVR), light blue (GAM and SVR) and dark blue (GLM, GAM, SVR). We use the best map (B) to show the method with best statistical inference metrics with the following legend: red (GLM), green (GAM), blue (SVR)
Fig. 6
Fig. 6
Generated curves for the evolution of cortical thickness of the left entorhinal (left) and the right parahippocampal (right) regions. For each ROI we use a linear (GLM) and two nonlinear (GAM and SVR with polynomial kernel) models. All three are statistically relevant for the left entorhinal while only the two nonlinear models appear to be relevant for the right hippocampal
Fig. 7
Fig. 7
Statistical inference using volumetric data and different curve fitting modules: using GLM (A), using GAM (B) and using SVR with a polynomial kernel (C). For visualization purposes, statistical significance threshold is set to p < 0.05 uncorrected
Fig. 8
Fig. 8
Statistical inference using cortical thickness data and GLM. For visualization purposes, statistical significance threshold is set to p < 0.05 uncorrected
Fig. 9
Fig. 9
Interaction between age and the APOE-ε4 genotype using second order polynomial expansion of GLM (left) and B-splines GAM (right). Three different regions are shown at each row: (A) right hippocampus, (B) right caudate and (C) right cerebellar crus. Statistical analysis using F-test and uncorrected p < 0.001 threshold with cluster size of 100 voxels. Statistical comparison using the RGB map, where R corresponds to 0 copies of the allele, G to 1 copy and B to 2 copies. Other colors are any possible combination of them, meaning that are relevant for more than one APOE genotype
Fig. 10
Fig. 10
Differences between statistical maps of the HE model using GLM and GAM at different brain ROIs: right hippocampus (A), right caudate (B) and right cerebellar crus (C). A positive (negative) value indicates that GAM (GLM) is statistically better using the f-test metric

References

    1. Ashburner J, Friston KJ. Voxel-based morphometry—The methods. Neuroimage. 2000;11(6):805–821. doi: 10.1006/nimg.2000.0582. - DOI - PubMed
    1. Bateman RJ, Xiong C, Benzinger TL, Fagan AM, Goate A, Fox NC, et al. Clinical and biomarker changes in dominantly inherited Alzheimer's disease. N Engl J Med. 2012;367(9):795–804. doi: 10.1056/NEJMoa1202753. - DOI - PMC - PubMed
    1. Breeze JL, Poline JB, Kennedy DN. Data sharing and publishing in the field of neuroimaging. GigaScience. 2012;1(1):9. doi: 10.1186/2047-217X-1-9. - DOI - PMC - PubMed
    1. Breiman L, Friedman JH. Estimating optimal transformations for multiple regression and correlation. J Am Stat Assoc. 1985;80(391):580–598. doi: 10.1080/01621459.1985.10478157. - DOI
    1. Brett, M., Hanke, M., Cipollini, B., Côté, M. A., Markiewicz, C., Gerhard, S., Larson, E., Lee, G. R., Halchenko, Y., Kastman, E., Morency, F. C., Millman, J., Rokem, A., Gramfort, A., van den Bosch, J. J. F., Subramaniam, K., Nichols, N., Oosterhof, N. N., St-Jean, S., Amirbekian, B., Nimmo-Smith, I., Ghosh, S., Varoquaux, G., Garyfallidis, E. (2016). nibabel: 2.1. 0.

Publication types

Substances